
|
|||||
|
 | |
| |
| |
| |
| |
| |
|
Gene: COL2A1 |
Gene summary for COL2A1 |
| Gene information | Species | Human | Gene symbol | COL2A1 | Gene ID | 1280 |
| Gene name | collagen type II alpha 1 chain | |
| Gene Alias | ANFH | |
| Cytomap | 12q13.11 | |
| Gene Type | protein-coding | GO ID | GO:0001501 | UniProtAcc | P02458 |
Top |
Malignant transformation analysis |
| Identification of the aberrant gene expression in precancerous and cancerous lesions by comparing the gene expression of stem-like cells in diseased tissues with normal stem cells |
| Entrez ID | Symbol | Replicates | Species | Organ | Tissue | Adj P-value | Log2FC | Malignancy |
| 1280 | COL2A1 | GSM4909281 | Human | Breast | IDC | 1.29e-43 | 8.46e-01 | 0.21 |
| 1280 | COL2A1 | GSM4909286 | Human | Breast | IDC | 8.04e-10 | 1.98e-01 | 0.1081 |
| 1280 | COL2A1 | GSM4909297 | Human | Breast | IDC | 7.43e-04 | 1.71e-01 | 0.1517 |
| 1280 | COL2A1 | NCCBC2 | Human | Breast | DCIS | 2.06e-09 | 8.12e-01 | 0.1554 |
| 1280 | COL2A1 | P56T-E | Human | Esophagus | ESCC | 1.75e-02 | 4.13e-01 | 0.1613 |
| 1280 | COL2A1 | P74T-E | Human | Esophagus | ESCC | 3.23e-09 | 3.91e-01 | 0.1479 |
| 1280 | COL2A1 | P76T-E | Human | Esophagus | ESCC | 2.34e-16 | 8.39e-01 | 0.1207 |
| 1280 | COL2A1 | P79T-E | Human | Esophagus | ESCC | 2.12e-31 | 8.14e-01 | 0.1154 |
| 1280 | COL2A1 | P130T-E | Human | Esophagus | ESCC | 5.71e-54 | 1.20e+00 | 0.1676 |
| 1280 | COL2A1 | S014 | Human | Liver | HCC | 3.00e-14 | 8.27e-01 | 0.2254 |
| 1280 | COL2A1 | S015 | Human | Liver | HCC | 1.83e-15 | 7.74e-01 | 0.2375 |
| 1280 | COL2A1 | S016 | Human | Liver | HCC | 2.44e-19 | 1.07e+00 | 0.2243 |
| Page: 1 |
| Tissue | Expression Dynamics | Abbreviation |
| Breast |  | IDC: Invasive ductal carcinoma |
| DCIS: Ductal carcinoma in situ | ||
| Precancer(BRCA1-mut): Precancerous lesion from BRCA1 mutation carriers | ||
| Esophagus | 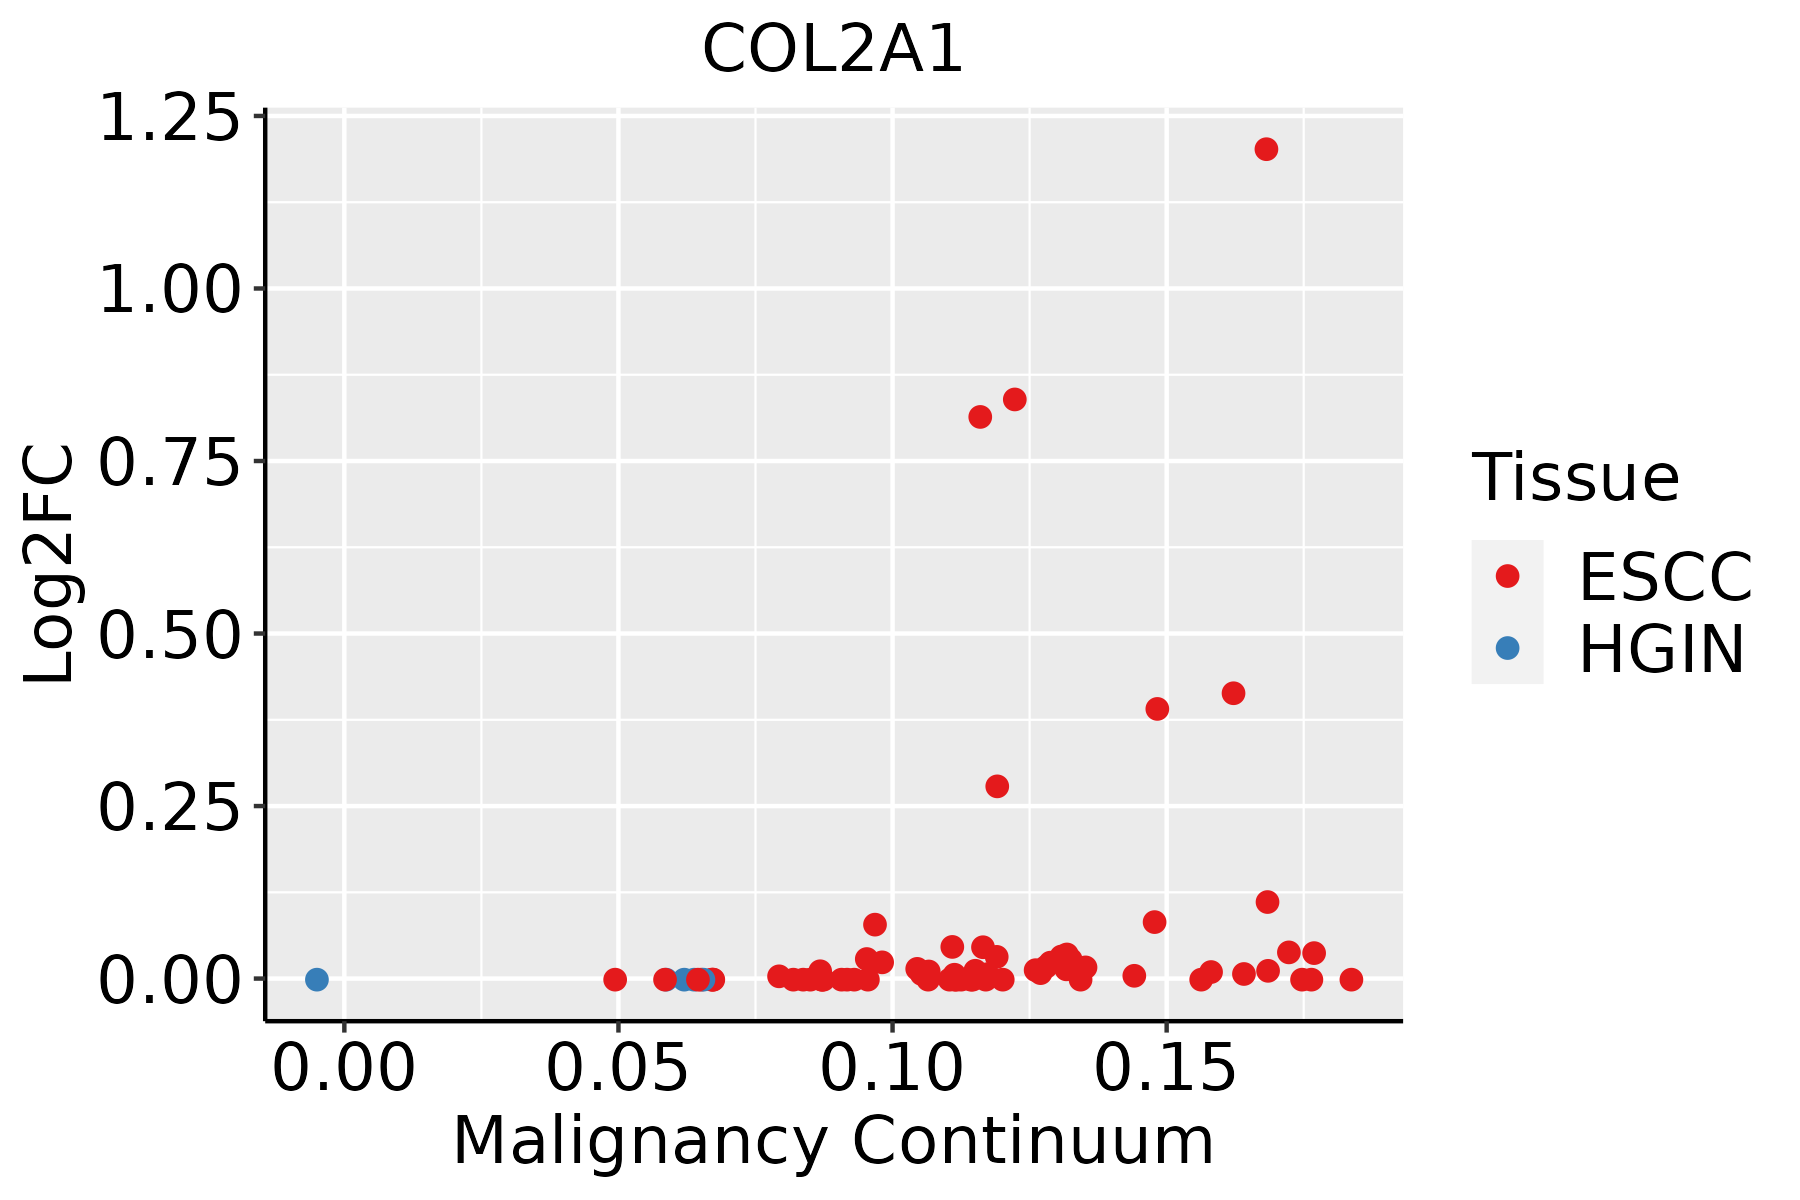 | ESCC: Esophageal squamous cell carcinoma |
| HGIN: High-grade intraepithelial neoplasias | ||
| LGIN: Low-grade intraepithelial neoplasias | ||
| Liver | 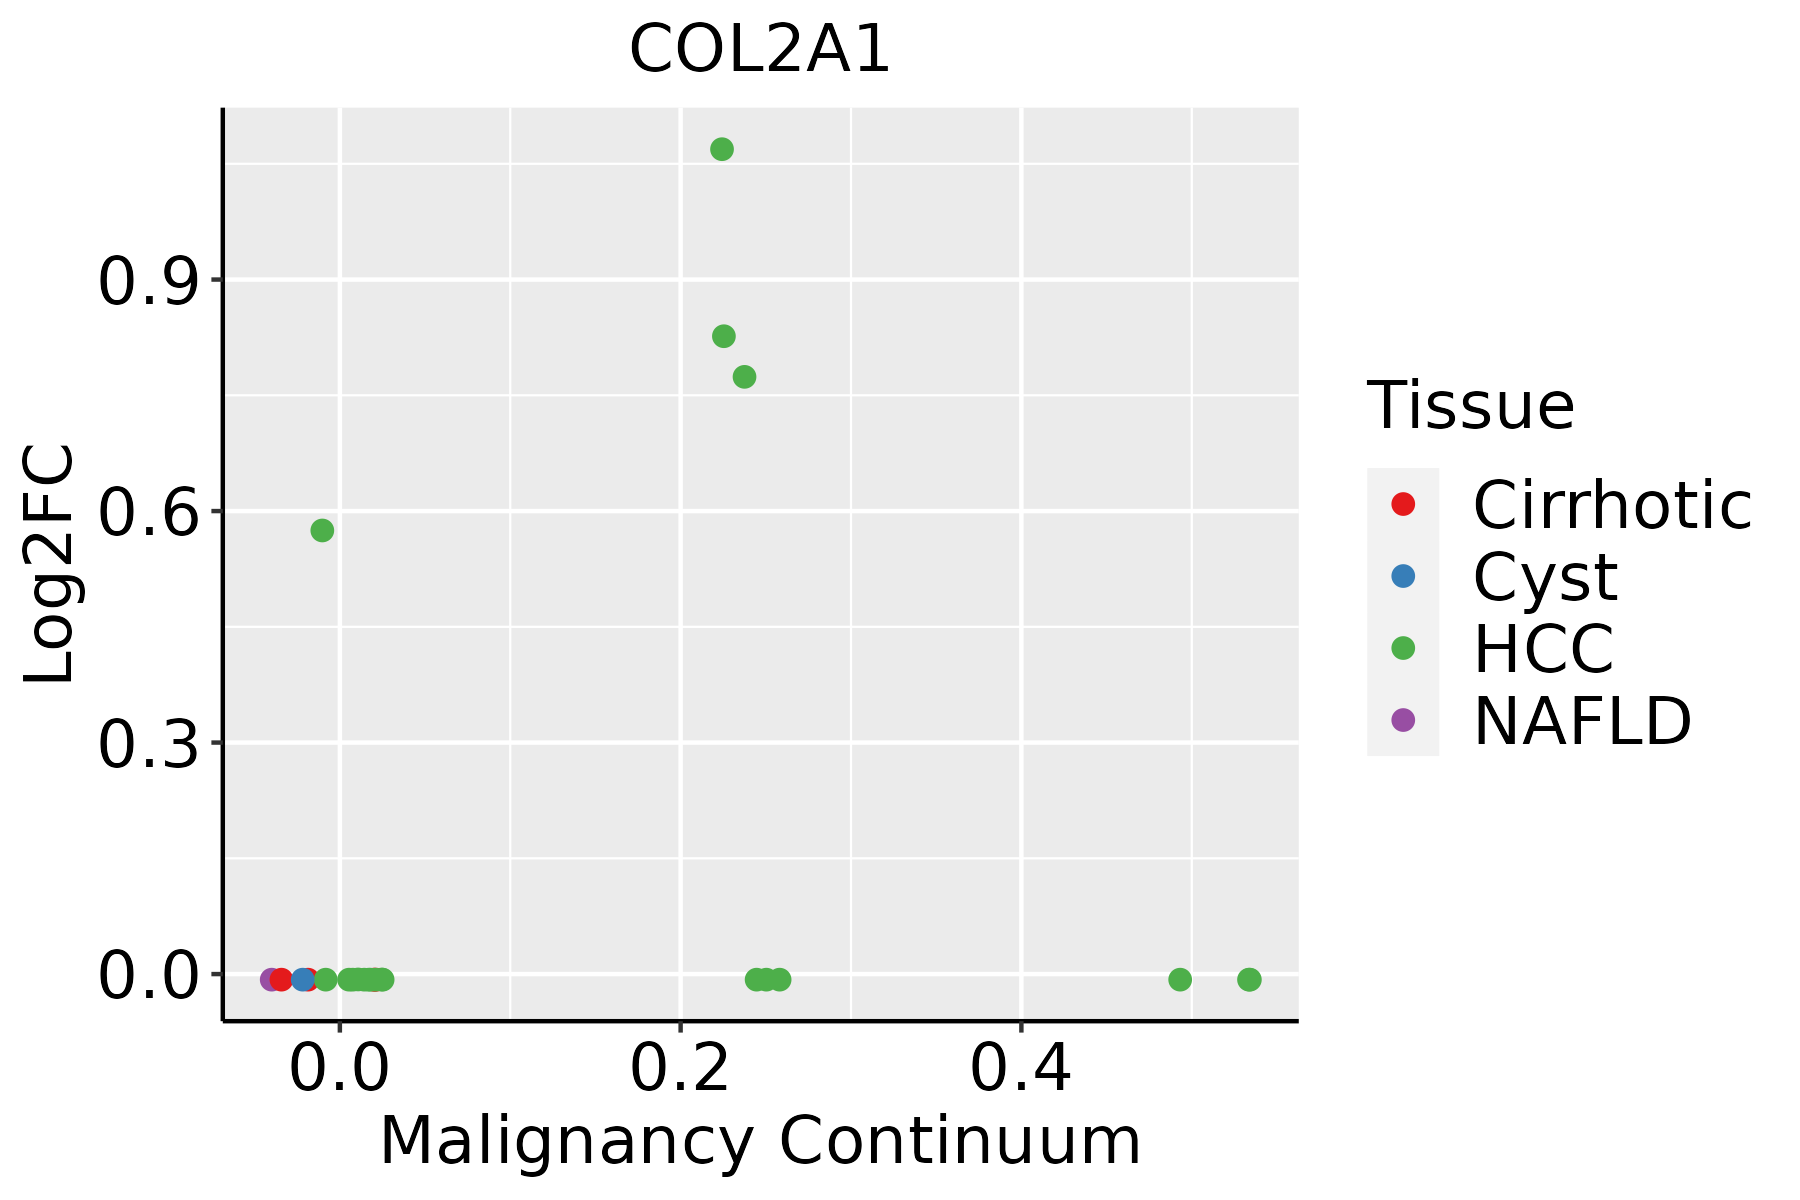 | HCC: Hepatocellular carcinoma |
| NAFLD: Non-alcoholic fatty liver disease |
| ∗log2FC in expression of this searched gene in stem-like cells from each diseased tissue sample relative to stem-like cells in normal samples in each tissue plotted against the malignancy continuum. Samples are colored based on if they are from different disease stage. |
Top |
Malignant transformation related pathway analysis |
| Find out the enriched GO biological processes and KEGG pathways involved in transition from healthy to precancer to cancer |
| Tissue | Disease Stage | Enriched GO biological Processes |
| Colorectum | AD |  |
| Colorectum | SER |  |
| Colorectum | MSS |  |
| Colorectum | MSI-H |  |
| Colorectum | FAP |  |
| ∗Top 15 enriched GO BP terms are showed in the bar plot of each disease state in each tissue. Each row represents a significant GO biological process which is colored according to the -log10(p.adjust). |
| Page: 1 2 3 4 5 6 7 8 9 |
| GO ID | Tissue | Disease Stage | Description | Gene Ratio | Bg Ratio | pvalue | p.adjust | Count |
| GO:200123314 | Breast | IDC | regulation of apoptotic signaling pathway | 82/1434 | 356/18723 | 6.27e-20 | 5.93e-17 | 82 |
| GO:200123414 | Breast | IDC | negative regulation of apoptotic signaling pathway | 49/1434 | 224/18723 | 1.45e-11 | 2.58e-09 | 49 |
| GO:009719114 | Breast | IDC | extrinsic apoptotic signaling pathway | 42/1434 | 219/18723 | 2.56e-08 | 1.73e-06 | 42 |
| GO:200123614 | Breast | IDC | regulation of extrinsic apoptotic signaling pathway | 32/1434 | 151/18723 | 1.07e-07 | 6.26e-06 | 32 |
| GO:200123714 | Breast | IDC | negative regulation of extrinsic apoptotic signaling pathway | 19/1434 | 97/18723 | 1.22e-04 | 2.25e-03 | 19 |
| GO:000150311 | Breast | IDC | ossification | 50/1434 | 408/18723 | 6.51e-04 | 8.04e-03 | 50 |
| GO:000189413 | Breast | IDC | tissue homeostasis | 34/1434 | 268/18723 | 2.54e-03 | 2.28e-02 | 34 |
| GO:200123324 | Breast | DCIS | regulation of apoptotic signaling pathway | 81/1390 | 356/18723 | 3.51e-20 | 3.31e-17 | 81 |
| GO:200123424 | Breast | DCIS | negative regulation of apoptotic signaling pathway | 48/1390 | 224/18723 | 1.70e-11 | 3.22e-09 | 48 |
| GO:009719123 | Breast | DCIS | extrinsic apoptotic signaling pathway | 40/1390 | 219/18723 | 9.43e-08 | 5.28e-06 | 40 |
| GO:200123623 | Breast | DCIS | regulation of extrinsic apoptotic signaling pathway | 31/1390 | 151/18723 | 1.79e-07 | 9.04e-06 | 31 |
| GO:200123723 | Breast | DCIS | negative regulation of extrinsic apoptotic signaling pathway | 18/1390 | 97/18723 | 2.52e-04 | 3.89e-03 | 18 |
| GO:000189423 | Breast | DCIS | tissue homeostasis | 33/1390 | 268/18723 | 2.88e-03 | 2.48e-02 | 33 |
| GO:000150321 | Breast | DCIS | ossification | 45/1390 | 408/18723 | 4.98e-03 | 3.72e-02 | 45 |
| GO:2001233111 | Esophagus | ESCC | regulation of apoptotic signaling pathway | 256/8552 | 356/18723 | 4.11e-24 | 1.04e-21 | 256 |
| GO:0097191111 | Esophagus | ESCC | extrinsic apoptotic signaling pathway | 159/8552 | 219/18723 | 4.12e-16 | 2.94e-14 | 159 |
| GO:2001234111 | Esophagus | ESCC | negative regulation of apoptotic signaling pathway | 161/8552 | 224/18723 | 1.24e-15 | 8.09e-14 | 161 |
| GO:2001236111 | Esophagus | ESCC | regulation of extrinsic apoptotic signaling pathway | 111/8552 | 151/18723 | 2.97e-12 | 1.18e-10 | 111 |
| GO:00091002 | Esophagus | ESCC | glycoprotein metabolic process | 226/8552 | 387/18723 | 2.64e-07 | 3.94e-06 | 226 |
| GO:2001237111 | Esophagus | ESCC | negative regulation of extrinsic apoptotic signaling pathway | 69/8552 | 97/18723 | 3.23e-07 | 4.55e-06 | 69 |
| Page: 1 2 3 |
| Pathway ID | Tissue | Disease Stage | Description | Gene Ratio | Bg Ratio | pvalue | p.adjust | qvalue | Count |
| hsa045109 | Breast | IDC | Focal adhesion | 32/867 | 203/8465 | 8.60e-03 | 4.23e-02 | 3.17e-02 | 32 |
| hsa0451013 | Breast | IDC | Focal adhesion | 32/867 | 203/8465 | 8.60e-03 | 4.23e-02 | 3.17e-02 | 32 |
| hsa0451041 | Liver | HCC | Focal adhesion | 125/4020 | 203/8465 | 3.12e-05 | 1.88e-04 | 1.04e-04 | 125 |
| hsa051652 | Liver | HCC | Human papillomavirus infection | 188/4020 | 331/8465 | 3.34e-04 | 1.49e-03 | 8.29e-04 | 188 |
| hsa0451051 | Liver | HCC | Focal adhesion | 125/4020 | 203/8465 | 3.12e-05 | 1.88e-04 | 1.04e-04 | 125 |
| hsa051653 | Liver | HCC | Human papillomavirus infection | 188/4020 | 331/8465 | 3.34e-04 | 1.49e-03 | 8.29e-04 | 188 |
| Page: 1 |
Top |
Cell-cell communication analysis |
| Identification of potential cell-cell interactions between two cell types and their ligand-receptor pairs for different disease states |
| Ligand | Receptor | LRpair | Pathway | Tissue | Disease Stage |
| Page: 1 |
Top |
Single-cell gene regulatory network inference analysis |
| Find out the significant the regulons (TFs) and the target genes of each regulon across cell types for different disease states |
| TF | Cell Type | Tissue | Disease Stage | Target Gene | RSS | Regulon Activity |
| ∗The dot plots of a searched regulon are shown for all cell subpopulations in each disease state of each tissue based on the regulon specific score inferred using pySCENIC and by calculating the average expression. |
| Page: 1 |
Top |
Somatic mutation of malignant transformation related genes |
| Annotation of somatic variants for genes involved in malignant transformation |
| Hugo Symbol | Variant Class | Variant Classification | dbSNP RS | HGVSc | HGVSp | HGVSp Short | SWISSPROT | BIOTYPE | SIFT | PolyPhen | Tumor Sample Barcode | Tissue | Histology | Sex | Age | Stage | Therapy Types | Drugs | Outcome |
| COL2A1 | SNV | Missense_Mutation | novel | c.1117N>A | p.Ala373Thr | p.A373T | P02458 | protein_coding | tolerated(0.24) | benign(0.005) | TCGA-AN-A046-01 | Breast | breast invasive carcinoma | Female | >=65 | I/II | Unknown | Unknown | SD |
| COL2A1 | SNV | Missense_Mutation | novel | c.1414N>A | p.Glu472Lys | p.E472K | P02458 | protein_coding | deleterious(0.01) | probably_damaging(0.973) | TCGA-AR-A1AQ-01 | Breast | breast invasive carcinoma | Female | <65 | I/II | Chemotherapy | doxorubicin | SD |
| COL2A1 | SNV | Missense_Mutation | c.1148G>A | p.Arg383His | p.R383H | P02458 | protein_coding | deleterious(0.01) | probably_damaging(0.991) | TCGA-BH-A18F-01 | Breast | breast invasive carcinoma | Female | <65 | I/II | Chemotherapy | taxotere | CR | |
| COL2A1 | SNV | Missense_Mutation | novel | c.4235T>A | p.Leu1412His | p.L1412H | P02458 | protein_coding | deleterious(0) | possibly_damaging(0.674) | TCGA-BH-A209-01 | Breast | breast invasive carcinoma | Female | >=65 | I/II | Unknown | Unknown | SD |
| COL2A1 | SNV | Missense_Mutation | c.2548G>C | p.Glu850Gln | p.E850Q | P02458 | protein_coding | deleterious(0) | possibly_damaging(0.518) | TCGA-BH-A209-01 | Breast | breast invasive carcinoma | Female | >=65 | I/II | Unknown | Unknown | SD | |
| COL2A1 | SNV | Missense_Mutation | rs769447809 | c.1598G>A | p.Arg533Gln | p.R533Q | P02458 | protein_coding | deleterious(0.01) | probably_damaging(0.986) | TCGA-E2-A576-01 | Breast | breast invasive carcinoma | Female | >=65 | I/II | Chemotherapy | taxotere | SD |
| COL2A1 | insertion | Nonsense_Mutation | novel | c.195_196insATCTCCAAAAACATTTGCTTCCAAGACACATGAAGGACAGATGT | p.Asp66IlefsTer11 | p.D66Ifs*11 | P02458 | protein_coding | TCGA-A2-A0CP-01 | Breast | breast invasive carcinoma | Female | <65 | I/II | Chemotherapy | cytoxan | SD | ||
| COL2A1 | insertion | Frame_Shift_Ins | novel | c.862_863insCTATCCCT | p.Gly288AlafsTer23 | p.G288Afs*23 | P02458 | protein_coding | TCGA-A2-A0EV-01 | Breast | breast invasive carcinoma | Female | >=65 | I/II | Unknown | Unknown | SD | ||
| COL2A1 | insertion | Frame_Shift_Ins | novel | c.861_862insCCTGTGAGGCATAGGGAGTATT | p.Gly288ProfsTer19 | p.G288Pfs*19 | P02458 | protein_coding | TCGA-A2-A0EV-01 | Breast | breast invasive carcinoma | Female | >=65 | I/II | Unknown | Unknown | SD | ||
| COL2A1 | deletion | Frame_Shift_Del | novel | c.827delN | p.Gly276ValfsTer32 | p.G276Vfs*32 | P02458 | protein_coding | TCGA-EW-A2FV-01 | Breast | breast invasive carcinoma | Female | <65 | III/IV | Chemotherapy | docetaxel | SD |
| Page: 1 2 3 4 5 6 7 8 9 10 11 12 13 14 15 16 |
Top |
Related drugs of malignant transformation related genes |
| Identification of chemicals and drugs interact with genes involved in malignant transfromation |
| (DGIdb 4.0) |
| Entrez ID | Symbol | Category | Interaction Types | Drug Claim Name | Drug Name | PMIDs |
| 1280 | COL2A1 | DRUGGABLE GENOME | COLLAGENASE | COLLAGENASE CLOSTRIDIUM HISTOLYTICUM | ||
| 1280 | COL2A1 | DRUGGABLE GENOME | COLLAGENASE CLOSTRIDIUM HISTOLYTICUM | |||
| 1280 | COL2A1 | DRUGGABLE GENOME | CHEMBL2108709 | COLLAGENASE CLOSTRIDIUM HISTOLYTICUM | ||
| 1280 | COL2A1 | DRUGGABLE GENOME | CHEMBL2095222 | OCRIPLASMIN | ||
| 1280 | COL2A1 | DRUGGABLE GENOME | COLLAGENASE CLOSTRIDIUM HISTOLYTICUM |
| Page: 1 |

Copyright 2023-Present -The University of Texas Health Science Center at Houston |