
|
|||||
|
 | |
| |
| |
| |
| |
| |
|
Gene: COL27A1 |
Gene summary for COL27A1 |
| Gene information | Species | Human | Gene symbol | COL27A1 | Gene ID | 85301 |
| Gene name | collagen type XXVII alpha 1 chain | |
| Gene Alias | STLS | |
| Cytomap | 9q32 | |
| Gene Type | protein-coding | GO ID | GO:0001501 | UniProtAcc | Q8IZC6 |
Top |
Malignant transformation analysis |
| Identification of the aberrant gene expression in precancerous and cancerous lesions by comparing the gene expression of stem-like cells in diseased tissues with normal stem cells |
| Entrez ID | Symbol | Replicates | Species | Organ | Tissue | Adj P-value | Log2FC | Malignancy |
| 85301 | COL27A1 | CCI_1 | Human | Cervix | CC | 2.05e-09 | 9.17e-01 | 0.528 |
| 85301 | COL27A1 | CCI_3 | Human | Cervix | CC | 7.72e-13 | 1.01e+00 | 0.516 |
| 85301 | COL27A1 | CCII_1 | Human | Cervix | CC | 3.53e-03 | 2.99e-01 | 0.3249 |
| 85301 | COL27A1 | sample3 | Human | Cervix | CC | 1.26e-04 | 1.58e-01 | 0.1387 |
| 85301 | COL27A1 | T2 | Human | Cervix | CC | 1.24e-07 | 5.21e-01 | 0.0709 |
| 85301 | COL27A1 | T3 | Human | Cervix | CC | 1.10e-03 | 2.04e-01 | 0.1389 |
| 85301 | COL27A1 | HTA11_8622_2000001021 | Human | Colorectum | SER | 2.44e-02 | 4.15e-01 | 0.0528 |
| 85301 | COL27A1 | HTA11_99999965062_69753 | Human | Colorectum | MSI-H | 3.07e-03 | 7.23e-01 | 0.3487 |
| 85301 | COL27A1 | HTA11_99999965104_69814 | Human | Colorectum | MSS | 1.04e-16 | 5.81e-01 | 0.281 |
| 85301 | COL27A1 | HTA11_99999971662_82457 | Human | Colorectum | MSS | 3.17e-07 | 2.99e-01 | 0.3859 |
| 85301 | COL27A1 | HTA11_99999974143_84620 | Human | Colorectum | MSS | 9.63e-23 | 5.25e-01 | 0.3005 |
| 85301 | COL27A1 | A001-C-007 | Human | Colorectum | CRC | 6.41e-07 | 5.66e-01 | 0.1899 |
| 85301 | COL27A1 | CRC-1-8810 | Human | Colorectum | CRC | 1.60e-16 | 5.98e-01 | 0.6257 |
| 85301 | COL27A1 | CRC-3-11773 | Human | Colorectum | CRC | 4.36e-06 | 3.79e-01 | 0.2564 |
| 85301 | COL27A1 | LZE4T | Human | Esophagus | ESCC | 2.16e-09 | 2.24e-01 | 0.0811 |
| 85301 | COL27A1 | LZE8T | Human | Esophagus | ESCC | 1.59e-05 | 1.88e-01 | 0.067 |
| 85301 | COL27A1 | LZE24T | Human | Esophagus | ESCC | 3.58e-03 | 1.08e-01 | 0.0596 |
| 85301 | COL27A1 | P1T-E | Human | Esophagus | ESCC | 3.82e-04 | 7.82e-01 | 0.0875 |
| 85301 | COL27A1 | P2T-E | Human | Esophagus | ESCC | 1.16e-33 | 7.60e-01 | 0.1177 |
| 85301 | COL27A1 | P4T-E | Human | Esophagus | ESCC | 4.21e-03 | 1.60e-01 | 0.1323 |
| Page: 1 2 3 4 5 6 |
| Tissue | Expression Dynamics | Abbreviation |
| Cervix | 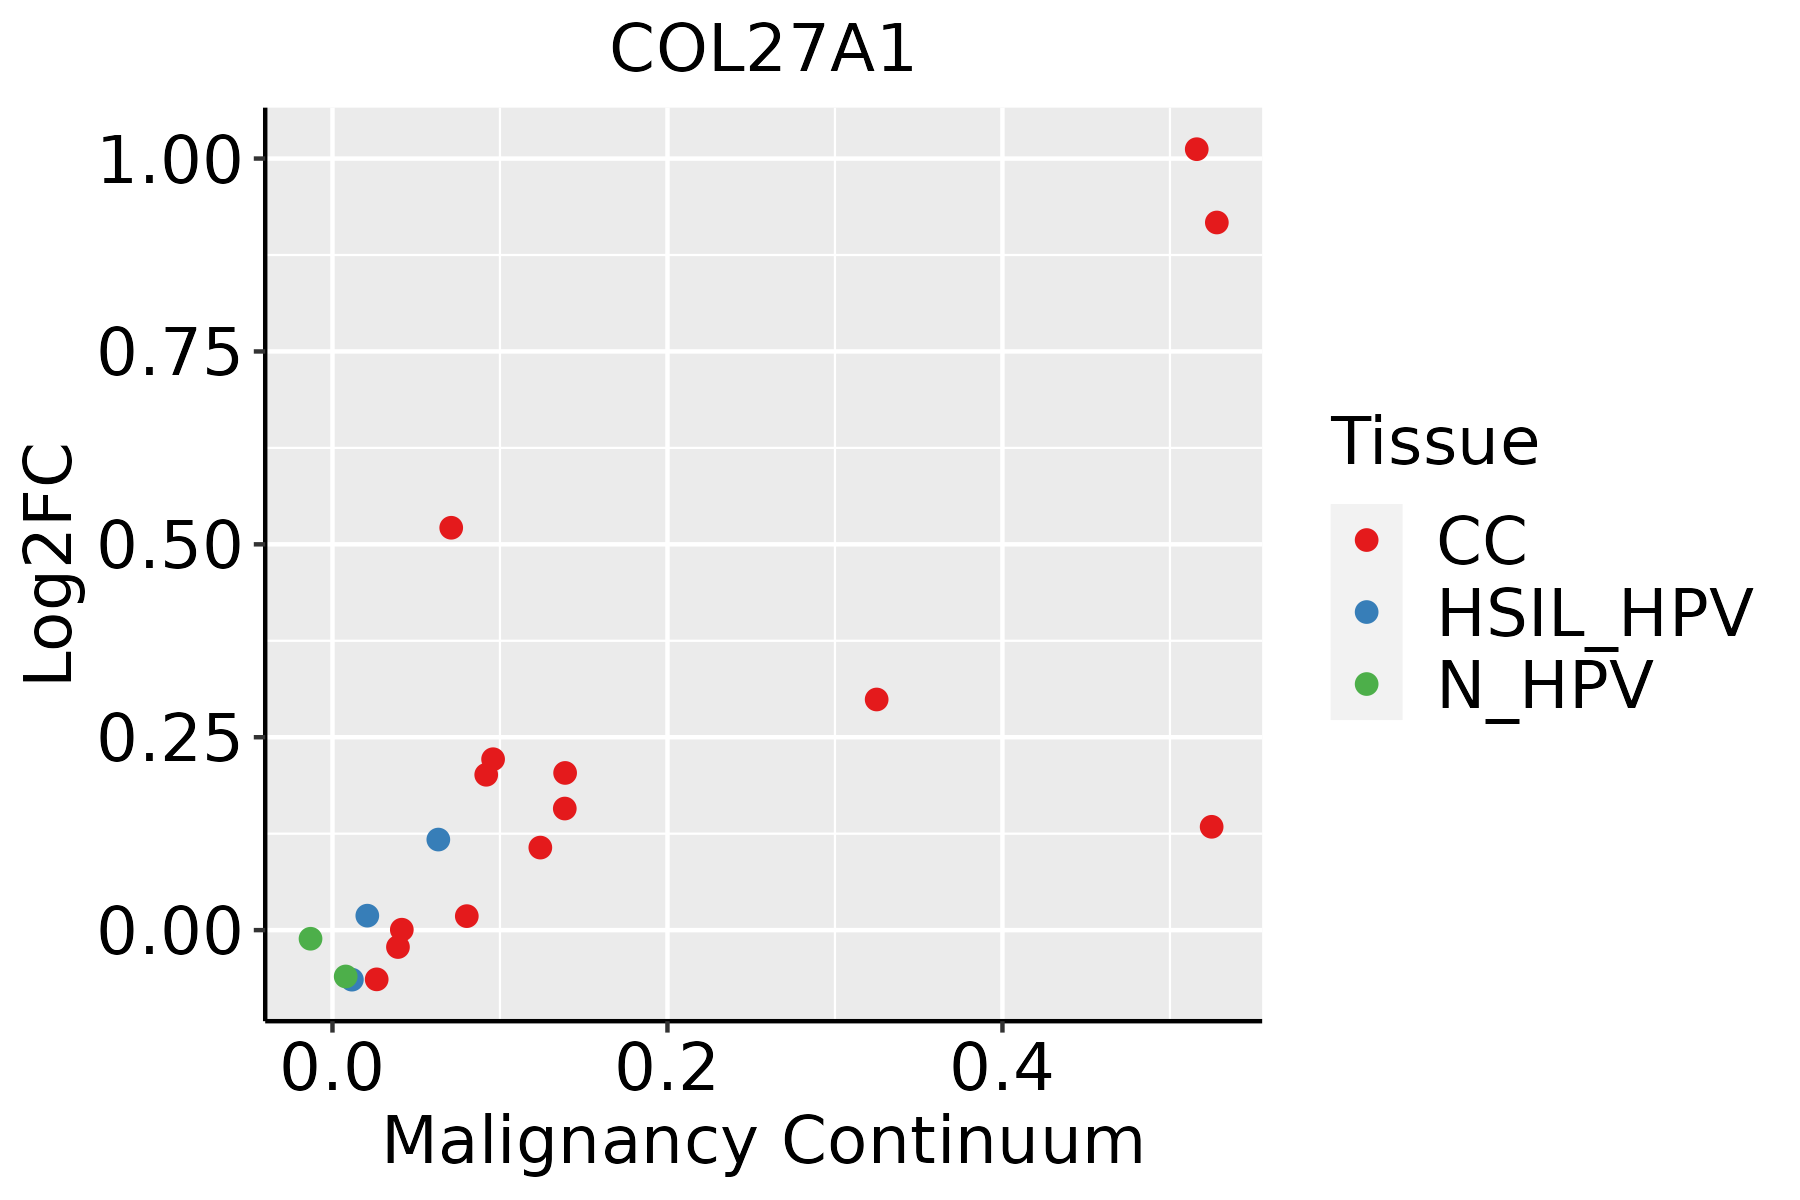 | CC: Cervix cancer |
| HSIL_HPV: HPV-infected high-grade squamous intraepithelial lesions | ||
| N_HPV: HPV-infected normal cervix | ||
| Colorectum (GSE201348) |  | FAP: Familial adenomatous polyposis |
| CRC: Colorectal cancer | ||
| Colorectum (HTA11) | 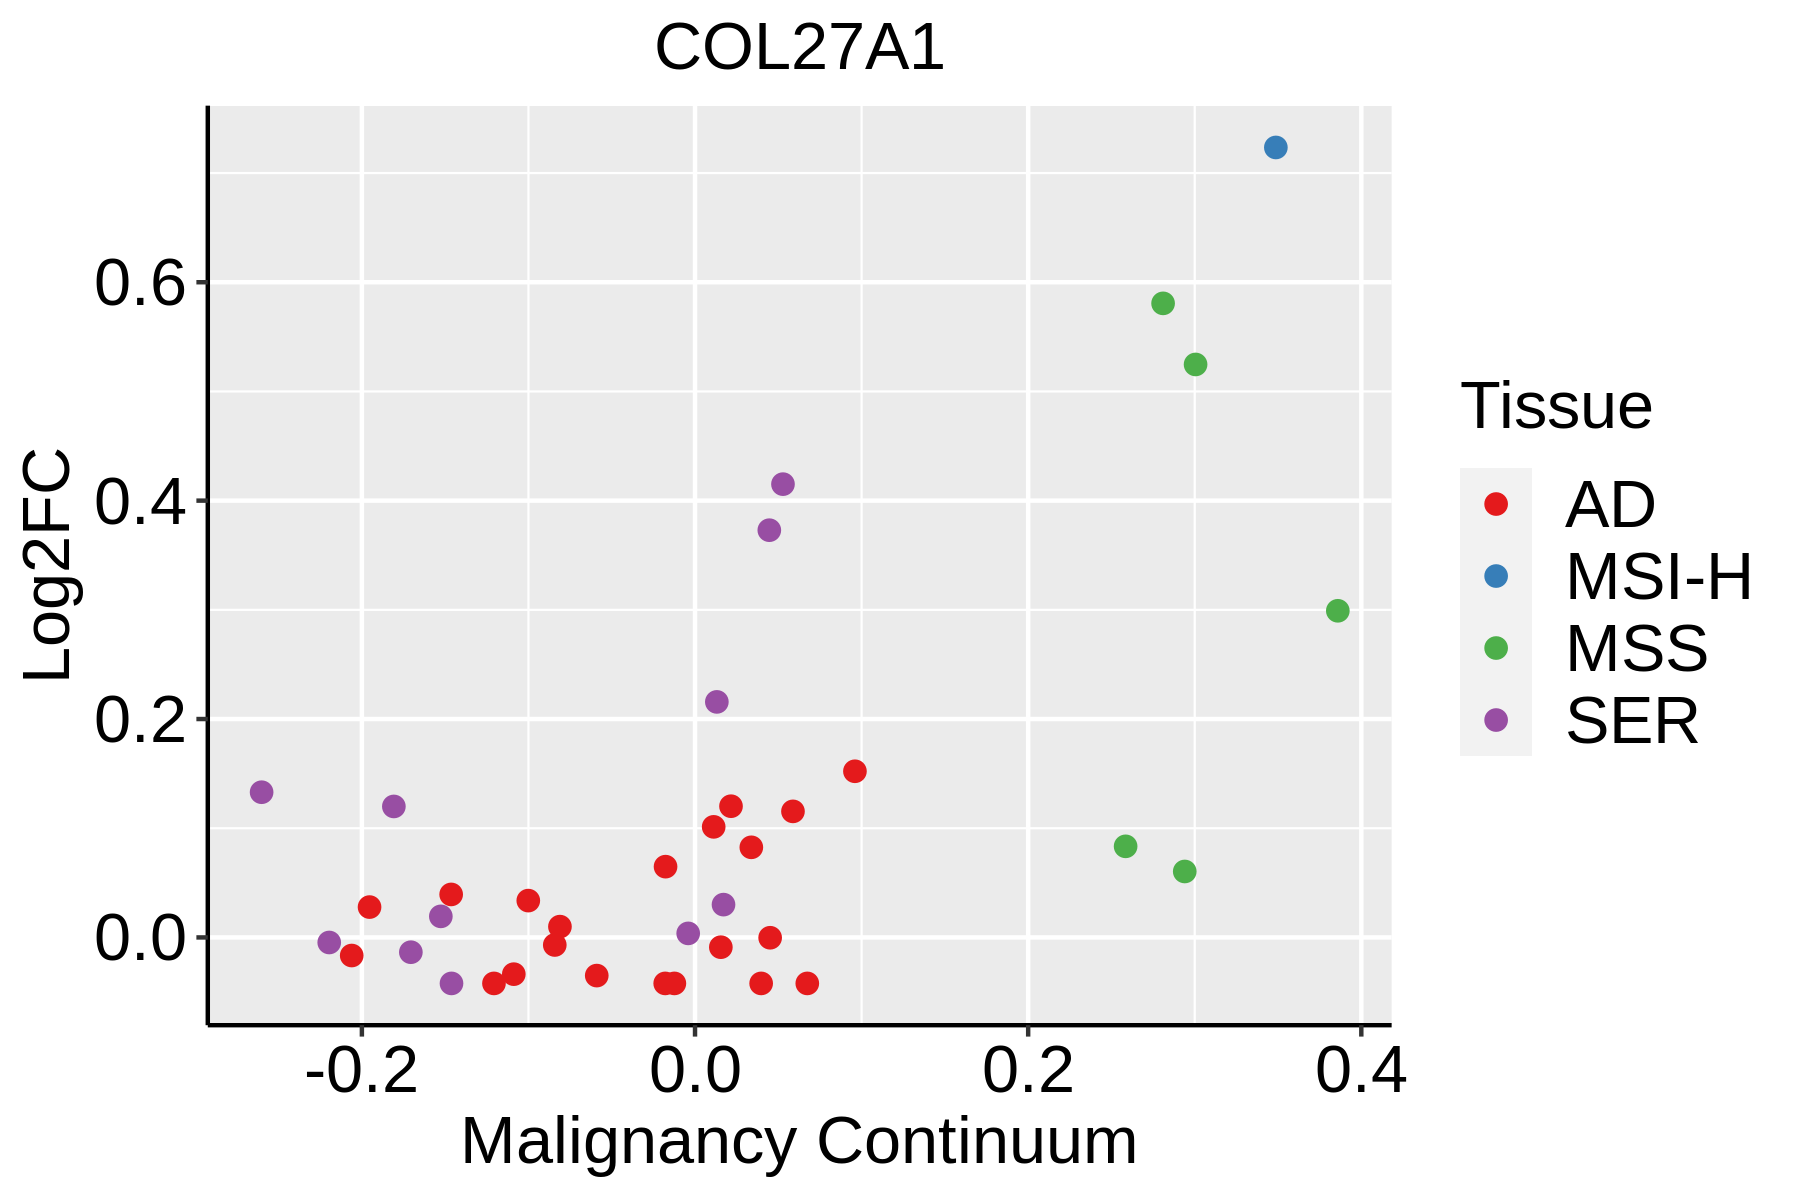 | AD: Adenomas |
| SER: Sessile serrated lesions | ||
| MSI-H: Microsatellite-high colorectal cancer | ||
| MSS: Microsatellite stable colorectal cancer | ||
| Esophagus |  | ESCC: Esophageal squamous cell carcinoma |
| HGIN: High-grade intraepithelial neoplasias | ||
| LGIN: Low-grade intraepithelial neoplasias | ||
| Liver | 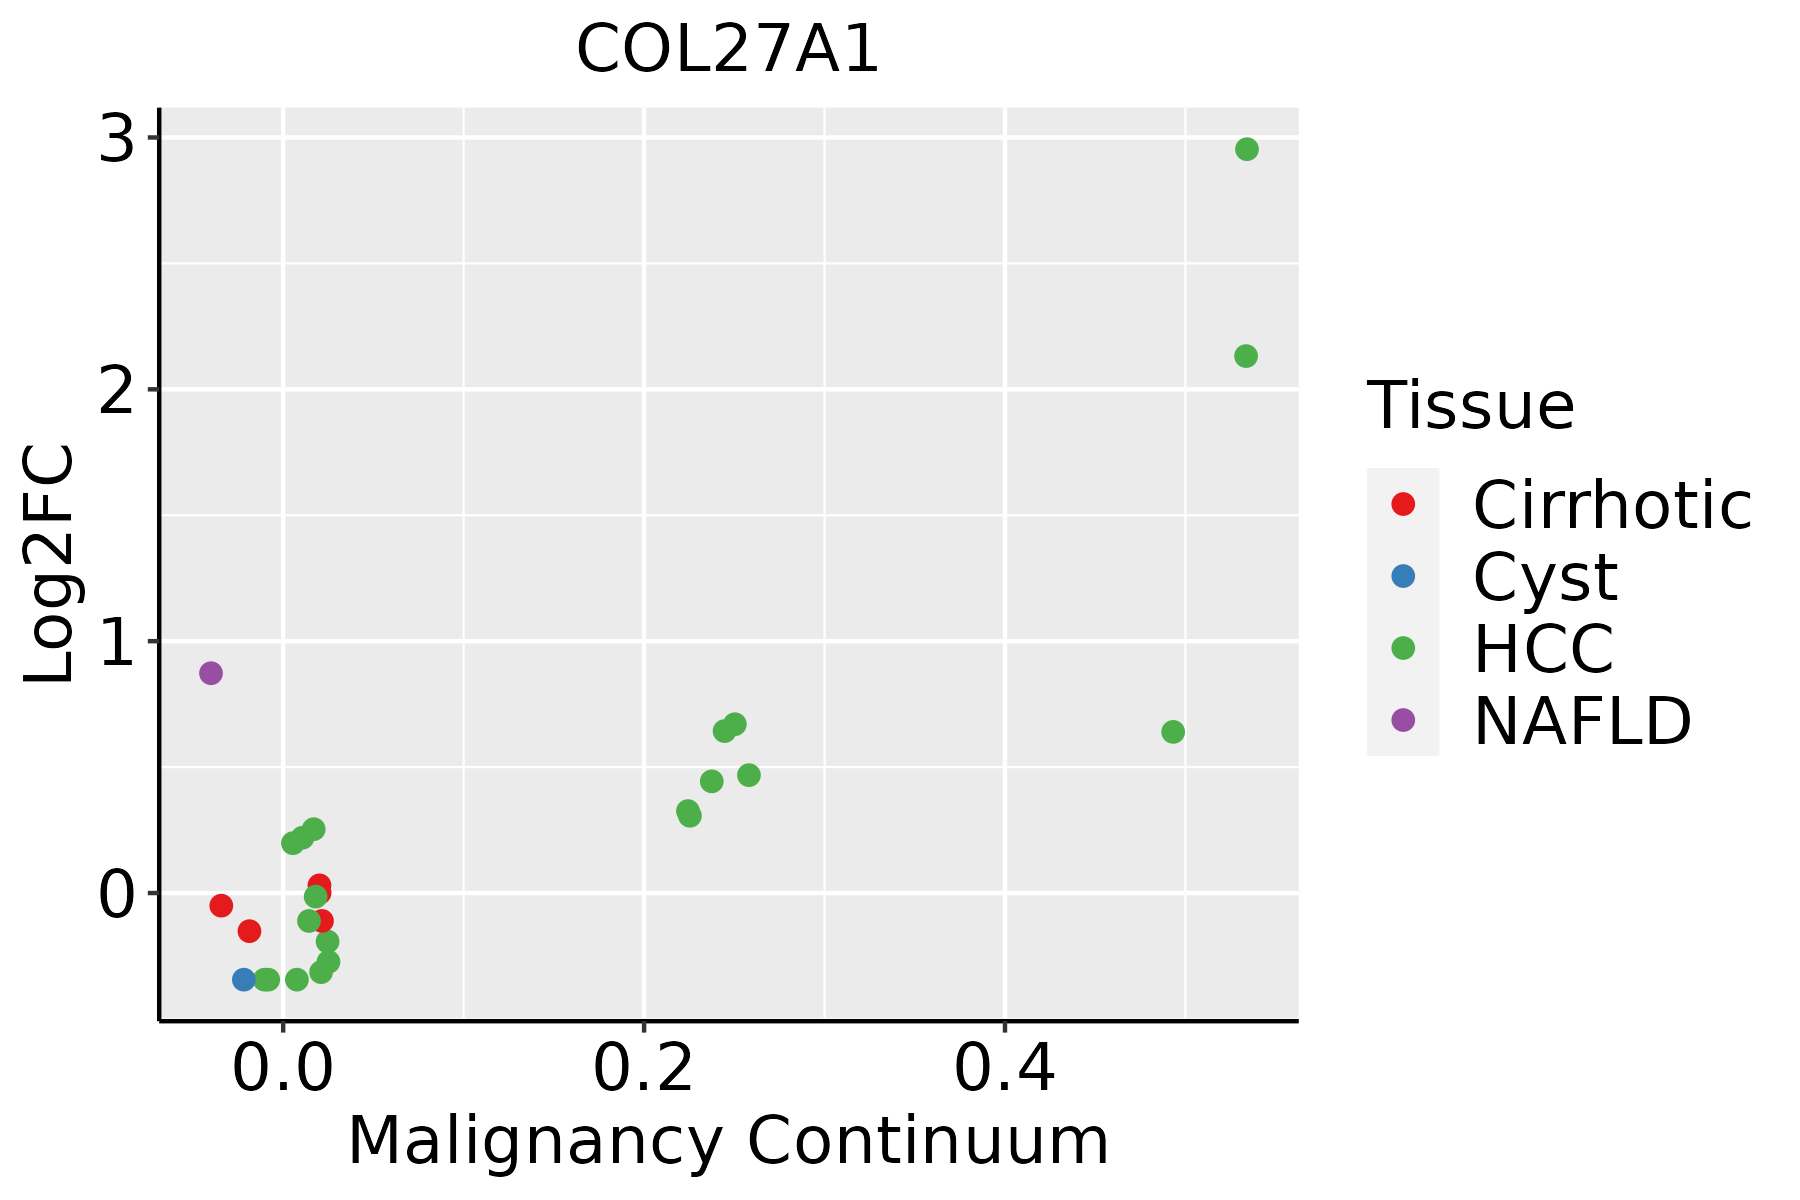 | HCC: Hepatocellular carcinoma |
| NAFLD: Non-alcoholic fatty liver disease | ||
| Oral Cavity | 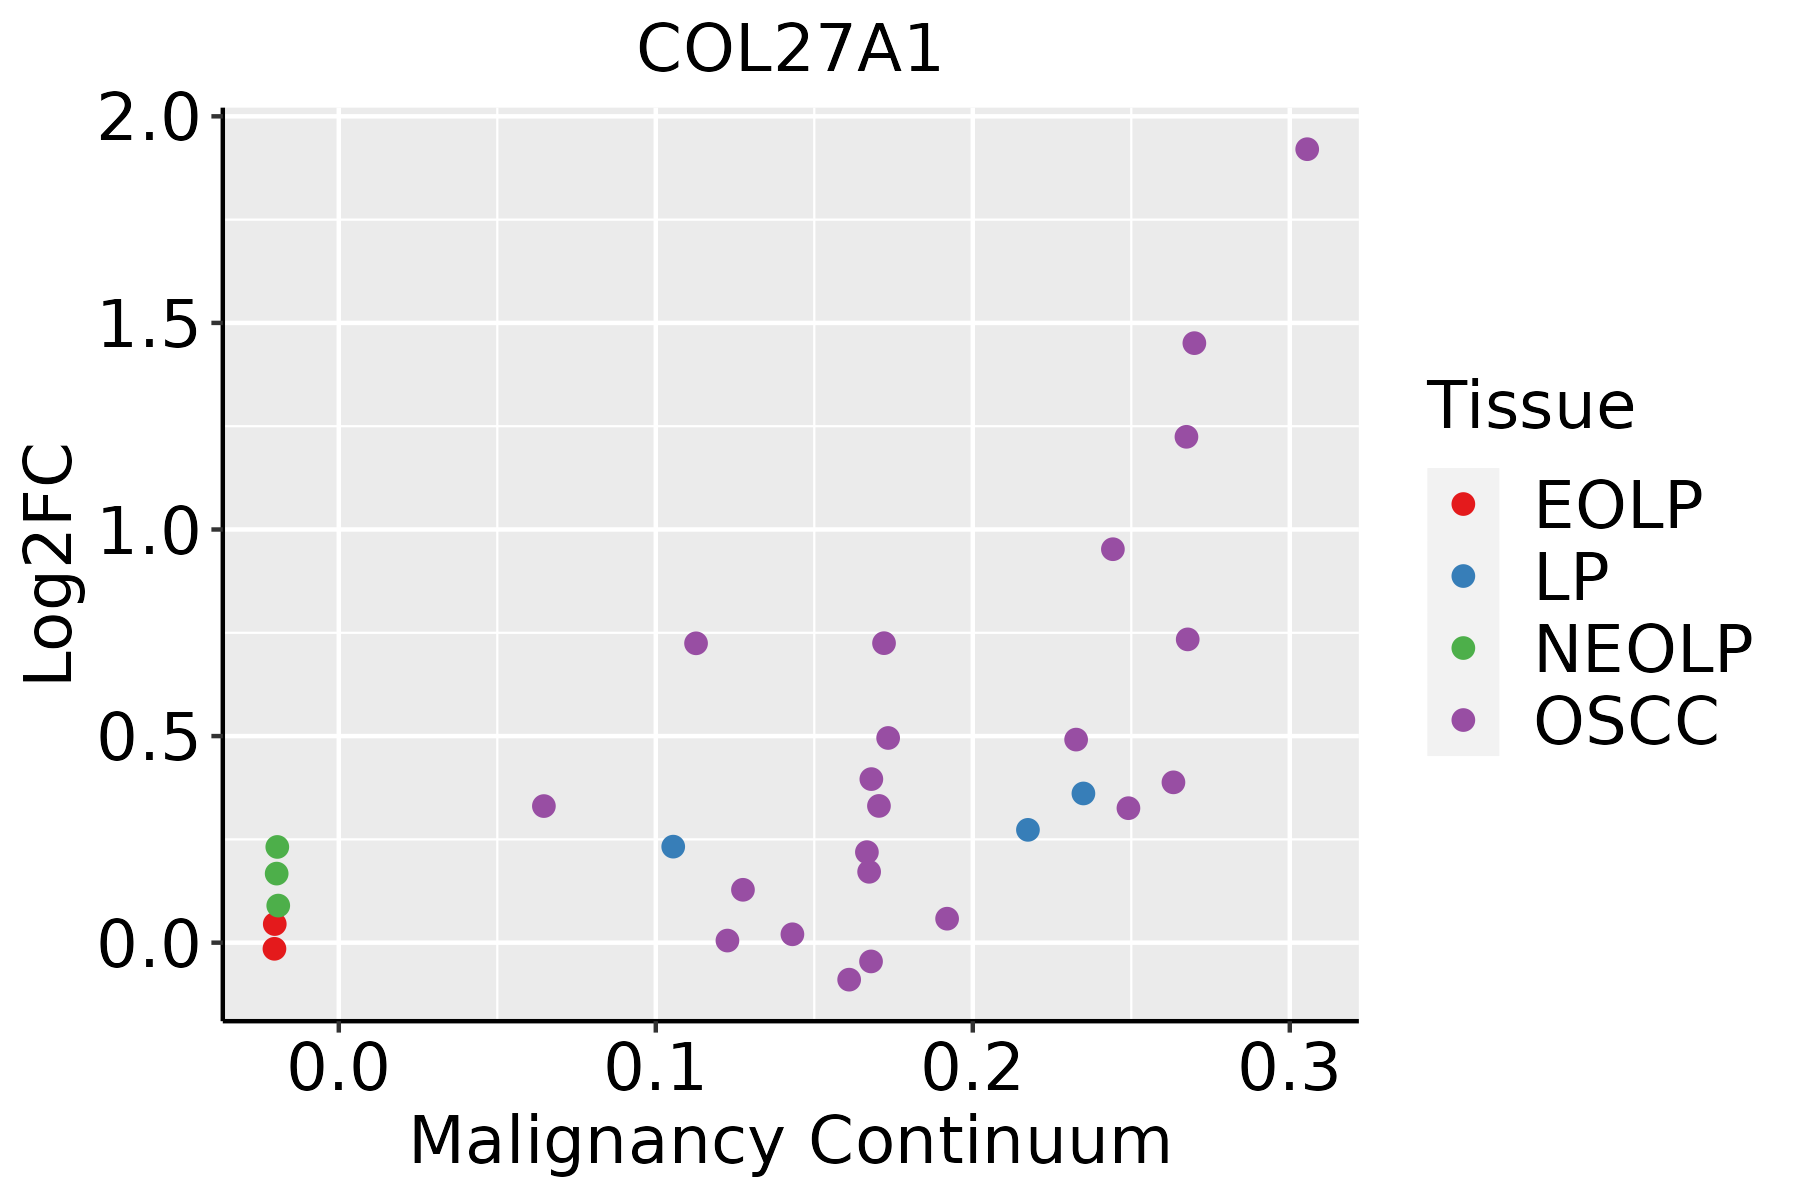 | EOLP: Erosive Oral lichen planus |
| LP: leukoplakia | ||
| NEOLP: Non-erosive oral lichen planus | ||
| OSCC: Oral squamous cell carcinoma | ||
| Thyroid | 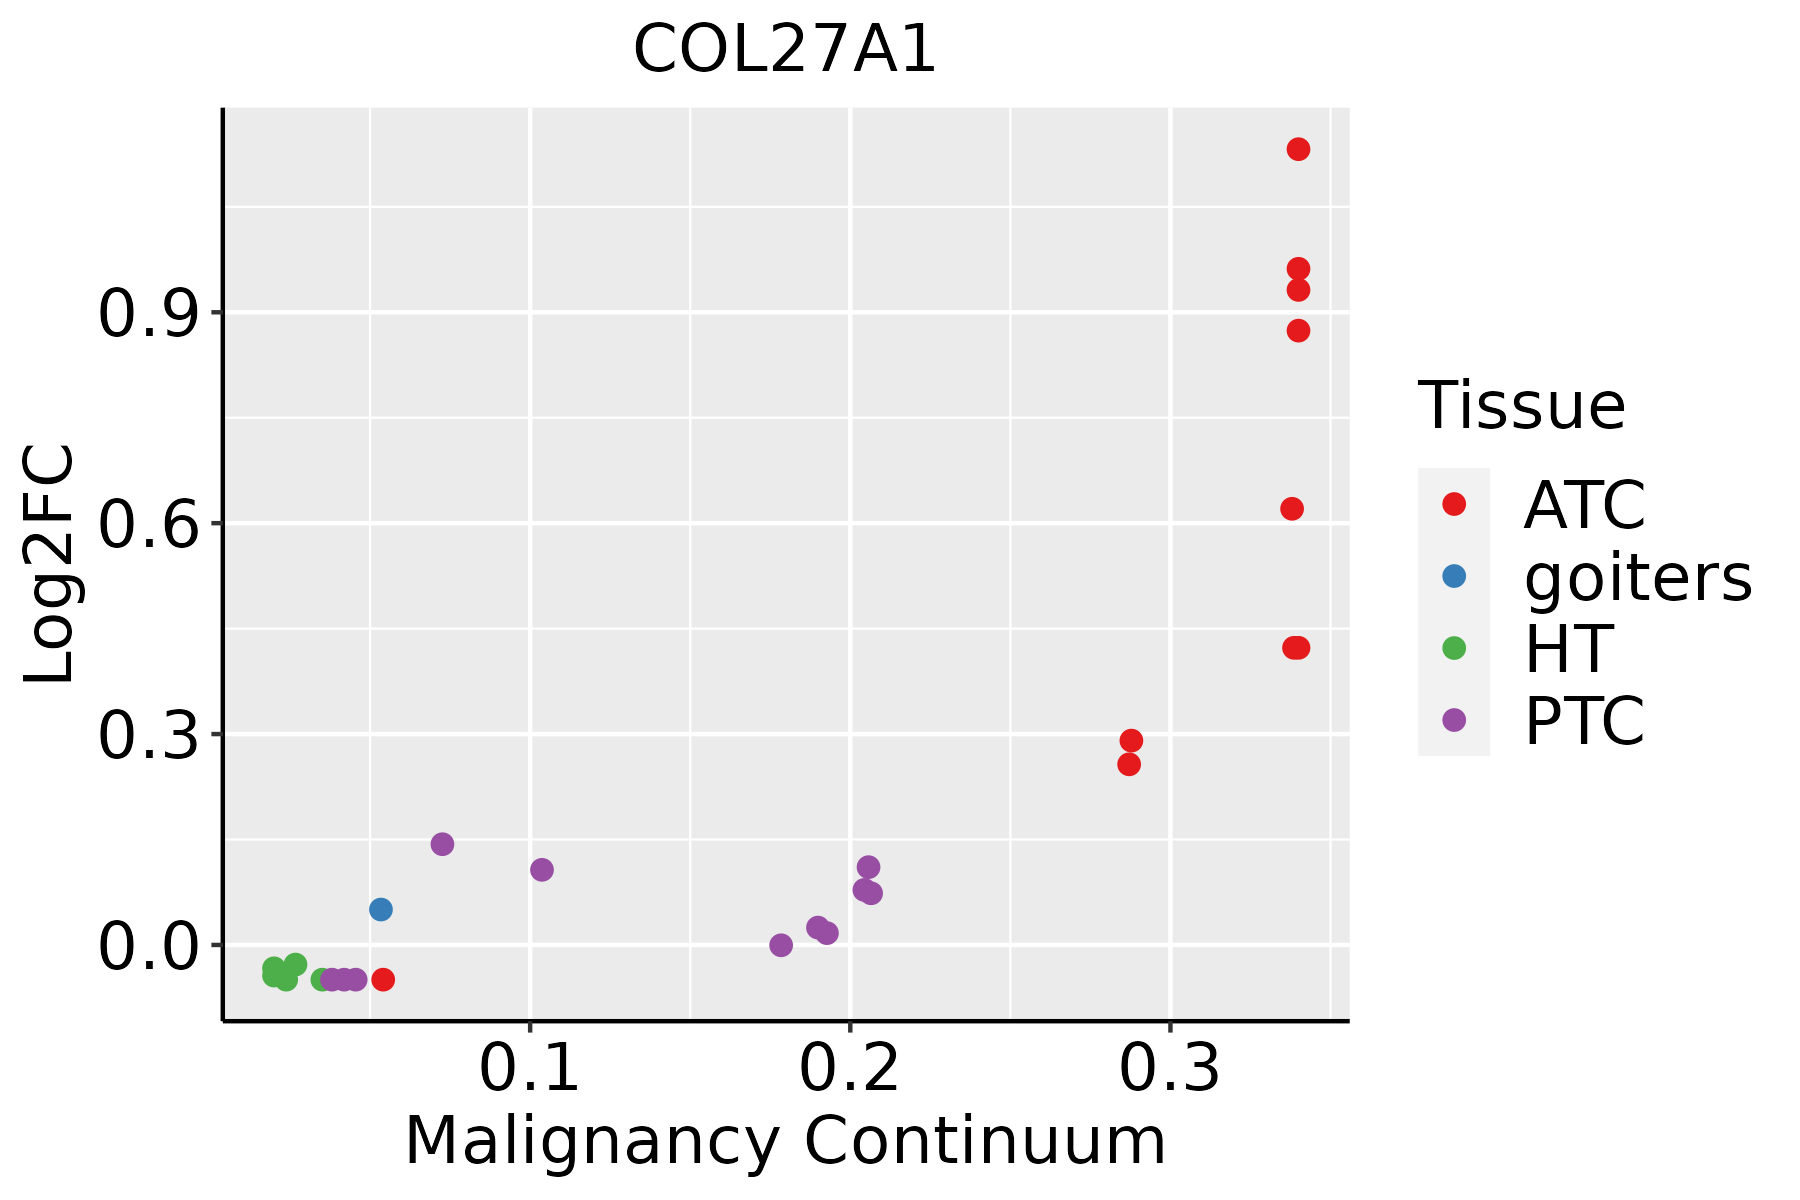 | ATC: Anaplastic thyroid cancer |
| HT: Hashimoto's thyroiditis | ||
| PTC: Papillary thyroid cancer |
| ∗log2FC in expression of this searched gene in stem-like cells from each diseased tissue sample relative to stem-like cells in normal samples in each tissue plotted against the malignancy continuum. Samples are colored based on if they are from different disease stage. |
Top |
Malignant transformation related pathway analysis |
| Find out the enriched GO biological processes and KEGG pathways involved in transition from healthy to precancer to cancer |
| Tissue | Disease Stage | Enriched GO biological Processes |
| Colorectum | AD |  |
| Colorectum | SER |  |
| Colorectum | MSS |  |
| Colorectum | MSI-H |  |
| Colorectum | FAP |  |
| ∗Top 15 enriched GO BP terms are showed in the bar plot of each disease state in each tissue. Each row represents a significant GO biological process which is colored according to the -log10(p.adjust). |
| Page: 1 2 3 4 5 6 7 8 9 |
| GO ID | Tissue | Disease Stage | Description | Gene Ratio | Bg Ratio | pvalue | p.adjust | Count |
| GO:0030198 | Cervix | CC | extracellular matrix organization | 52/2311 | 301/18723 | 7.43e-03 | 3.98e-02 | 52 |
| GO:0043062 | Cervix | CC | extracellular structure organization | 52/2311 | 302/18723 | 7.92e-03 | 4.17e-02 | 52 |
| GO:0045229 | Cervix | CC | external encapsulating structure organization | 52/2311 | 304/18723 | 9.00e-03 | 4.57e-02 | 52 |
| GO:0003413 | Colorectum | MSS | chondrocyte differentiation involved in endochondral bone morphogenesis | 8/3467 | 14/18723 | 1.42e-03 | 1.32e-02 | 8 |
| GO:0060348 | Colorectum | CRC | bone development | 37/2078 | 205/18723 | 1.96e-03 | 1.96e-02 | 37 |
| GO:0002062 | Colorectum | CRC | chondrocyte differentiation | 21/2078 | 106/18723 | 5.87e-03 | 4.33e-02 | 21 |
| GO:0048705 | Colorectum | CRC | skeletal system morphogenesis | 37/2078 | 220/18723 | 6.58e-03 | 4.71e-02 | 37 |
| GO:00301984 | Esophagus | ESCC | extracellular matrix organization | 171/8552 | 301/18723 | 6.08e-05 | 4.67e-04 | 171 |
| GO:00430624 | Esophagus | ESCC | extracellular structure organization | 171/8552 | 302/18723 | 7.73e-05 | 5.76e-04 | 171 |
| GO:00452294 | Esophagus | ESCC | external encapsulating structure organization | 172/8552 | 304/18723 | 7.80e-05 | 5.80e-04 | 172 |
| GO:00603485 | Esophagus | ESCC | bone development | 115/8552 | 205/18723 | 1.67e-03 | 7.72e-03 | 115 |
| GO:0003416 | Esophagus | ESCC | endochondral bone growth | 19/8552 | 26/18723 | 4.31e-03 | 1.71e-02 | 19 |
| GO:00487052 | Esophagus | ESCC | skeletal system morphogenesis | 120/8552 | 220/18723 | 4.90e-03 | 1.89e-02 | 120 |
| GO:00512161 | Esophagus | ESCC | cartilage development | 103/8552 | 190/18723 | 1.08e-02 | 3.67e-02 | 103 |
| GO:00020623 | Esophagus | ESCC | chondrocyte differentiation | 60/8552 | 106/18723 | 1.53e-02 | 4.94e-02 | 60 |
| GO:00603481 | Liver | NAFLD | bone development | 33/1882 | 205/18723 | 4.45e-03 | 3.60e-02 | 33 |
| GO:00301983 | Oral cavity | OSCC | extracellular matrix organization | 146/7305 | 301/18723 | 4.67e-04 | 2.77e-03 | 146 |
| GO:00452293 | Oral cavity | OSCC | external encapsulating structure organization | 147/7305 | 304/18723 | 5.30e-04 | 3.08e-03 | 147 |
| GO:00430623 | Oral cavity | OSCC | extracellular structure organization | 146/7305 | 302/18723 | 5.59e-04 | 3.23e-03 | 146 |
| GO:00603484 | Oral cavity | OSCC | bone development | 99/7305 | 205/18723 | 4.13e-03 | 1.68e-02 | 99 |
| Page: 1 2 |
| Pathway ID | Tissue | Disease Stage | Description | Gene Ratio | Bg Ratio | pvalue | p.adjust | qvalue | Count |
| Page: 1 |
Top |
Cell-cell communication analysis |
| Identification of potential cell-cell interactions between two cell types and their ligand-receptor pairs for different disease states |
| Ligand | Receptor | LRpair | Pathway | Tissue | Disease Stage |
| Page: 1 |
Top |
Single-cell gene regulatory network inference analysis |
| Find out the significant the regulons (TFs) and the target genes of each regulon across cell types for different disease states |
| TF | Cell Type | Tissue | Disease Stage | Target Gene | RSS | Regulon Activity |
| ∗The dot plots of a searched regulon are shown for all cell subpopulations in each disease state of each tissue based on the regulon specific score inferred using pySCENIC and by calculating the average expression. |
| Page: 1 |
Top |
Somatic mutation of malignant transformation related genes |
| Annotation of somatic variants for genes involved in malignant transformation |
| Hugo Symbol | Variant Class | Variant Classification | dbSNP RS | HGVSc | HGVSp | HGVSp Short | SWISSPROT | BIOTYPE | SIFT | PolyPhen | Tumor Sample Barcode | Tissue | Histology | Sex | Age | Stage | Therapy Types | Drugs | Outcome |
| COL27A1 | SNV | Missense_Mutation | c.1946N>A | p.Gly649Asp | p.G649D | Q8IZC6 | protein_coding | probably_damaging(1) | TCGA-A2-A0CQ-01 | Breast | breast invasive carcinoma | Female | <65 | I/II | Chemotherapy | adriamycin | SD | ||
| COL27A1 | SNV | Missense_Mutation | c.2851N>T | p.Met951Leu | p.M951L | Q8IZC6 | protein_coding | benign(0.007) | TCGA-A2-A0EM-01 | Breast | breast invasive carcinoma | Female | >=65 | I/II | Hormone Therapy | tamoxiphen | SD | ||
| COL27A1 | SNV | Missense_Mutation | c.637C>G | p.Leu213Val | p.L213V | Q8IZC6 | protein_coding | benign(0.007) | TCGA-A8-A082-01 | Breast | breast invasive carcinoma | Female | <65 | I/II | Chemotherapy | 5-fluorouracil | CR | ||
| COL27A1 | SNV | Missense_Mutation | c.3134N>T | p.Gly1045Val | p.G1045V | Q8IZC6 | protein_coding | probably_damaging(0.998) | TCGA-A8-A09G-01 | Breast | breast invasive carcinoma | Female | >=65 | III/IV | Unknown | Unknown | SD | ||
| COL27A1 | SNV | Missense_Mutation | c.2512G>A | p.Gly838Ser | p.G838S | Q8IZC6 | protein_coding | probably_damaging(0.999) | TCGA-A8-A09Z-01 | Breast | breast invasive carcinoma | Female | >=65 | I/II | Unknown | Unknown | SD | ||
| COL27A1 | SNV | Missense_Mutation | c.2315N>C | p.Gly772Ala | p.G772A | Q8IZC6 | protein_coding | probably_damaging(0.996) | TCGA-AC-A23H-01 | Breast | breast invasive carcinoma | Female | >=65 | I/II | Unknown | Unknown | PD | ||
| COL27A1 | SNV | Missense_Mutation | rs760156443 | c.1960C>T | p.Arg654Trp | p.R654W | Q8IZC6 | protein_coding | probably_damaging(0.995) | TCGA-AN-A0AK-01 | Breast | breast invasive carcinoma | Female | >=65 | I/II | Unknown | Unknown | SD | |
| COL27A1 | SNV | Missense_Mutation | rs746545338 | c.5324A>G | p.Glu1775Gly | p.E1775G | Q8IZC6 | protein_coding | benign(0.233) | TCGA-BH-A0BS-01 | Breast | breast invasive carcinoma | Female | <65 | III/IV | Chemotherapy | adriamycin | CR | |
| COL27A1 | SNV | Missense_Mutation | c.3298N>T | p.Val1100Leu | p.V1100L | Q8IZC6 | protein_coding | benign(0.026) | TCGA-BH-A0WA-01 | Breast | breast invasive carcinoma | Female | >=65 | I/II | Unknown | Unknown | SD | ||
| COL27A1 | SNV | Missense_Mutation | c.3299N>G | p.Val1100Gly | p.V1100G | Q8IZC6 | protein_coding | benign(0.042) | TCGA-BH-A0WA-01 | Breast | breast invasive carcinoma | Female | >=65 | I/II | Unknown | Unknown | SD |
| Page: 1 2 3 4 5 6 7 8 9 10 11 12 13 14 15 16 17 18 19 20 21 |
Top |
Related drugs of malignant transformation related genes |
| Identification of chemicals and drugs interact with genes involved in malignant transfromation |
| (DGIdb 4.0) |
| Entrez ID | Symbol | Category | Interaction Types | Drug Claim Name | Drug Name | PMIDs |
| 85301 | COL27A1 | DRUGGABLE GENOME | CHEMBL2095222 | OCRIPLASMIN | ||
| 85301 | COL27A1 | DRUGGABLE GENOME | CHEMBL2108709 | COLLAGENASE CLOSTRIDIUM HISTOLYTICUM |
| Page: 1 |

Copyright 2023-Present -The University of Texas Health Science Center at Houston |