
|
|||||
|
 | |
| |
| |
| |
| |
| |
|
Gene: COL22A1 |
Gene summary for COL22A1 |
| Gene information | Species | Human | Gene symbol | COL22A1 | Gene ID | 169044 |
| Gene name | collagen type XXII alpha 1 chain | |
| Gene Alias | COL22A1 | |
| Cytomap | 8q24.23-q24.3 | |
| Gene Type | protein-coding | GO ID | GO:0000902 | UniProtAcc | Q8NFW1 |
Top |
Malignant transformation analysis |
| Identification of the aberrant gene expression in precancerous and cancerous lesions by comparing the gene expression of stem-like cells in diseased tissues with normal stem cells |
| Entrez ID | Symbol | Replicates | Species | Organ | Tissue | Adj P-value | Log2FC | Malignancy |
| 169044 | COL22A1 | P2T-E | Human | Esophagus | ESCC | 4.12e-11 | 2.23e-01 | 0.1177 |
| 169044 | COL22A1 | P11T-E | Human | Esophagus | ESCC | 3.75e-08 | 3.76e-01 | 0.1426 |
| 169044 | COL22A1 | P15T-E | Human | Esophagus | ESCC | 8.45e-04 | 1.52e-01 | 0.1149 |
| 169044 | COL22A1 | P16T-E | Human | Esophagus | ESCC | 1.13e-16 | 3.24e-01 | 0.1153 |
| 169044 | COL22A1 | P32T-E | Human | Esophagus | ESCC | 3.75e-03 | 9.93e-02 | 0.1666 |
| 169044 | COL22A1 | P40T-E | Human | Esophagus | ESCC | 2.18e-06 | 2.13e-01 | 0.109 |
| 169044 | COL22A1 | P49T-E | Human | Esophagus | ESCC | 1.65e-10 | 7.21e-01 | 0.1768 |
| 169044 | COL22A1 | P52T-E | Human | Esophagus | ESCC | 3.75e-03 | 1.09e-01 | 0.1555 |
| 169044 | COL22A1 | P56T-E | Human | Esophagus | ESCC | 6.66e-05 | 5.67e-01 | 0.1613 |
| 169044 | COL22A1 | P76T-E | Human | Esophagus | ESCC | 1.62e-13 | 2.46e-01 | 0.1207 |
| 169044 | COL22A1 | P79T-E | Human | Esophagus | ESCC | 1.88e-04 | 1.45e-01 | 0.1154 |
| 169044 | COL22A1 | P82T-E | Human | Esophagus | ESCC | 6.28e-04 | 2.63e-01 | 0.1072 |
| 169044 | COL22A1 | P91T-E | Human | Esophagus | ESCC | 8.74e-05 | 5.15e-01 | 0.1828 |
| 169044 | COL22A1 | C38 | Human | Oral cavity | OSCC | 3.99e-12 | 9.21e-01 | 0.172 |
| 169044 | COL22A1 | C43 | Human | Oral cavity | OSCC | 9.26e-07 | 1.85e-01 | 0.1704 |
| 169044 | COL22A1 | LN38 | Human | Oral cavity | OSCC | 2.90e-03 | 6.76e-01 | 0.168 |
| Page: 1 |
| Tissue | Expression Dynamics | Abbreviation |
| Esophagus | 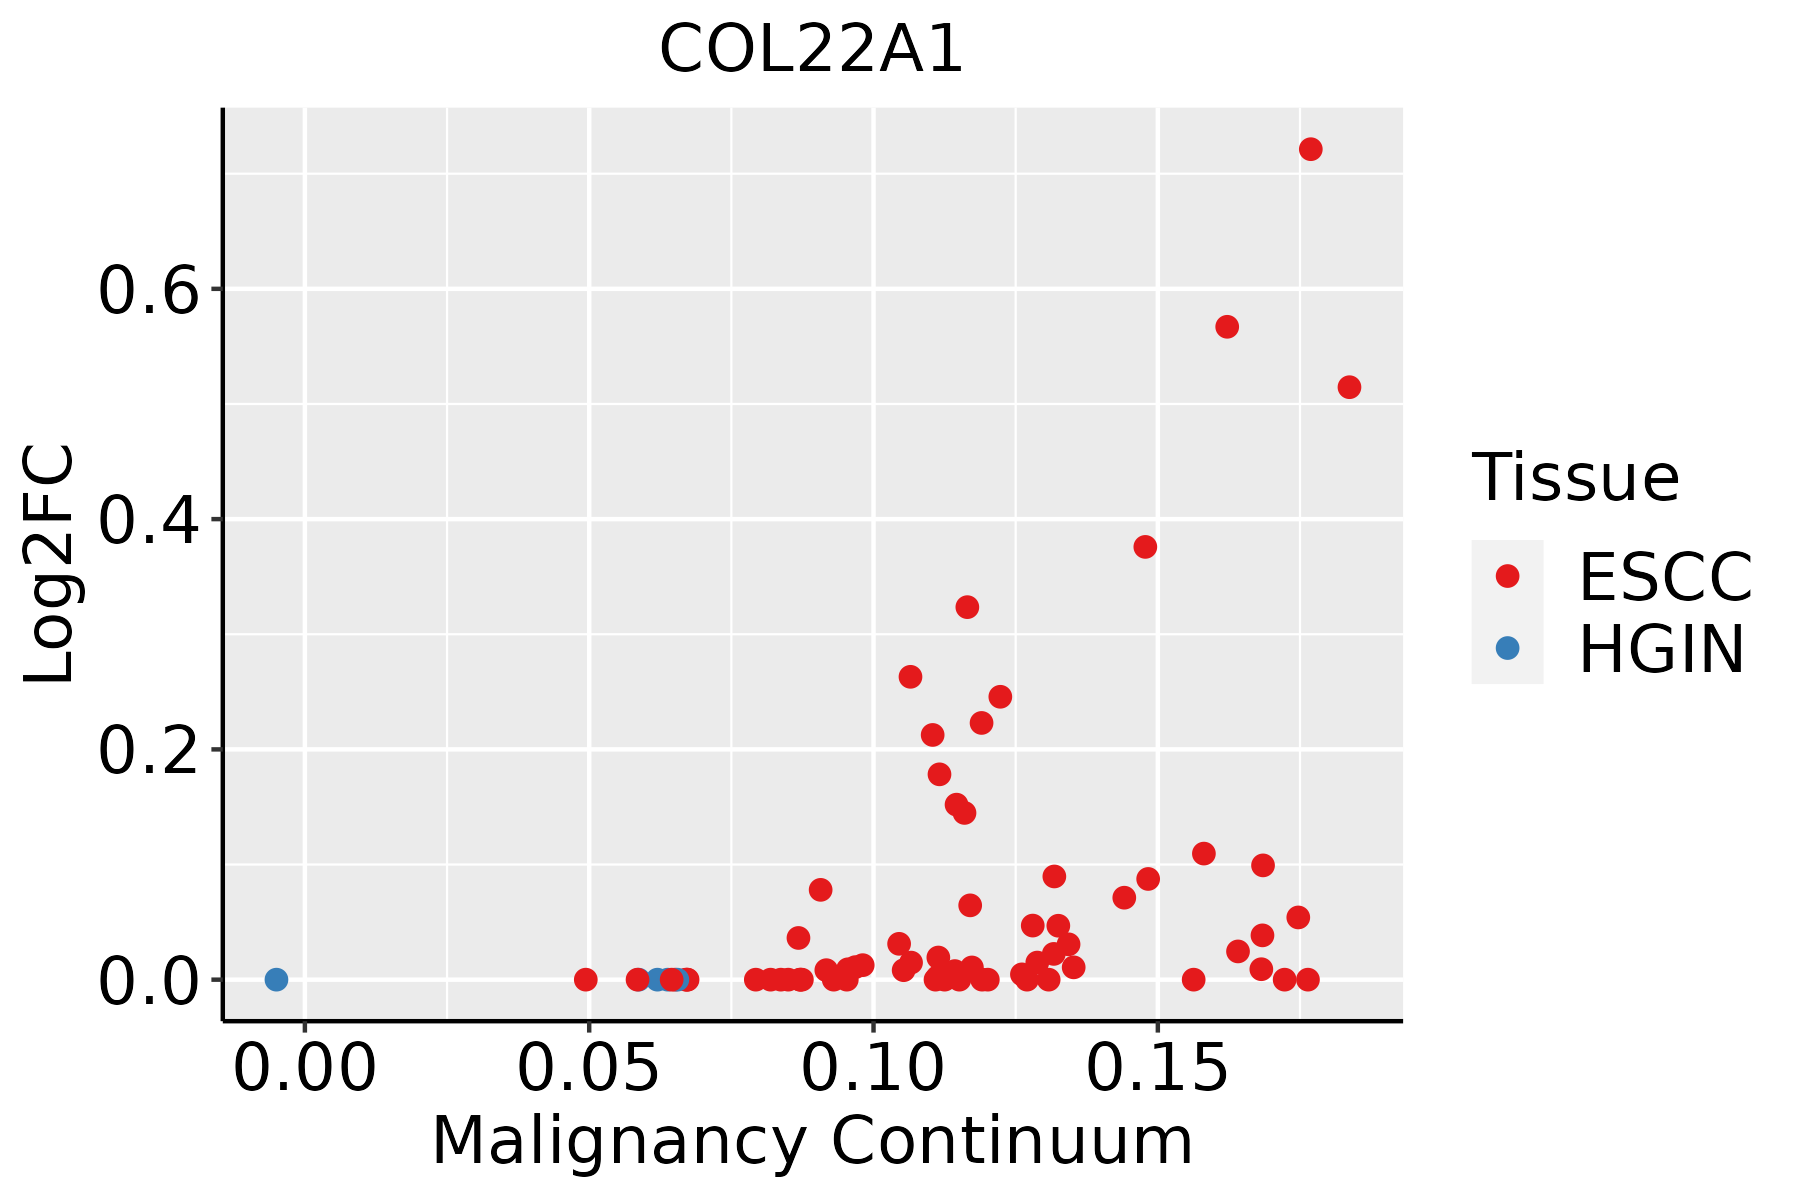 | ESCC: Esophageal squamous cell carcinoma |
| HGIN: High-grade intraepithelial neoplasias | ||
| LGIN: Low-grade intraepithelial neoplasias | ||
| Oral Cavity | 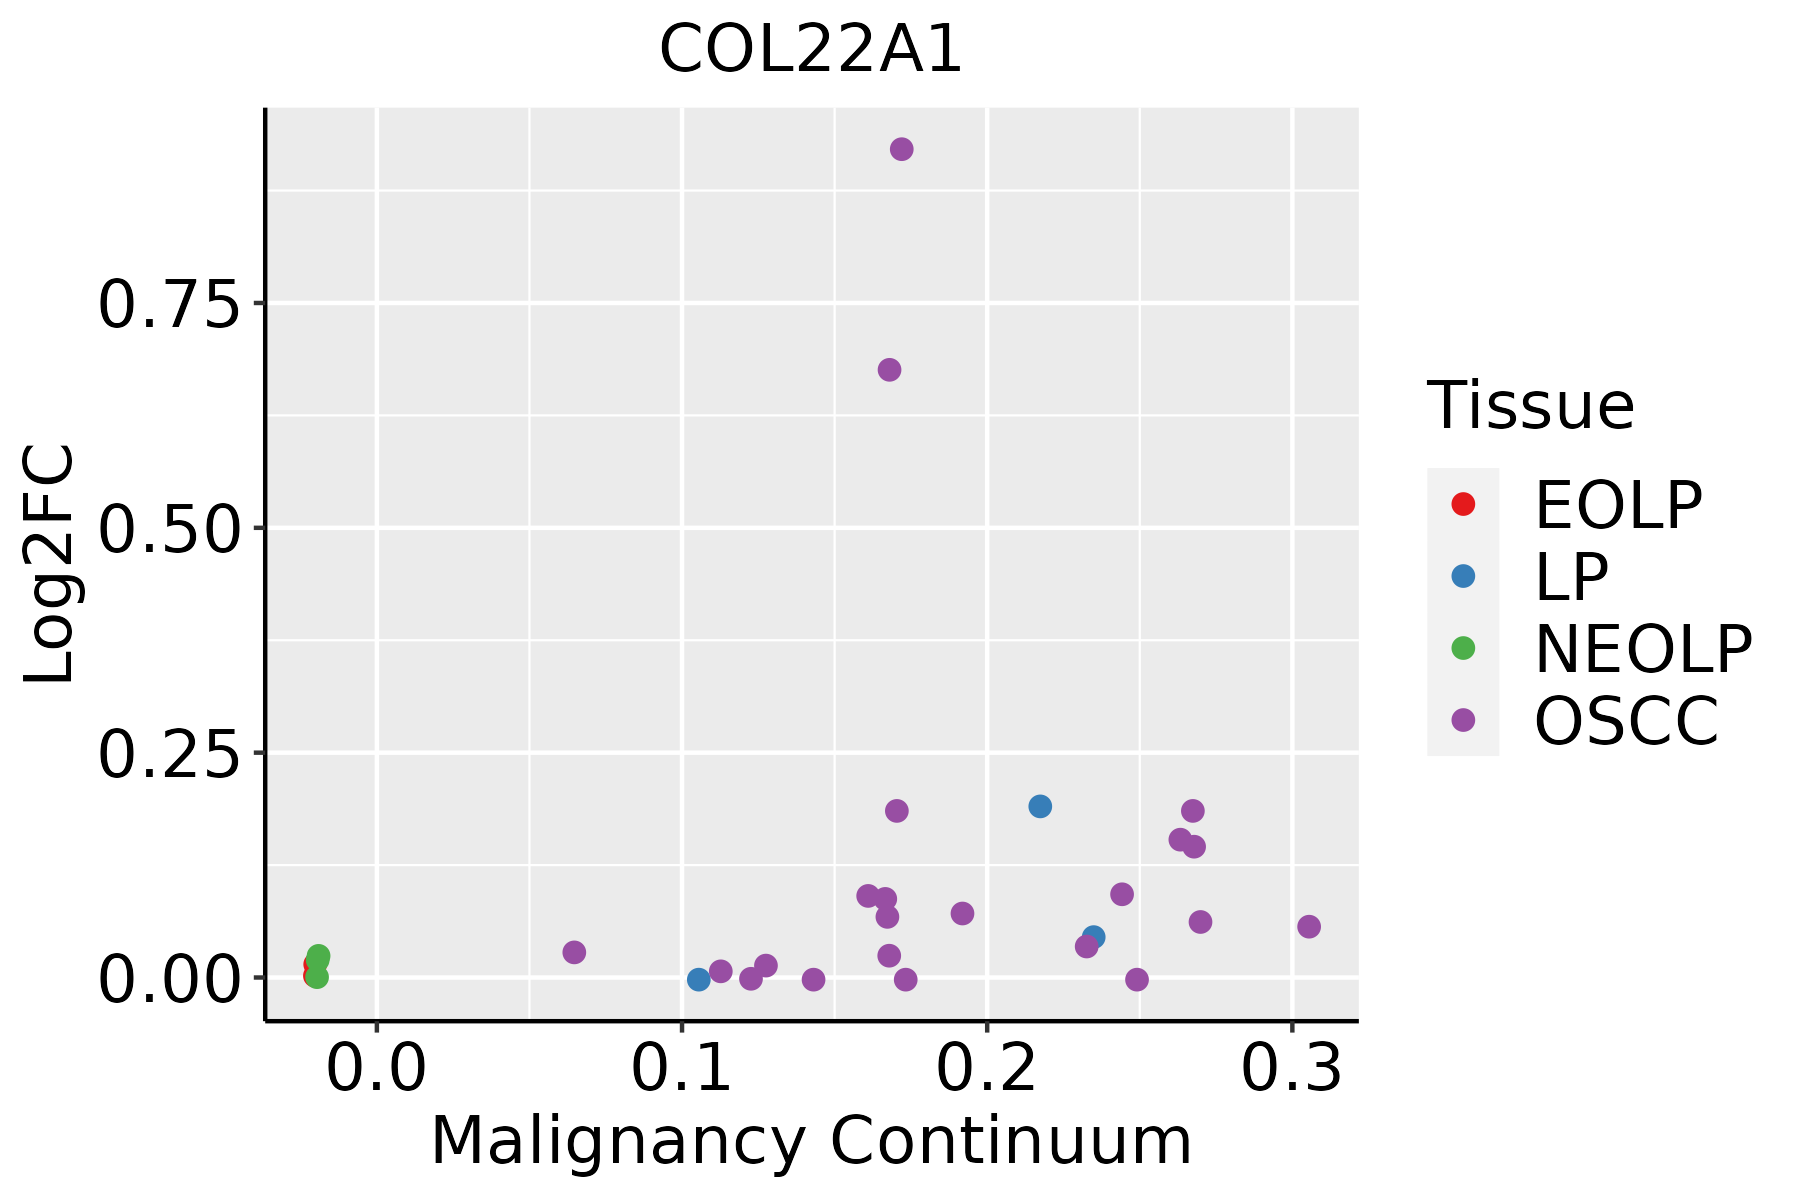 | EOLP: Erosive Oral lichen planus |
| LP: leukoplakia | ||
| NEOLP: Non-erosive oral lichen planus | ||
| OSCC: Oral squamous cell carcinoma |
| ∗log2FC in expression of this searched gene in stem-like cells from each diseased tissue sample relative to stem-like cells in normal samples in each tissue plotted against the malignancy continuum. Samples are colored based on if they are from different disease stage. |
Top |
Malignant transformation related pathway analysis |
| Find out the enriched GO biological processes and KEGG pathways involved in transition from healthy to precancer to cancer |
| Tissue | Disease Stage | Enriched GO biological Processes |
| Colorectum | AD |  |
| Colorectum | SER |  |
| Colorectum | MSS |  |
| Colorectum | MSI-H |  |
| Colorectum | FAP |  |
| ∗Top 15 enriched GO BP terms are showed in the bar plot of each disease state in each tissue. Each row represents a significant GO biological process which is colored according to the -log10(p.adjust). |
| Page: 1 2 3 4 5 6 7 8 9 |
| GO ID | Tissue | Disease Stage | Description | Gene Ratio | Bg Ratio | pvalue | p.adjust | Count |
| GO:000206420 | Esophagus | ESCC | epithelial cell development | 136/8552 | 220/18723 | 9.50e-07 | 1.21e-05 | 136 |
| GO:00301984 | Esophagus | ESCC | extracellular matrix organization | 171/8552 | 301/18723 | 6.08e-05 | 4.67e-04 | 171 |
| GO:00430624 | Esophagus | ESCC | extracellular structure organization | 171/8552 | 302/18723 | 7.73e-05 | 5.76e-04 | 171 |
| GO:00452294 | Esophagus | ESCC | external encapsulating structure organization | 172/8552 | 304/18723 | 7.80e-05 | 5.80e-04 | 172 |
| GO:000188510 | Esophagus | ESCC | endothelial cell development | 44/8552 | 64/18723 | 1.59e-04 | 1.05e-03 | 44 |
| GO:004544610 | Esophagus | ESCC | endothelial cell differentiation | 67/8552 | 118/18723 | 9.86e-03 | 3.40e-02 | 67 |
| GO:000315818 | Esophagus | ESCC | endothelium development | 76/8552 | 136/18723 | 1.05e-02 | 3.59e-02 | 76 |
| GO:00033824 | Esophagus | ESCC | epithelial cell morphogenesis | 22/8552 | 33/18723 | 1.22e-02 | 4.08e-02 | 22 |
| GO:000206419 | Oral cavity | OSCC | epithelial cell development | 116/7305 | 220/18723 | 2.34e-05 | 2.21e-04 | 116 |
| GO:00018859 | Oral cavity | OSCC | endothelial cell development | 40/7305 | 64/18723 | 1.20e-04 | 8.57e-04 | 40 |
| GO:00301983 | Oral cavity | OSCC | extracellular matrix organization | 146/7305 | 301/18723 | 4.67e-04 | 2.77e-03 | 146 |
| GO:00452293 | Oral cavity | OSCC | external encapsulating structure organization | 147/7305 | 304/18723 | 5.30e-04 | 3.08e-03 | 147 |
| GO:00430623 | Oral cavity | OSCC | extracellular structure organization | 146/7305 | 302/18723 | 5.59e-04 | 3.23e-03 | 146 |
| GO:000315816 | Oral cavity | OSCC | endothelium development | 71/7305 | 136/18723 | 1.18e-03 | 5.99e-03 | 71 |
| GO:00454469 | Oral cavity | OSCC | endothelial cell differentiation | 61/7305 | 118/18723 | 3.40e-03 | 1.44e-02 | 61 |
| Page: 1 |
| Pathway ID | Tissue | Disease Stage | Description | Gene Ratio | Bg Ratio | pvalue | p.adjust | qvalue | Count |
| Page: 1 |
Top |
Cell-cell communication analysis |
| Identification of potential cell-cell interactions between two cell types and their ligand-receptor pairs for different disease states |
| Ligand | Receptor | LRpair | Pathway | Tissue | Disease Stage |
| Page: 1 |
Top |
Single-cell gene regulatory network inference analysis |
| Find out the significant the regulons (TFs) and the target genes of each regulon across cell types for different disease states |
| TF | Cell Type | Tissue | Disease Stage | Target Gene | RSS | Regulon Activity |
| ∗The dot plots of a searched regulon are shown for all cell subpopulations in each disease state of each tissue based on the regulon specific score inferred using pySCENIC and by calculating the average expression. |
| Page: 1 |
Top |
Somatic mutation of malignant transformation related genes |
| Annotation of somatic variants for genes involved in malignant transformation |
| Hugo Symbol | Variant Class | Variant Classification | dbSNP RS | HGVSc | HGVSp | HGVSp Short | SWISSPROT | BIOTYPE | SIFT | PolyPhen | Tumor Sample Barcode | Tissue | Histology | Sex | Age | Stage | Therapy Types | Drugs | Outcome |
| COL22A1 | SNV | Missense_Mutation | novel | c.2564C>T | p.Ser855Phe | p.S855F | Q8NFW1 | protein_coding | deleterious(0.02) | probably_damaging(0.993) | TCGA-A2-A0CR-01 | Breast | breast invasive carcinoma | Female | <65 | I/II | Chemotherapy | adriamycin | CR |
| COL22A1 | SNV | Missense_Mutation | c.4360N>A | p.Leu1454Met | p.L1454M | Q8NFW1 | protein_coding | tolerated(0.15) | possibly_damaging(0.832) | TCGA-A2-A0EO-01 | Breast | breast invasive carcinoma | Female | <65 | I/II | Hormone Therapy | tamoxiphen | SD | |
| COL22A1 | SNV | Missense_Mutation | rs144653941 | c.2387G>A | p.Arg796Gln | p.R796Q | Q8NFW1 | protein_coding | tolerated(0.6) | possibly_damaging(0.48) | TCGA-A8-A06Q-01 | Breast | breast invasive carcinoma | Female | <65 | III/IV | Unknown | Unknown | SD |
| COL22A1 | SNV | Missense_Mutation | novel | c.1870C>A | p.Pro624Thr | p.P624T | Q8NFW1 | protein_coding | tolerated(0.56) | benign(0.006) | TCGA-A8-A085-01 | Breast | breast invasive carcinoma | Male | <65 | I/II | Hormone Therapy | tamoxiphen | SD |
| COL22A1 | SNV | Missense_Mutation | c.2920G>A | p.Ala974Thr | p.A974T | Q8NFW1 | protein_coding | tolerated(0.39) | benign(0.042) | TCGA-AQ-A04H-01 | Breast | breast invasive carcinoma | Female | <65 | III/IV | Chemotherapy | taxotere | SD | |
| COL22A1 | SNV | Missense_Mutation | c.409N>A | p.Pro137Thr | p.P137T | Q8NFW1 | protein_coding | tolerated(0.09) | probably_damaging(0.977) | TCGA-AR-A256-01 | Breast | breast invasive carcinoma | Female | <65 | I/II | Chemotherapy | doxorubicin | PD | |
| COL22A1 | SNV | Missense_Mutation | c.4486C>A | p.Gln1496Lys | p.Q1496K | Q8NFW1 | protein_coding | tolerated(0.93) | benign(0.315) | TCGA-B6-A0I6-01 | Breast | breast invasive carcinoma | Female | <65 | I/II | Unknown | Unknown | PD | |
| COL22A1 | SNV | Missense_Mutation | rs757031031 | c.4466N>T | p.Pro1489Leu | p.P1489L | Q8NFW1 | protein_coding | deleterious(0.01) | possibly_damaging(0.455) | TCGA-BH-A0DZ-01 | Breast | breast invasive carcinoma | Female | <65 | I/II | Chemotherapy | docetaxel | SD |
| COL22A1 | SNV | Missense_Mutation | rs755559463 | c.500N>A | p.Arg167His | p.R167H | Q8NFW1 | protein_coding | tolerated(0.07) | possibly_damaging(0.471) | TCGA-BH-A0E7-01 | Breast | breast invasive carcinoma | Female | >=65 | I/II | Hormone Therapy | arimidex | SD |
| COL22A1 | SNV | Missense_Mutation | c.3457N>T | p.Gly1153Trp | p.G1153W | Q8NFW1 | protein_coding | deleterious(0) | probably_damaging(1) | TCGA-BH-A0EE-01 | Breast | breast invasive carcinoma | Female | >=65 | I/II | Chemotherapy | docetaxel | SD |
| Page: 1 2 3 4 5 6 7 8 9 10 11 12 13 14 15 16 17 18 19 20 21 22 23 24 25 26 27 28 29 30 31 32 33 34 35 36 37 38 |
Top |
Related drugs of malignant transformation related genes |
| Identification of chemicals and drugs interact with genes involved in malignant transfromation |
| (DGIdb 4.0) |
| Entrez ID | Symbol | Category | Interaction Types | Drug Claim Name | Drug Name | PMIDs |
| 169044 | COL22A1 | DRUGGABLE GENOME | salbutamol | ALBUTEROL |
| Page: 1 |

Copyright 2023-Present -The University of Texas Health Science Center at Houston |