
|
|||||
|
 | |
| |
| |
| |
| |
| |
|
Gene: COL1A2 |
Gene summary for COL1A2 |
| Gene information | Species | Human | Gene symbol | COL1A2 | Gene ID | 1278 |
| Gene name | collagen type I alpha 2 chain | |
| Gene Alias | EDSARTH2 | |
| Cytomap | 7q21.3 | |
| Gene Type | protein-coding | GO ID | GO:0001101 | UniProtAcc | A0A0S2Z3H5 |
Top |
Malignant transformation analysis |
| Identification of the aberrant gene expression in precancerous and cancerous lesions by comparing the gene expression of stem-like cells in diseased tissues with normal stem cells |
| Entrez ID | Symbol | Replicates | Species | Organ | Tissue | Adj P-value | Log2FC | Malignancy |
| 1278 | COL1A2 | CA_HPV_1 | Human | Cervix | CC | 2.45e-03 | -1.54e-01 | 0.0264 |
| 1278 | COL1A2 | Tumor | Human | Cervix | CC | 1.88e-05 | -1.76e-01 | 0.1241 |
| 1278 | COL1A2 | sample3 | Human | Cervix | CC | 4.00e-05 | -1.76e-01 | 0.1387 |
| 1278 | COL1A2 | H2 | Human | Cervix | HSIL_HPV | 1.12e-23 | 7.78e-01 | 0.0632 |
| 1278 | COL1A2 | T3 | Human | Cervix | CC | 8.81e-06 | -1.76e-01 | 0.1389 |
| 1278 | COL1A2 | AEH-subject1 | Human | Endometrium | AEH | 1.67e-51 | -1.14e+00 | -0.3059 |
| 1278 | COL1A2 | AEH-subject2 | Human | Endometrium | AEH | 2.75e-48 | -1.17e+00 | -0.2525 |
| 1278 | COL1A2 | AEH-subject3 | Human | Endometrium | AEH | 5.36e-31 | -8.72e-01 | -0.2576 |
| 1278 | COL1A2 | AEH-subject4 | Human | Endometrium | AEH | 3.16e-02 | -3.92e-01 | -0.2657 |
| 1278 | COL1A2 | AEH-subject5 | Human | Endometrium | AEH | 2.00e-21 | -7.11e-01 | -0.2953 |
| 1278 | COL1A2 | EEC-subject1 | Human | Endometrium | EEC | 2.56e-50 | -1.19e+00 | -0.2682 |
| 1278 | COL1A2 | EEC-subject2 | Human | Endometrium | EEC | 3.52e-67 | -1.25e+00 | -0.2607 |
| 1278 | COL1A2 | EEC-subject3 | Human | Endometrium | EEC | 1.05e-54 | -1.12e+00 | -0.2525 |
| 1278 | COL1A2 | EEC-subject4 | Human | Endometrium | EEC | 5.05e-52 | -1.13e+00 | -0.2571 |
| 1278 | COL1A2 | EEC-subject5 | Human | Endometrium | EEC | 6.39e-60 | -1.19e+00 | -0.249 |
| 1278 | COL1A2 | GSM5276934 | Human | Endometrium | EEC | 6.31e-42 | -1.02e+00 | -0.0913 |
| 1278 | COL1A2 | GSM5276935 | Human | Endometrium | EEC | 3.06e-28 | -7.89e-01 | -0.123 |
| 1278 | COL1A2 | GSM5276937 | Human | Endometrium | EEC | 1.68e-17 | -6.69e-01 | -0.0897 |
| 1278 | COL1A2 | GSM6177620_NYU_UCEC1_lib1_lib1 | Human | Endometrium | EEC | 1.20e-44 | -1.18e+00 | -0.1869 |
| 1278 | COL1A2 | GSM6177620_NYU_UCEC1_lib2_lib2 | Human | Endometrium | EEC | 3.94e-47 | -1.28e+00 | -0.1875 |
| Page: 1 2 3 4 5 6 |
| Tissue | Expression Dynamics | Abbreviation |
| Cervix |  | CC: Cervix cancer |
| HSIL_HPV: HPV-infected high-grade squamous intraepithelial lesions | ||
| N_HPV: HPV-infected normal cervix | ||
| Endometrium | 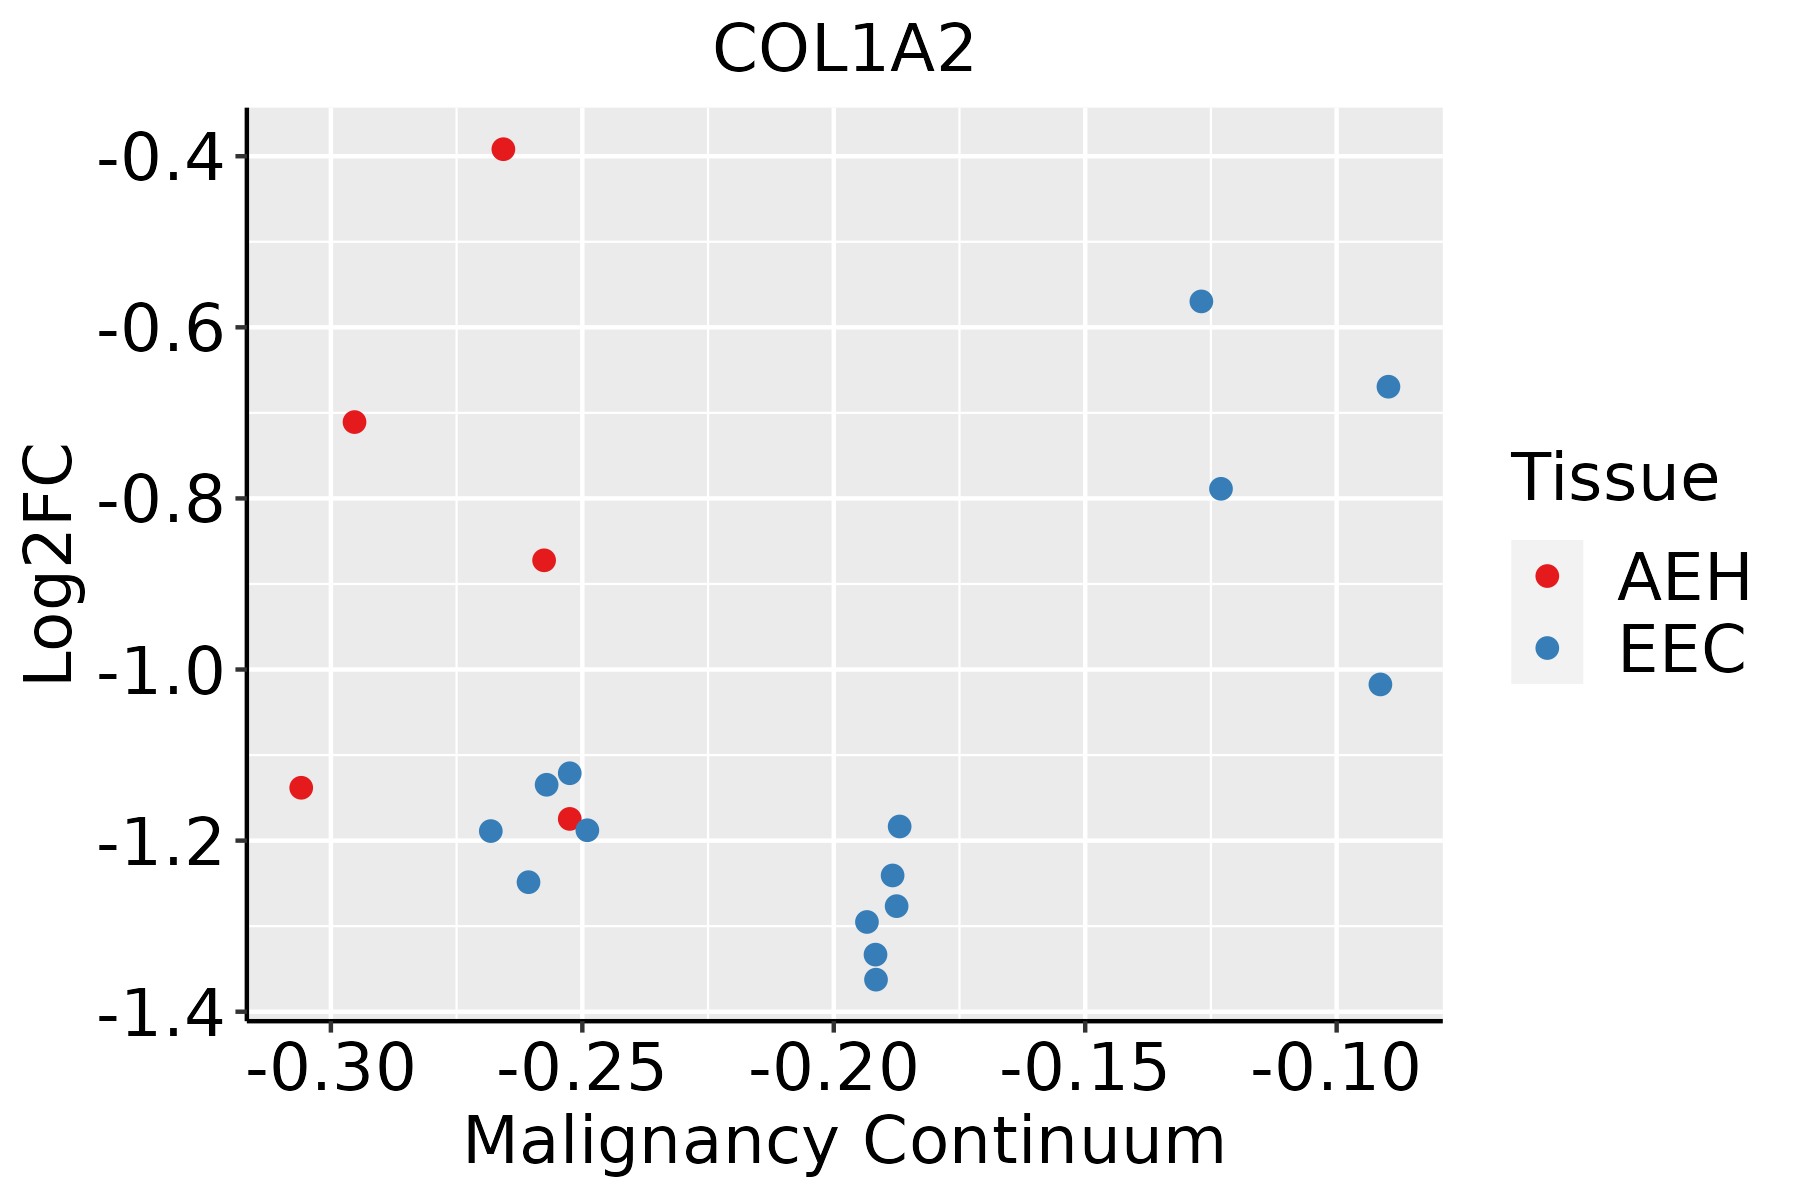 | AEH: Atypical endometrial hyperplasia |
| EEC: Endometrioid Cancer | ||
| Esophagus | 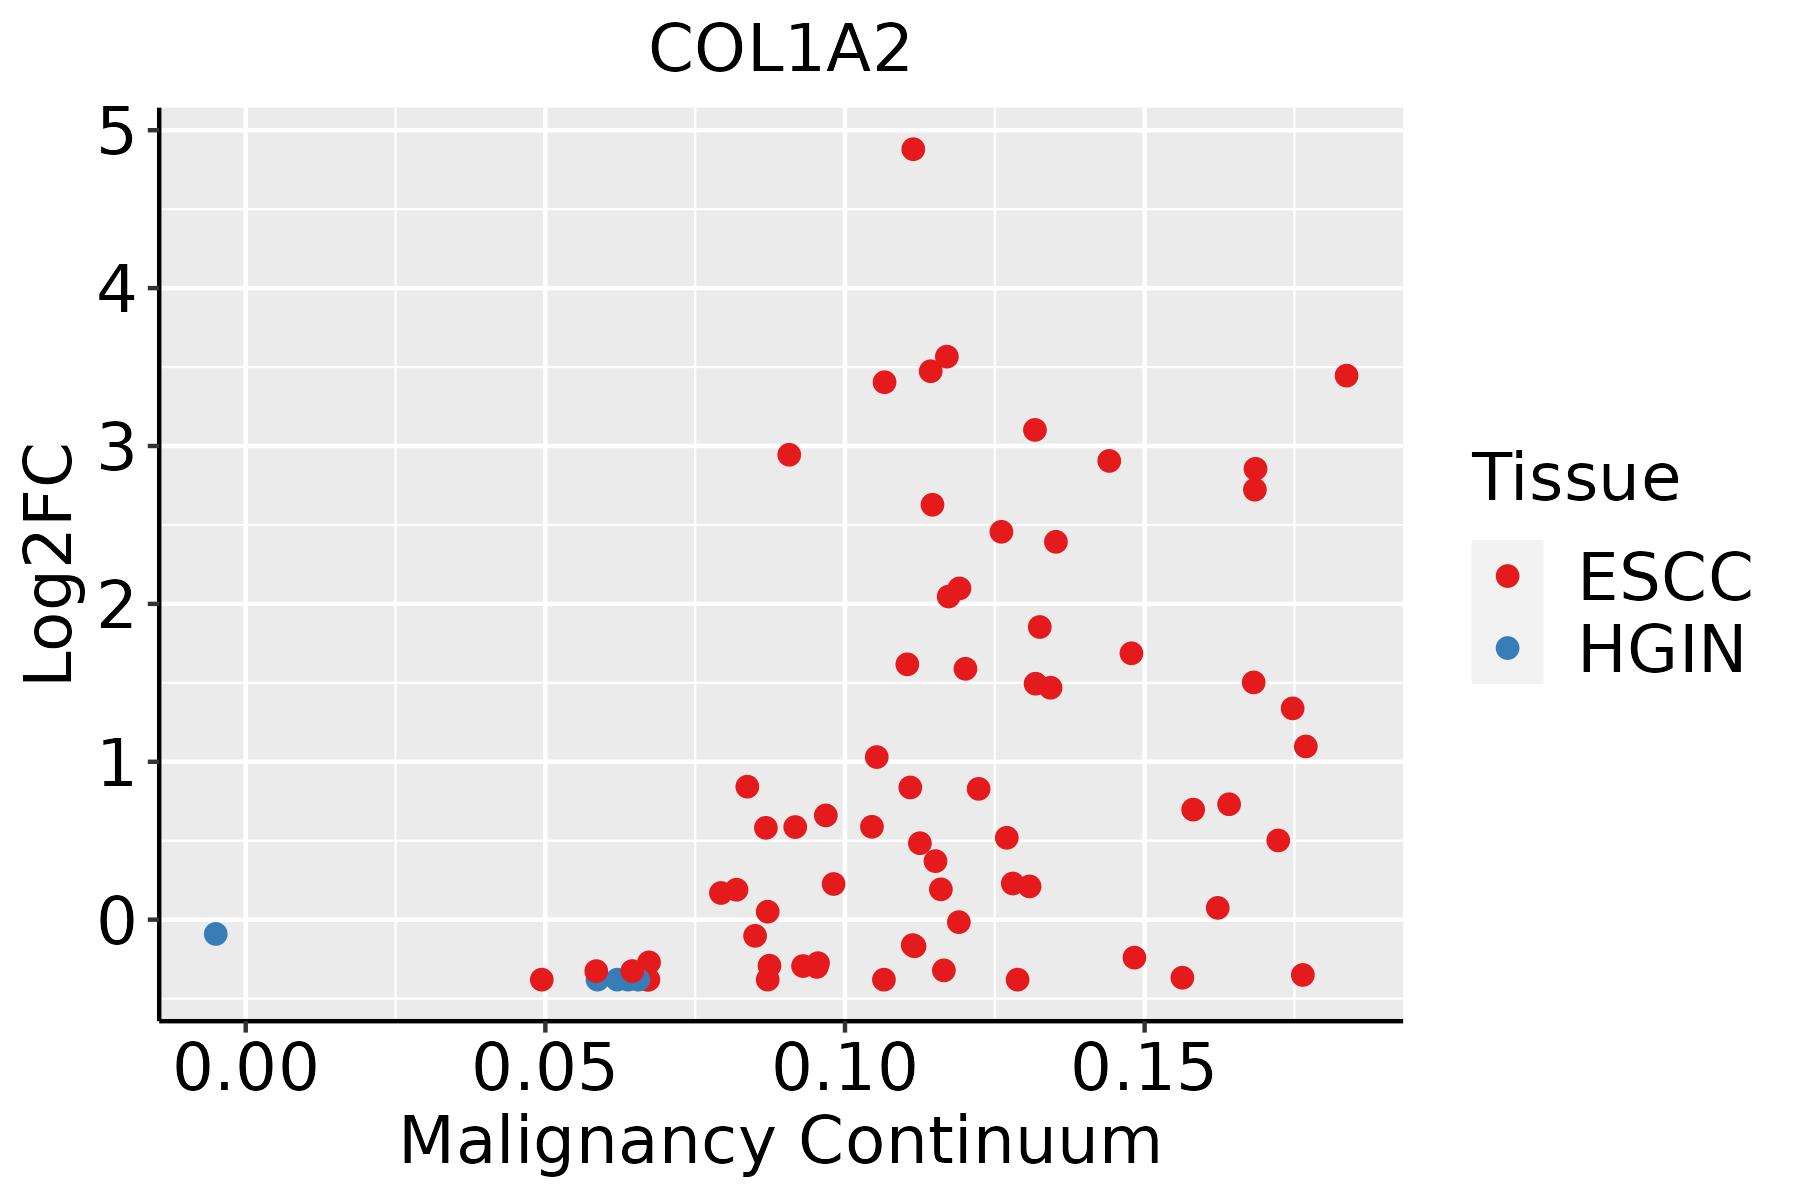 | ESCC: Esophageal squamous cell carcinoma |
| HGIN: High-grade intraepithelial neoplasias | ||
| LGIN: Low-grade intraepithelial neoplasias | ||
| Liver |  | HCC: Hepatocellular carcinoma |
| NAFLD: Non-alcoholic fatty liver disease | ||
| Lung | 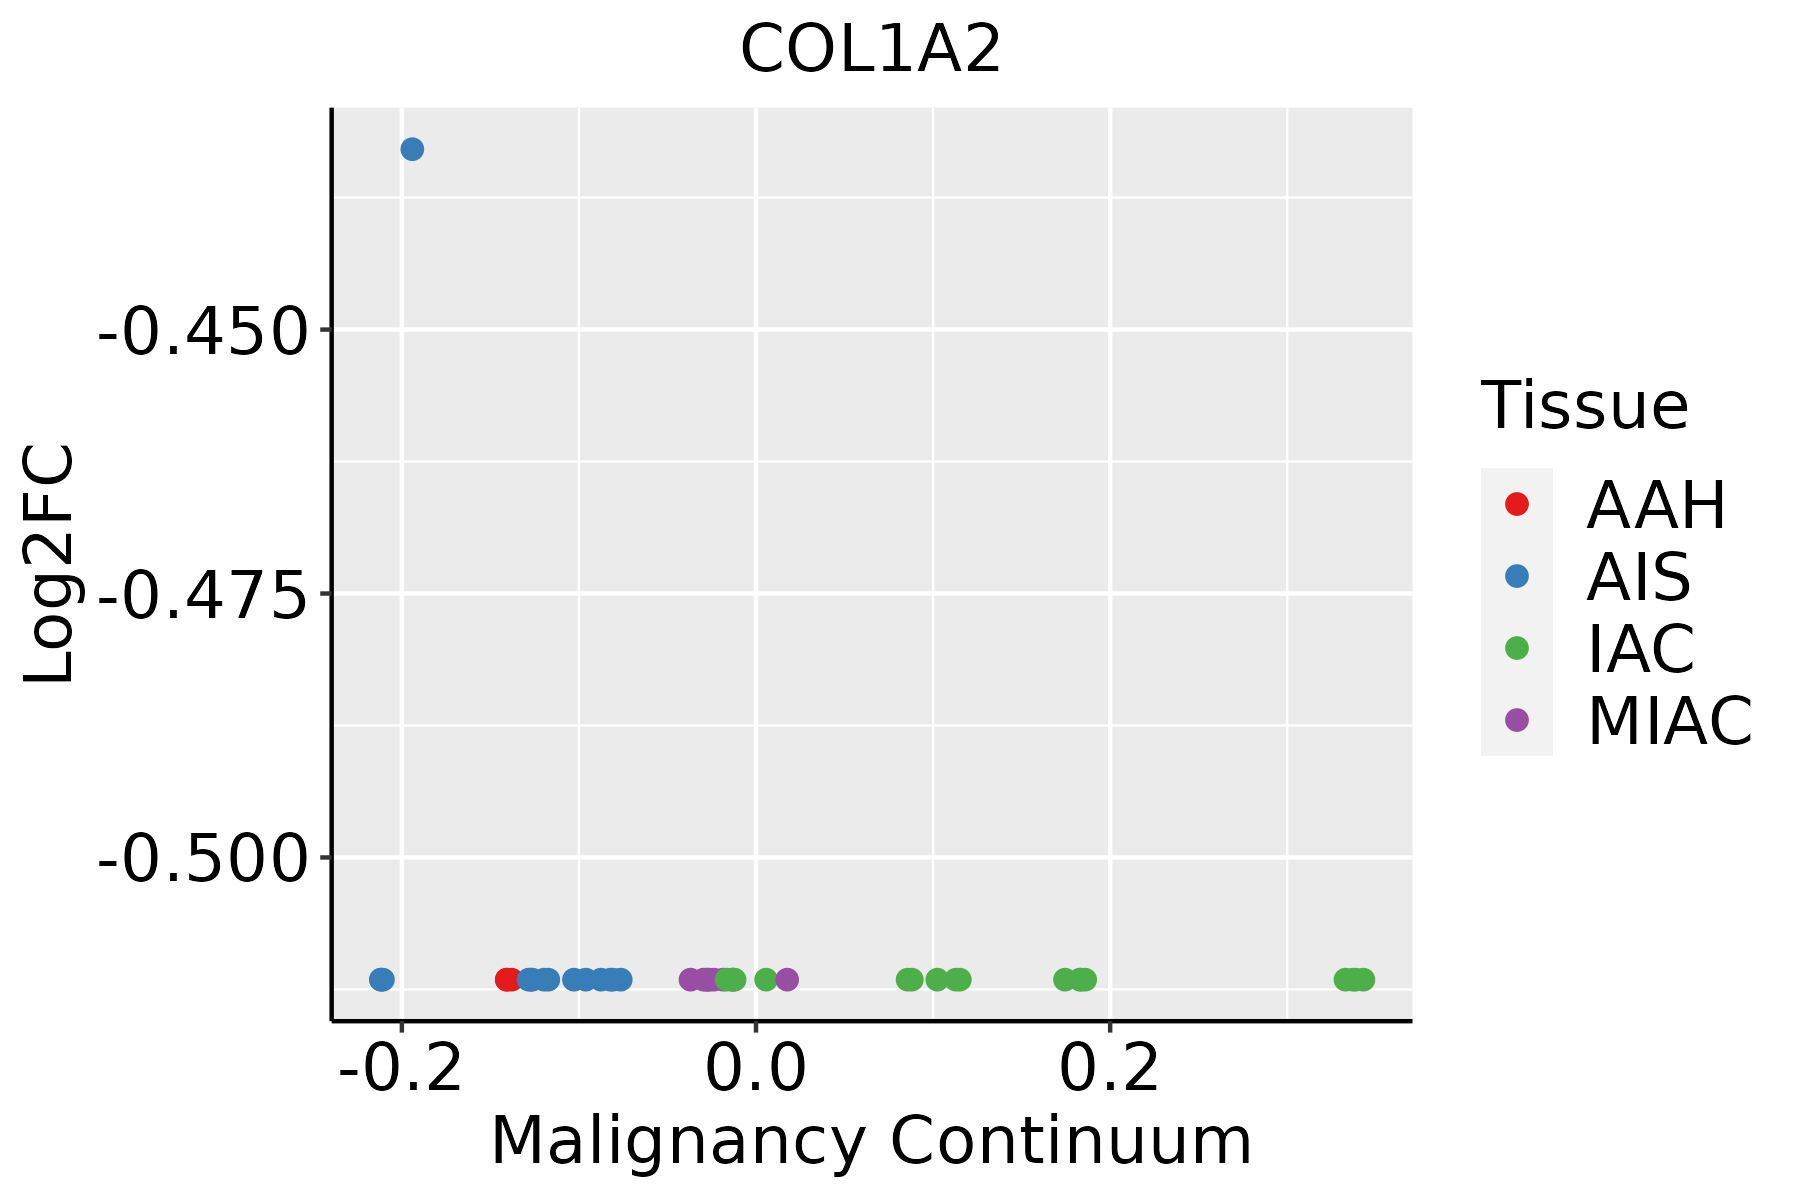 | AAH: Atypical adenomatous hyperplasia |
| AIS: Adenocarcinoma in situ | ||
| IAC: Invasive lung adenocarcinoma | ||
| MIA: Minimally invasive adenocarcinoma | ||
| Oral Cavity |  | EOLP: Erosive Oral lichen planus |
| LP: leukoplakia | ||
| NEOLP: Non-erosive oral lichen planus | ||
| OSCC: Oral squamous cell carcinoma | ||
| Skin |  | AK: Actinic keratosis |
| cSCC: Cutaneous squamous cell carcinoma | ||
| SCCIS:squamous cell carcinoma in situ | ||
| Thyroid | 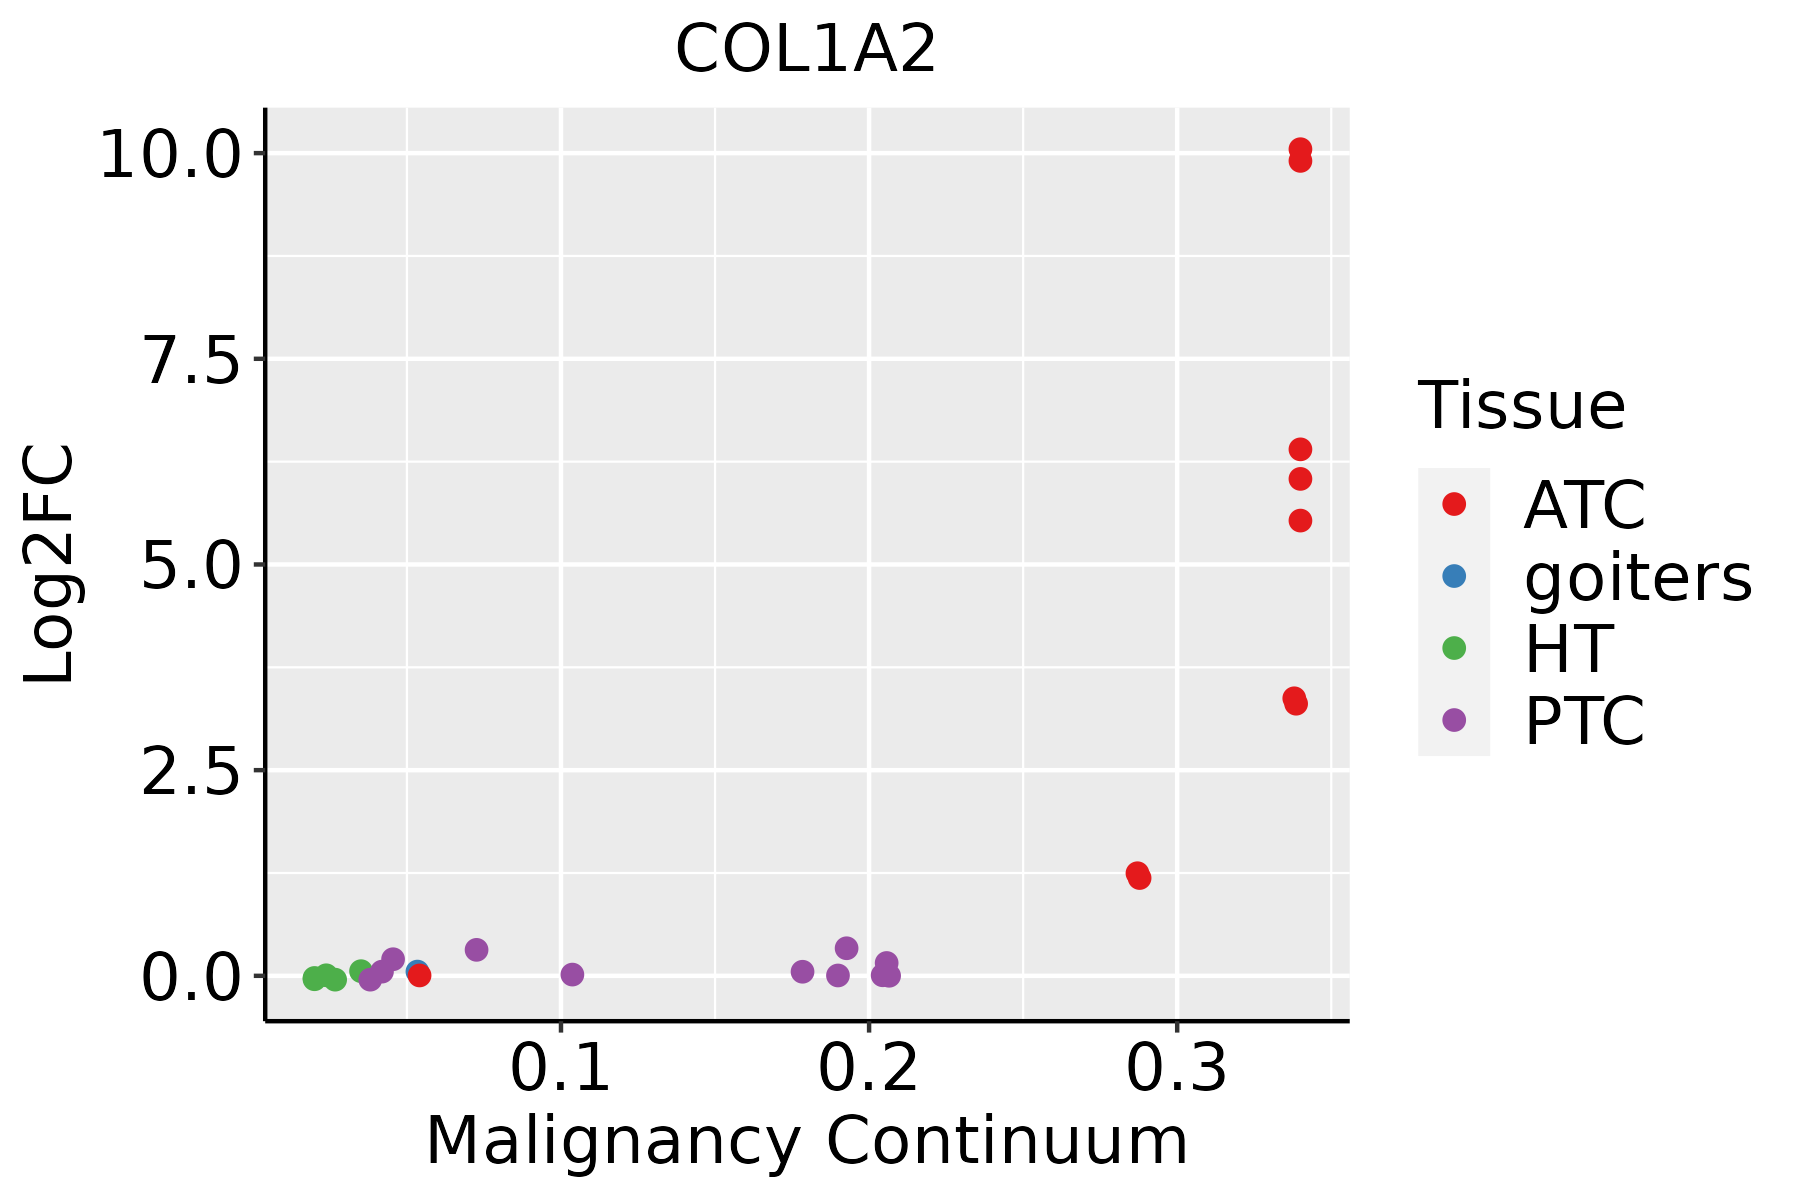 | ATC: Anaplastic thyroid cancer |
| HT: Hashimoto's thyroiditis | ||
| PTC: Papillary thyroid cancer |
| ∗log2FC in expression of this searched gene in stem-like cells from each diseased tissue sample relative to stem-like cells in normal samples in each tissue plotted against the malignancy continuum. Samples are colored based on if they are from different disease stage. |
Top |
Malignant transformation related pathway analysis |
| Find out the enriched GO biological processes and KEGG pathways involved in transition from healthy to precancer to cancer |
| Tissue | Disease Stage | Enriched GO biological Processes |
| Colorectum | AD |  |
| Colorectum | SER |  |
| Colorectum | MSS |  |
| Colorectum | MSI-H |  |
| Colorectum | FAP |  |
| ∗Top 15 enriched GO BP terms are showed in the bar plot of each disease state in each tissue. Each row represents a significant GO biological process which is colored according to the -log10(p.adjust). |
| Page: 1 2 3 4 5 6 7 8 9 |
| GO ID | Tissue | Disease Stage | Description | Gene Ratio | Bg Ratio | pvalue | p.adjust | Count |
| GO:00435884 | Cervix | CC | skin development | 71/2311 | 263/18723 | 8.04e-11 | 1.46e-08 | 71 |
| GO:00072656 | Cervix | CC | Ras protein signal transduction | 79/2311 | 337/18723 | 9.49e-09 | 7.77e-07 | 79 |
| GO:00435893 | Cervix | CC | skin morphogenesis | 8/2311 | 11/18723 | 6.22e-06 | 1.51e-04 | 8 |
| GO:00072666 | Cervix | CC | Rho protein signal transduction | 35/2311 | 137/18723 | 1.77e-05 | 3.33e-04 | 35 |
| GO:00071786 | Cervix | CC | transmembrane receptor protein serine/threonine kinase signaling pathway | 67/2311 | 355/18723 | 2.39e-04 | 2.67e-03 | 67 |
| GO:00011016 | Cervix | CC | response to acid chemical | 31/2311 | 135/18723 | 4.16e-04 | 4.22e-03 | 31 |
| GO:00715595 | Cervix | CC | response to transforming growth factor beta | 50/2311 | 256/18723 | 6.31e-04 | 5.91e-03 | 50 |
| GO:00715605 | Cervix | CC | cellular response to transforming growth factor beta stimulus | 49/2311 | 250/18723 | 6.55e-04 | 6.05e-03 | 49 |
| GO:00712292 | Cervix | CC | cellular response to acid chemical | 20/2311 | 80/18723 | 1.40e-03 | 1.10e-02 | 20 |
| GO:00015037 | Cervix | CC | ossification | 71/2311 | 408/18723 | 1.67e-03 | 1.28e-02 | 71 |
| GO:00712301 | Cervix | CC | cellular response to amino acid stimulus | 18/2311 | 71/18723 | 2.01e-03 | 1.47e-02 | 18 |
| GO:0070206 | Cervix | CC | protein trimerization | 7/2311 | 17/18723 | 2.72e-03 | 1.85e-02 | 7 |
| GO:00432004 | Cervix | CC | response to amino acid | 25/2311 | 116/18723 | 3.59e-03 | 2.30e-02 | 25 |
| GO:00071795 | Cervix | CC | transforming growth factor beta receptor signaling pathway | 38/2311 | 198/18723 | 3.62e-03 | 2.31e-02 | 38 |
| GO:0030198 | Cervix | CC | extracellular matrix organization | 52/2311 | 301/18723 | 7.43e-03 | 3.98e-02 | 52 |
| GO:0043062 | Cervix | CC | extracellular structure organization | 52/2311 | 302/18723 | 7.92e-03 | 4.17e-02 | 52 |
| GO:0031214 | Cervix | CC | biomineral tissue development | 32/2311 | 169/18723 | 8.73e-03 | 4.48e-02 | 32 |
| GO:0045229 | Cervix | CC | external encapsulating structure organization | 52/2311 | 304/18723 | 9.00e-03 | 4.57e-02 | 52 |
| GO:0030282 | Cervix | CC | bone mineralization | 24/2311 | 119/18723 | 1.00e-02 | 4.89e-02 | 24 |
| GO:0110148 | Cervix | CC | biomineralization | 32/2311 | 171/18723 | 1.04e-02 | 4.97e-02 | 32 |
| Page: 1 2 3 4 5 6 7 8 9 10 11 |
| Pathway ID | Tissue | Disease Stage | Description | Gene Ratio | Bg Ratio | pvalue | p.adjust | qvalue | Count |
| hsa0541520 | Cervix | CC | Diabetic cardiomyopathy | 76/1267 | 203/8465 | 1.40e-15 | 6.46e-14 | 3.82e-14 | 76 |
| hsa0520516 | Cervix | CC | Proteoglycans in cancer | 60/1267 | 205/8465 | 9.13e-08 | 1.18e-06 | 7.00e-07 | 60 |
| hsa0451010 | Cervix | CC | Focal adhesion | 59/1267 | 203/8465 | 1.53e-07 | 1.84e-06 | 1.09e-06 | 59 |
| hsa051657 | Cervix | CC | Human papillomavirus infection | 74/1267 | 331/8465 | 1.70e-04 | 1.02e-03 | 6.03e-04 | 74 |
| hsa051465 | Cervix | CC | Amoebiasis | 29/1267 | 102/8465 | 3.31e-04 | 1.70e-03 | 1.01e-03 | 29 |
| hsa049336 | Cervix | CC | AGE-RAGE signaling pathway in diabetic complications | 25/1267 | 100/8465 | 5.64e-03 | 1.88e-02 | 1.11e-02 | 25 |
| hsa046115 | Cervix | CC | Platelet activation | 28/1267 | 124/8465 | 1.50e-02 | 4.45e-02 | 2.63e-02 | 28 |
| hsa05415110 | Cervix | CC | Diabetic cardiomyopathy | 76/1267 | 203/8465 | 1.40e-15 | 6.46e-14 | 3.82e-14 | 76 |
| hsa0520517 | Cervix | CC | Proteoglycans in cancer | 60/1267 | 205/8465 | 9.13e-08 | 1.18e-06 | 7.00e-07 | 60 |
| hsa0451014 | Cervix | CC | Focal adhesion | 59/1267 | 203/8465 | 1.53e-07 | 1.84e-06 | 1.09e-06 | 59 |
| hsa0516512 | Cervix | CC | Human papillomavirus infection | 74/1267 | 331/8465 | 1.70e-04 | 1.02e-03 | 6.03e-04 | 74 |
| hsa0514612 | Cervix | CC | Amoebiasis | 29/1267 | 102/8465 | 3.31e-04 | 1.70e-03 | 1.01e-03 | 29 |
| hsa0493313 | Cervix | CC | AGE-RAGE signaling pathway in diabetic complications | 25/1267 | 100/8465 | 5.64e-03 | 1.88e-02 | 1.11e-02 | 25 |
| hsa0461113 | Cervix | CC | Platelet activation | 28/1267 | 124/8465 | 1.50e-02 | 4.45e-02 | 2.63e-02 | 28 |
| hsa0541524 | Cervix | HSIL_HPV | Diabetic cardiomyopathy | 30/459 | 203/8465 | 4.38e-07 | 1.07e-05 | 8.64e-06 | 30 |
| hsa0451023 | Cervix | HSIL_HPV | Focal adhesion | 21/459 | 203/8465 | 3.24e-03 | 2.02e-02 | 1.63e-02 | 21 |
| hsa0541534 | Cervix | HSIL_HPV | Diabetic cardiomyopathy | 30/459 | 203/8465 | 4.38e-07 | 1.07e-05 | 8.64e-06 | 30 |
| hsa0451033 | Cervix | HSIL_HPV | Focal adhesion | 21/459 | 203/8465 | 3.24e-03 | 2.02e-02 | 1.63e-02 | 21 |
| hsa0541525 | Endometrium | AEH | Diabetic cardiomyopathy | 86/1197 | 203/8465 | 2.62e-23 | 1.22e-21 | 8.90e-22 | 86 |
| hsa0451015 | Endometrium | AEH | Focal adhesion | 58/1197 | 203/8465 | 4.99e-08 | 7.37e-07 | 5.39e-07 | 58 |
| Page: 1 2 3 4 5 6 7 |
Top |
Cell-cell communication analysis |
| Identification of potential cell-cell interactions between two cell types and their ligand-receptor pairs for different disease states |
| Ligand | Receptor | LRpair | Pathway | Tissue | Disease Stage |
| COL1A2 | ITGA1_ITGB1 | COL1A2_ITGA1_ITGB1 | COLLAGEN | Breast | ADJ |
| COL1A2 | ITGA2_ITGB1 | COL1A2_ITGA2_ITGB1 | COLLAGEN | Breast | ADJ |
| COL1A2 | CD44 | COL1A2_CD44 | COLLAGEN | Breast | ADJ |
| COL1A2 | SDC4 | COL1A2_SDC4 | COLLAGEN | Breast | ADJ |
| COL1A2 | ITGA1_ITGB1 | COL1A2_ITGA1_ITGB1 | COLLAGEN | Breast | DCIS |
| COL1A2 | ITGA2_ITGB1 | COL1A2_ITGA2_ITGB1 | COLLAGEN | Breast | DCIS |
| COL1A2 | CD44 | COL1A2_CD44 | COLLAGEN | Breast | DCIS |
| COL1A2 | SDC1 | COL1A2_SDC1 | COLLAGEN | Breast | DCIS |
| COL1A2 | SDC4 | COL1A2_SDC4 | COLLAGEN | Breast | DCIS |
| COL1A2 | ITGA1_ITGB1 | COL1A2_ITGA1_ITGB1 | COLLAGEN | Breast | Healthy |
| COL1A2 | ITGA2_ITGB1 | COL1A2_ITGA2_ITGB1 | COLLAGEN | Breast | Healthy |
| COL1A2 | ITGAV_ITGB8 | COL1A2_ITGAV_ITGB8 | COLLAGEN | Breast | Healthy |
| COL1A2 | CD44 | COL1A2_CD44 | COLLAGEN | Breast | Healthy |
| COL1A2 | SDC1 | COL1A2_SDC1 | COLLAGEN | Breast | Healthy |
| COL1A2 | SDC4 | COL1A2_SDC4 | COLLAGEN | Breast | Healthy |
| COL1A2 | ITGA1_ITGB1 | COL1A2_ITGA1_ITGB1 | COLLAGEN | Breast | IDC |
| COL1A2 | CD44 | COL1A2_CD44 | COLLAGEN | Breast | IDC |
| COL1A2 | SDC1 | COL1A2_SDC1 | COLLAGEN | Breast | IDC |
| COL1A2 | SDC4 | COL1A2_SDC4 | COLLAGEN | Breast | IDC |
| COL1A2 | ITGA1_ITGB1 | COL1A2_ITGA1_ITGB1 | COLLAGEN | Breast | Precancer |
| Page: 1 2 3 4 5 6 7 8 9 10 11 12 13 14 15 |
Top |
Single-cell gene regulatory network inference analysis |
| Find out the significant the regulons (TFs) and the target genes of each regulon across cell types for different disease states |
| TF | Cell Type | Tissue | Disease Stage | Target Gene | RSS | Regulon Activity |
| ∗The dot plots of a searched regulon are shown for all cell subpopulations in each disease state of each tissue based on the regulon specific score inferred using pySCENIC and by calculating the average expression. |
| Page: 1 |
Top |
Somatic mutation of malignant transformation related genes |
| Annotation of somatic variants for genes involved in malignant transformation |
| Hugo Symbol | Variant Class | Variant Classification | dbSNP RS | HGVSc | HGVSp | HGVSp Short | SWISSPROT | BIOTYPE | SIFT | PolyPhen | Tumor Sample Barcode | Tissue | Histology | Sex | Age | Stage | Therapy Types | Drugs | Outcome |
| COL1A2 | SNV | Missense_Mutation | rs140434765 | c.1562N>T | p.Ala521Val | p.A521V | P08123 | protein_coding | tolerated(0.26) | benign(0.433) | TCGA-A2-A04X-01 | Breast | breast invasive carcinoma | Female | <65 | I/II | Chemotherapy | adriamycin | SD |
| COL1A2 | SNV | Missense_Mutation | novel | c.1811N>A | p.Gly604Asp | p.G604D | P08123 | protein_coding | deleterious(0) | probably_damaging(1) | TCGA-A8-A081-01 | Breast | breast invasive carcinoma | Female | >=65 | I/II | Unknown | Unknown | SD |
| COL1A2 | SNV | Missense_Mutation | rs72658193 | c.2503N>A | p.Gly835Ser | p.G835S | P08123 | protein_coding | deleterious(0) | probably_damaging(0.998) | TCGA-A8-A099-01 | Breast | breast invasive carcinoma | Female | >=65 | III/IV | Hormone Therapy | exemestane | SD |
| COL1A2 | SNV | Missense_Mutation | c.1988N>C | p.Arg663Thr | p.R663T | P08123 | protein_coding | deleterious(0.01) | benign(0.138) | TCGA-A8-A0A7-01 | Breast | breast invasive carcinoma | Female | <65 | I/II | Unknown | Unknown | SD | |
| COL1A2 | SNV | Missense_Mutation | rs749509413 | c.1213C>T | p.Arg405Cys | p.R405C | P08123 | protein_coding | deleterious(0) | probably_damaging(0.996) | TCGA-AN-A046-01 | Breast | breast invasive carcinoma | Female | >=65 | I/II | Unknown | Unknown | SD |
| COL1A2 | SNV | Missense_Mutation | c.1565N>T | p.Pro522Leu | p.P522L | P08123 | protein_coding | deleterious(0.03) | probably_damaging(0.999) | TCGA-BH-A0BZ-01 | Breast | breast invasive carcinoma | Female | <65 | III/IV | Chemotherapy | doxorubicin | CR | |
| COL1A2 | SNV | Missense_Mutation | rs543815305 | c.1419N>G | p.Ile473Met | p.I473M | P08123 | protein_coding | deleterious(0.03) | possibly_damaging(0.454) | TCGA-BH-A0W7-01 | Breast | breast invasive carcinoma | Female | <65 | I/II | Chemotherapy | taxotere | CR |
| COL1A2 | SNV | Missense_Mutation | c.2587N>T | p.Pro863Ser | p.P863S | P08123 | protein_coding | tolerated(0.05) | benign(0.013) | TCGA-BH-A1F8-01 | Breast | breast invasive carcinoma | Female | >=65 | III/IV | Unknown | Unknown | PD | |
| COL1A2 | SNV | Missense_Mutation | novel | c.1126G>T | p.Gly376Cys | p.G376C | P08123 | protein_coding | deleterious(0) | probably_damaging(1) | TCGA-C8-A1HI-01 | Breast | breast invasive carcinoma | Female | <65 | III/IV | Unknown | Unknown | SD |
| COL1A2 | SNV | Missense_Mutation | c.1186N>A | p.Pro396Thr | p.P396T | P08123 | protein_coding | tolerated(0.19) | benign(0.015) | TCGA-E2-A10C-01 | Breast | breast invasive carcinoma | Female | <65 | I/II | Chemotherapy | cytoxan | SD |
| Page: 1 2 3 4 5 6 7 8 9 10 11 12 13 14 15 16 17 18 19 20 21 22 23 24 25 26 |
Top |
Related drugs of malignant transformation related genes |
| Identification of chemicals and drugs interact with genes involved in malignant transfromation |
| (DGIdb 4.0) |
| Entrez ID | Symbol | Category | Interaction Types | Drug Claim Name | Drug Name | PMIDs |
| 1278 | COL1A2 | DRUGGABLE GENOME | Solubilized type 1 native bovine collagen | |||
| 1278 | COL1A2 | DRUGGABLE GENOME | TNF-ALPHA | 12393755 | ||
| 1278 | COL1A2 | DRUGGABLE GENOME | COLLAGENASE CLOSTRIDIUM HISTOLYTICUM | |||
| 1278 | COL1A2 | DRUGGABLE GENOME | CHEMBL2095222 | OCRIPLASMIN | ||
| 1278 | COL1A2 | DRUGGABLE GENOME | IFN | 14512876 | ||
| 1278 | COL1A2 | DRUGGABLE GENOME | CHEMBL2108709 | COLLAGENASE CLOSTRIDIUM HISTOLYTICUM | ||
| 1278 | COL1A2 | DRUGGABLE GENOME | COLLAGENASE | COLLAGENASE CLOSTRIDIUM HISTOLYTICUM | ||
| 1278 | COL1A2 | DRUGGABLE GENOME | TGF-BETA 2 | 15223827 | ||
| 1278 | COL1A2 | DRUGGABLE GENOME | COLLAGENASE CLOSTRIDIUM HISTOLYTICUM | |||
| 1278 | COL1A2 | DRUGGABLE GENOME | TRANSFORMING GROWTH FACTOR | 14520013 |
| Page: 1 |

Copyright 2023-Present -The University of Texas Health Science Center at Houston |