
|
|||||
|
 | |
| |
| |
| |
| |
| |
|
Gene: COL19A1 |
Gene summary for COL19A1 |
| Gene information | Species | Human | Gene symbol | COL19A1 | Gene ID | 1310 |
| Gene name | collagen type XIX alpha 1 chain | |
| Gene Alias | COL9A1L | |
| Cytomap | 6q13 | |
| Gene Type | protein-coding | GO ID | GO:0001501 | UniProtAcc | Q14993 |
Top |
Malignant transformation analysis |
| Identification of the aberrant gene expression in precancerous and cancerous lesions by comparing the gene expression of stem-like cells in diseased tissues with normal stem cells |
| Entrez ID | Symbol | Replicates | Species | Organ | Tissue | Adj P-value | Log2FC | Malignancy |
| 1310 | COL19A1 | HTA11_3410_2000001011 | Human | Colorectum | AD | 1.91e-11 | -3.58e-01 | 0.0155 |
| 1310 | COL19A1 | HTA11_78_2000001011 | Human | Colorectum | AD | 1.30e-04 | -3.30e-01 | -0.1088 |
| 1310 | COL19A1 | HTA11_347_2000001011 | Human | Colorectum | AD | 3.09e-08 | -3.33e-01 | -0.1954 |
| 1310 | COL19A1 | HTA11_696_2000001011 | Human | Colorectum | AD | 3.19e-07 | -3.15e-01 | -0.1464 |
| 1310 | COL19A1 | HTA11_866_2000001011 | Human | Colorectum | AD | 7.11e-06 | -3.18e-01 | -0.1001 |
| 1310 | COL19A1 | HTA11_7862_2000001011 | Human | Colorectum | AD | 2.04e-02 | -3.63e-01 | -0.0179 |
| 1310 | COL19A1 | HTA11_866_3004761011 | Human | Colorectum | AD | 1.21e-07 | -3.44e-01 | 0.096 |
| 1310 | COL19A1 | HTA11_7696_3000711011 | Human | Colorectum | AD | 1.75e-06 | -3.39e-01 | 0.0674 |
| 1310 | COL19A1 | HTA11_99999970781_79442 | Human | Colorectum | MSS | 2.06e-11 | -3.53e-01 | 0.294 |
| 1310 | COL19A1 | HTA11_99999965104_69814 | Human | Colorectum | MSS | 1.67e-02 | -3.38e-01 | 0.281 |
| 1310 | COL19A1 | HTA11_99999971662_82457 | Human | Colorectum | MSS | 1.62e-11 | -3.37e-01 | 0.3859 |
| 1310 | COL19A1 | HTA11_99999974143_84620 | Human | Colorectum | MSS | 8.14e-08 | -3.23e-01 | 0.3005 |
| 1310 | COL19A1 | A002-C-010 | Human | Colorectum | FAP | 1.56e-05 | -1.47e-01 | 0.242 |
| 1310 | COL19A1 | A015-C-203 | Human | Colorectum | FAP | 7.69e-49 | 9.59e-01 | -0.1294 |
| 1310 | COL19A1 | A015-C-204 | Human | Colorectum | FAP | 1.47e-24 | 9.79e-01 | -0.0228 |
| 1310 | COL19A1 | A014-C-040 | Human | Colorectum | FAP | 2.30e-13 | 1.02e+00 | -0.1184 |
| 1310 | COL19A1 | A002-C-201 | Human | Colorectum | FAP | 7.94e-21 | 7.86e-01 | 0.0324 |
| 1310 | COL19A1 | A001-C-119 | Human | Colorectum | FAP | 1.25e-53 | 1.37e+00 | -0.1557 |
| 1310 | COL19A1 | A001-C-108 | Human | Colorectum | FAP | 3.02e-26 | 7.17e-01 | -0.0272 |
| 1310 | COL19A1 | A002-C-021 | Human | Colorectum | FAP | 2.49e-11 | 5.23e-01 | 0.1171 |
| Page: 1 2 |
| Tissue | Expression Dynamics | Abbreviation |
| Colorectum (GSE201348) |  | FAP: Familial adenomatous polyposis |
| CRC: Colorectal cancer | ||
| Colorectum (HTA11) | 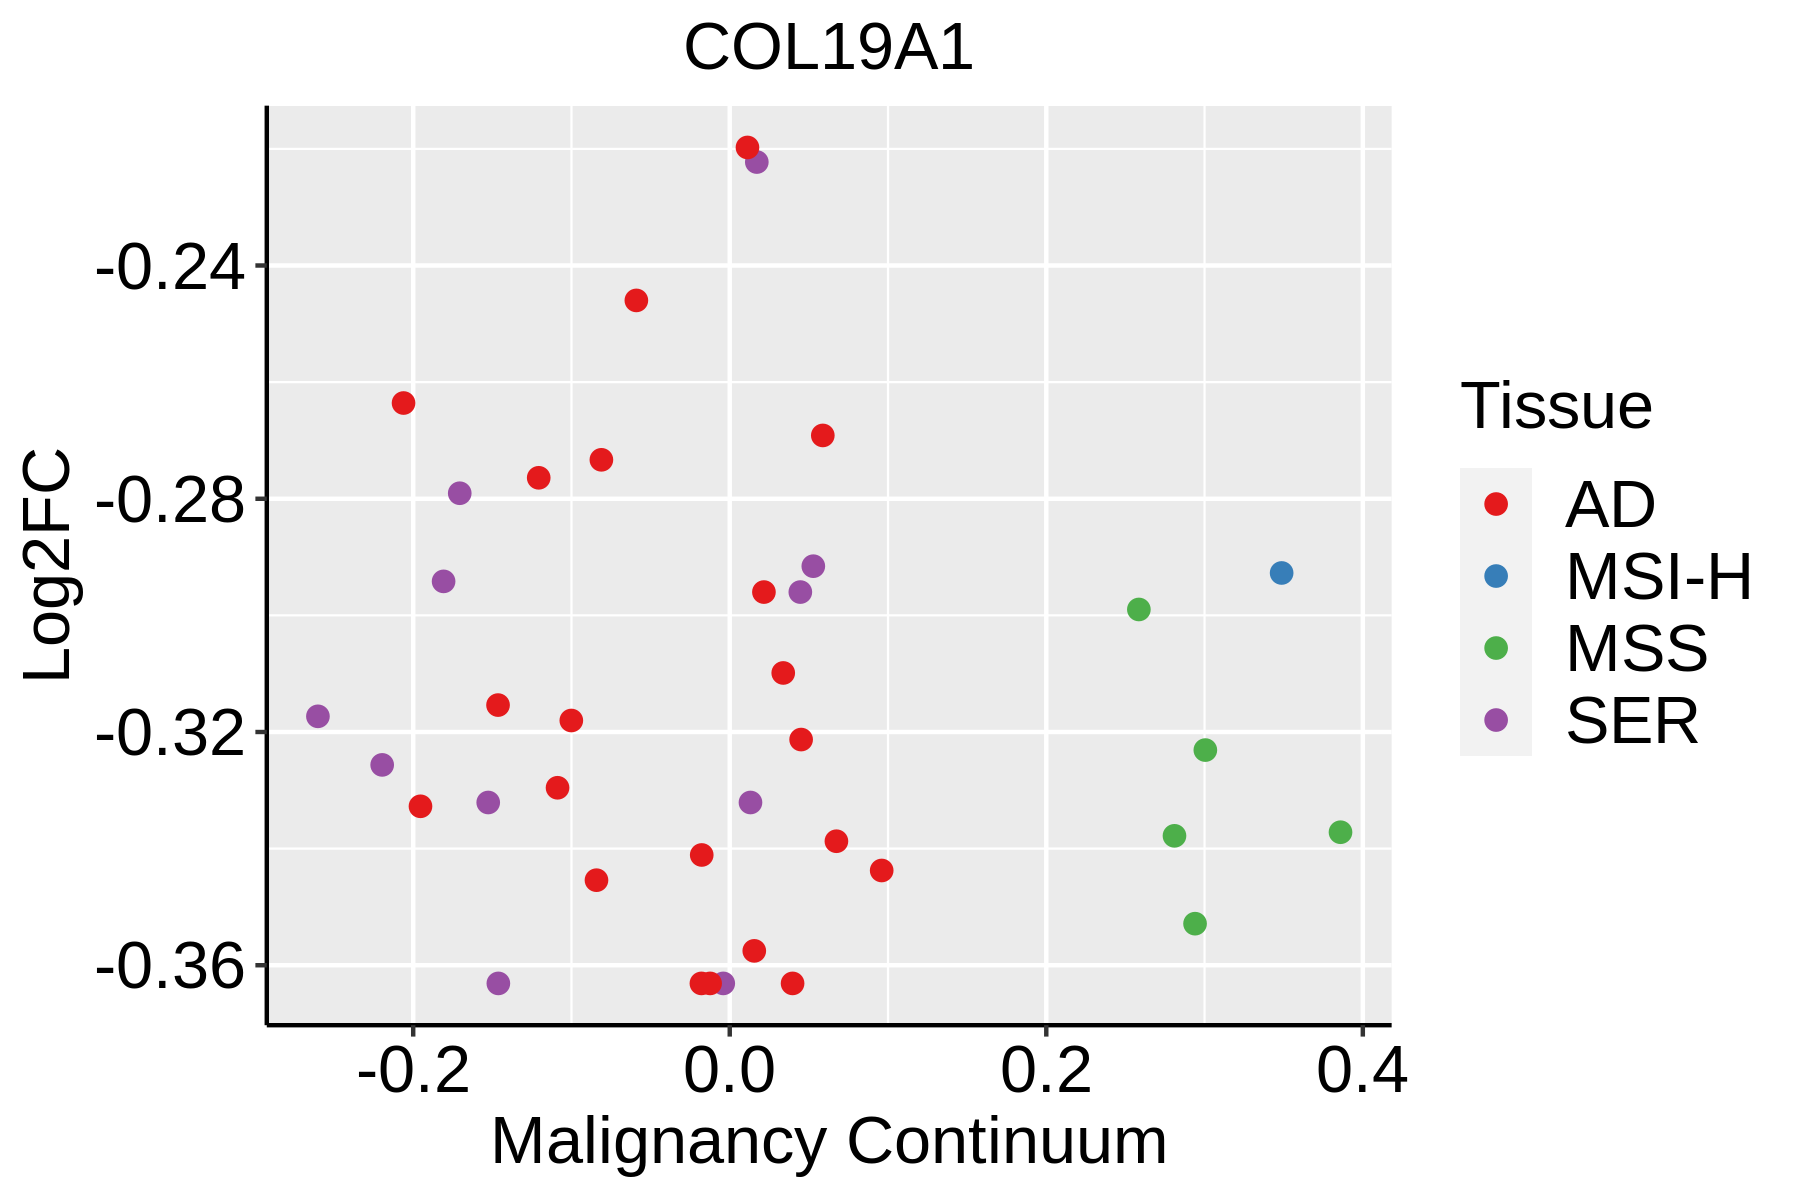 | AD: Adenomas |
| SER: Sessile serrated lesions | ||
| MSI-H: Microsatellite-high colorectal cancer | ||
| MSS: Microsatellite stable colorectal cancer |
| ∗log2FC in expression of this searched gene in stem-like cells from each diseased tissue sample relative to stem-like cells in normal samples in each tissue plotted against the malignancy continuum. Samples are colored based on if they are from different disease stage. |
Top |
Malignant transformation related pathway analysis |
| Find out the enriched GO biological processes and KEGG pathways involved in transition from healthy to precancer to cancer |
| Tissue | Disease Stage | Enriched GO biological Processes |
| Colorectum | AD |  |
| Colorectum | SER |  |
| Colorectum | MSS |  |
| Colorectum | MSI-H |  |
| Colorectum | FAP |  |
| ∗Top 15 enriched GO BP terms are showed in the bar plot of each disease state in each tissue. Each row represents a significant GO biological process which is colored according to the -log10(p.adjust). |
| Page: 1 2 3 4 5 6 7 8 9 |
| GO ID | Tissue | Disease Stage | Description | Gene Ratio | Bg Ratio | pvalue | p.adjust | Count |
| GO:0060537 | Colorectum | CRC | muscle tissue development | 63/2078 | 403/18723 | 3.17e-03 | 2.78e-02 | 63 |
| GO:0014706 | Colorectum | CRC | striated muscle tissue development | 59/2078 | 384/18723 | 6.11e-03 | 4.47e-02 | 59 |
| Page: 1 |
| Pathway ID | Tissue | Disease Stage | Description | Gene Ratio | Bg Ratio | pvalue | p.adjust | qvalue | Count |
| Page: 1 |
Top |
Cell-cell communication analysis |
| Identification of potential cell-cell interactions between two cell types and their ligand-receptor pairs for different disease states |
| Ligand | Receptor | LRpair | Pathway | Tissue | Disease Stage |
| Page: 1 |
Top |
Single-cell gene regulatory network inference analysis |
| Find out the significant the regulons (TFs) and the target genes of each regulon across cell types for different disease states |
| TF | Cell Type | Tissue | Disease Stage | Target Gene | RSS | Regulon Activity |
| ∗The dot plots of a searched regulon are shown for all cell subpopulations in each disease state of each tissue based on the regulon specific score inferred using pySCENIC and by calculating the average expression. |
| Page: 1 |
Top |
Somatic mutation of malignant transformation related genes |
| Annotation of somatic variants for genes involved in malignant transformation |
| Hugo Symbol | Variant Class | Variant Classification | dbSNP RS | HGVSc | HGVSp | HGVSp Short | SWISSPROT | BIOTYPE | SIFT | PolyPhen | Tumor Sample Barcode | Tissue | Histology | Sex | Age | Stage | Therapy Types | Drugs | Outcome |
| COL19A1 | SNV | Missense_Mutation | rs779103372 | c.1612C>A | p.Pro538Thr | p.P538T | Q14993 | protein_coding | tolerated(0.46) | benign(0.152) | TCGA-A2-A04N-01 | Breast | breast invasive carcinoma | Female | >=65 | I/II | Chemotherapy | cytoxan | SD |
| COL19A1 | SNV | Missense_Mutation | c.2114N>T | p.Gly705Val | p.G705V | Q14993 | protein_coding | deleterious(0) | probably_damaging(0.943) | TCGA-A2-A0D0-01 | Breast | breast invasive carcinoma | Female | <65 | I/II | Chemotherapy | cytoxan | SD | |
| COL19A1 | SNV | Missense_Mutation | rs779103372 | c.1612N>A | p.Pro538Thr | p.P538T | Q14993 | protein_coding | tolerated(0.46) | benign(0.152) | TCGA-A2-A0YC-01 | Breast | breast invasive carcinoma | Female | <65 | I/II | Hormone Therapy | arimidex | PD |
| COL19A1 | SNV | Missense_Mutation | novel | c.3292N>T | p.Gly1098Trp | p.G1098W | Q14993 | protein_coding | deleterious(0) | probably_damaging(1) | TCGA-A7-A0DB-01 | Breast | breast invasive carcinoma | Female | <65 | I/II | Hormone Therapy | arimidex | SD |
| COL19A1 | SNV | Missense_Mutation | novel | c.2896N>A | p.Glu966Lys | p.E966K | Q14993 | protein_coding | deleterious(0) | probably_damaging(0.989) | TCGA-AC-A2B8-01 | Breast | breast invasive carcinoma | Female | >=65 | I/II | Chemotherapy | chemo | PD |
| COL19A1 | SNV | Missense_Mutation | c.2920N>T | p.Gly974Cys | p.G974C | Q14993 | protein_coding | deleterious(0) | probably_damaging(1) | TCGA-AN-A0AK-01 | Breast | breast invasive carcinoma | Female | >=65 | I/II | Unknown | Unknown | SD | |
| COL19A1 | SNV | Missense_Mutation | c.2975N>C | p.Gly992Ala | p.G992A | Q14993 | protein_coding | deleterious(0) | probably_damaging(0.999) | TCGA-AN-A0FX-01 | Breast | breast invasive carcinoma | Female | <65 | I/II | Unknown | Unknown | SD | |
| COL19A1 | SNV | Missense_Mutation | rs779103372 | c.1612N>A | p.Pro538Thr | p.P538T | Q14993 | protein_coding | tolerated(0.46) | benign(0.152) | TCGA-AO-A03T-01 | Breast | breast invasive carcinoma | Female | <65 | I/II | Chemotherapy | cyclophosphamide | SD |
| COL19A1 | SNV | Missense_Mutation | rs779103372 | c.1612C>A | p.Pro538Thr | p.P538T | Q14993 | protein_coding | tolerated(0.46) | benign(0.152) | TCGA-AR-A0TQ-01 | Breast | breast invasive carcinoma | Female | <65 | III/IV | Chemotherapy | doxorubicin | SD |
| COL19A1 | SNV | Missense_Mutation | c.769N>C | p.Gly257Arg | p.G257R | Q14993 | protein_coding | tolerated(0.56) | benign(0.231) | TCGA-AR-A251-01 | Breast | breast invasive carcinoma | Female | <65 | III/IV | Chemotherapy | doxorubicin | SD |
| Page: 1 2 3 4 5 6 7 8 9 10 11 12 13 14 15 16 17 18 19 20 21 22 23 |
Top |
Related drugs of malignant transformation related genes |
| Identification of chemicals and drugs interact with genes involved in malignant transfromation |
| (DGIdb 4.0) |
| Entrez ID | Symbol | Category | Interaction Types | Drug Claim Name | Drug Name | PMIDs |
| Page: 1 |

Copyright 2023-Present -The University of Texas Health Science Center at Houston |