
|
|||||
|
 | |
| |
| |
| |
| |
| |
|
Gene: COL18A1 |
Gene summary for COL18A1 |
| Gene information | Species | Human | Gene symbol | COL18A1 | Gene ID | 80781 |
| Gene name | collagen type XVIII alpha 1 chain | |
| Gene Alias | GLCC | |
| Cytomap | 21q22.3 | |
| Gene Type | protein-coding | GO ID | GO:0000902 | UniProtAcc | D3DSM5 |
Top |
Malignant transformation analysis |
| Identification of the aberrant gene expression in precancerous and cancerous lesions by comparing the gene expression of stem-like cells in diseased tissues with normal stem cells |
| Entrez ID | Symbol | Replicates | Species | Organ | Tissue | Adj P-value | Log2FC | Malignancy |
| 80781 | COL18A1 | AEH-subject1 | Human | Endometrium | AEH | 1.07e-11 | 4.30e-01 | -0.3059 |
| 80781 | COL18A1 | AEH-subject2 | Human | Endometrium | AEH | 2.39e-14 | 4.11e-01 | -0.2525 |
| 80781 | COL18A1 | AEH-subject3 | Human | Endometrium | AEH | 3.14e-04 | 2.44e-01 | -0.2576 |
| 80781 | COL18A1 | AEH-subject5 | Human | Endometrium | AEH | 3.36e-03 | 1.61e-01 | -0.2953 |
| 80781 | COL18A1 | EEC-subject1 | Human | Endometrium | EEC | 1.37e-14 | 2.97e-01 | -0.2682 |
| 80781 | COL18A1 | EEC-subject2 | Human | Endometrium | EEC | 1.22e-12 | 5.11e-01 | -0.2607 |
| 80781 | COL18A1 | EEC-subject3 | Human | Endometrium | EEC | 1.46e-18 | -3.43e-02 | -0.2525 |
| 80781 | COL18A1 | EEC-subject5 | Human | Endometrium | EEC | 1.14e-07 | 3.50e-01 | -0.249 |
| 80781 | COL18A1 | GSM6177620_NYU_UCEC1_lib1_lib1 | Human | Endometrium | EEC | 7.36e-23 | -6.13e-02 | -0.1869 |
| 80781 | COL18A1 | GSM6177620_NYU_UCEC1_lib2_lib2 | Human | Endometrium | EEC | 1.95e-22 | -1.94e-01 | -0.1875 |
| 80781 | COL18A1 | GSM6177620_NYU_UCEC1_lib3_lib3 | Human | Endometrium | EEC | 1.79e-25 | -2.28e-01 | -0.1883 |
| 80781 | COL18A1 | GSM6177621_NYU_UCEC2_lib1_lib1 | Human | Endometrium | EEC | 4.17e-19 | 1.22e-01 | -0.1934 |
| 80781 | COL18A1 | GSM6177622_NYU_UCEC3_lib1_lib1 | Human | Endometrium | EEC | 1.06e-29 | -1.08e-01 | -0.1917 |
| 80781 | COL18A1 | GSM6177622_NYU_UCEC3_lib2_lib2 | Human | Endometrium | EEC | 4.47e-36 | 2.89e-02 | -0.1916 |
| 80781 | COL18A1 | GSM6177623_NYU_UCEC3_Vis | Human | Endometrium | EEC | 2.78e-58 | 8.82e-01 | -0.1269 |
| 80781 | COL18A1 | LZE4T | Human | Esophagus | ESCC | 2.91e-08 | 8.64e-02 | 0.0811 |
| 80781 | COL18A1 | LZE7T | Human | Esophagus | ESCC | 3.53e-07 | 5.28e-02 | 0.0667 |
| 80781 | COL18A1 | LZE22T | Human | Esophagus | ESCC | 4.24e-06 | 7.72e-02 | 0.068 |
| 80781 | COL18A1 | LZE24T | Human | Esophagus | ESCC | 3.85e-04 | -1.03e-01 | 0.0596 |
| 80781 | COL18A1 | P2T-E | Human | Esophagus | ESCC | 9.54e-26 | 5.07e-01 | 0.1177 |
| Page: 1 2 3 4 5 6 7 |
| Tissue | Expression Dynamics | Abbreviation |
| Endometrium |  | AEH: Atypical endometrial hyperplasia |
| EEC: Endometrioid Cancer | ||
| Esophagus | 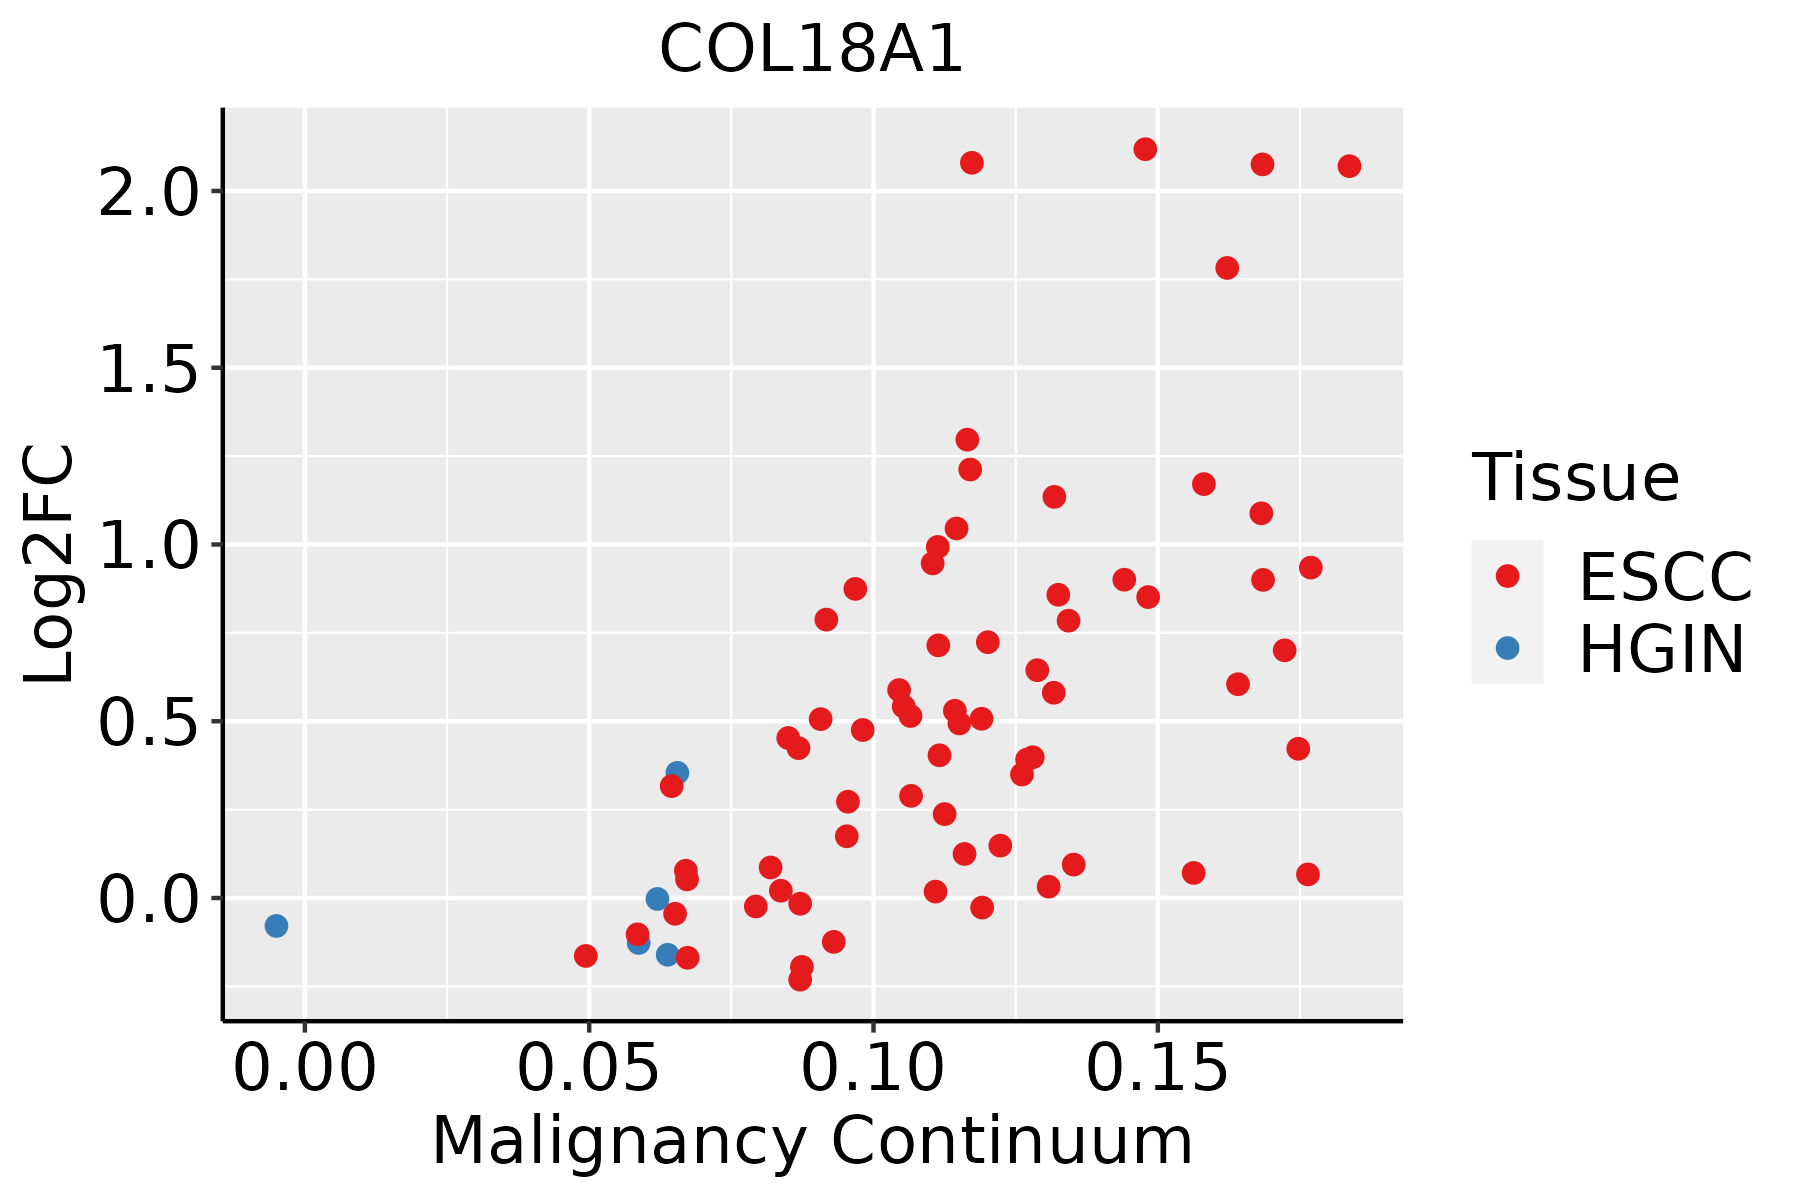 | ESCC: Esophageal squamous cell carcinoma |
| HGIN: High-grade intraepithelial neoplasias | ||
| LGIN: Low-grade intraepithelial neoplasias | ||
| Liver | 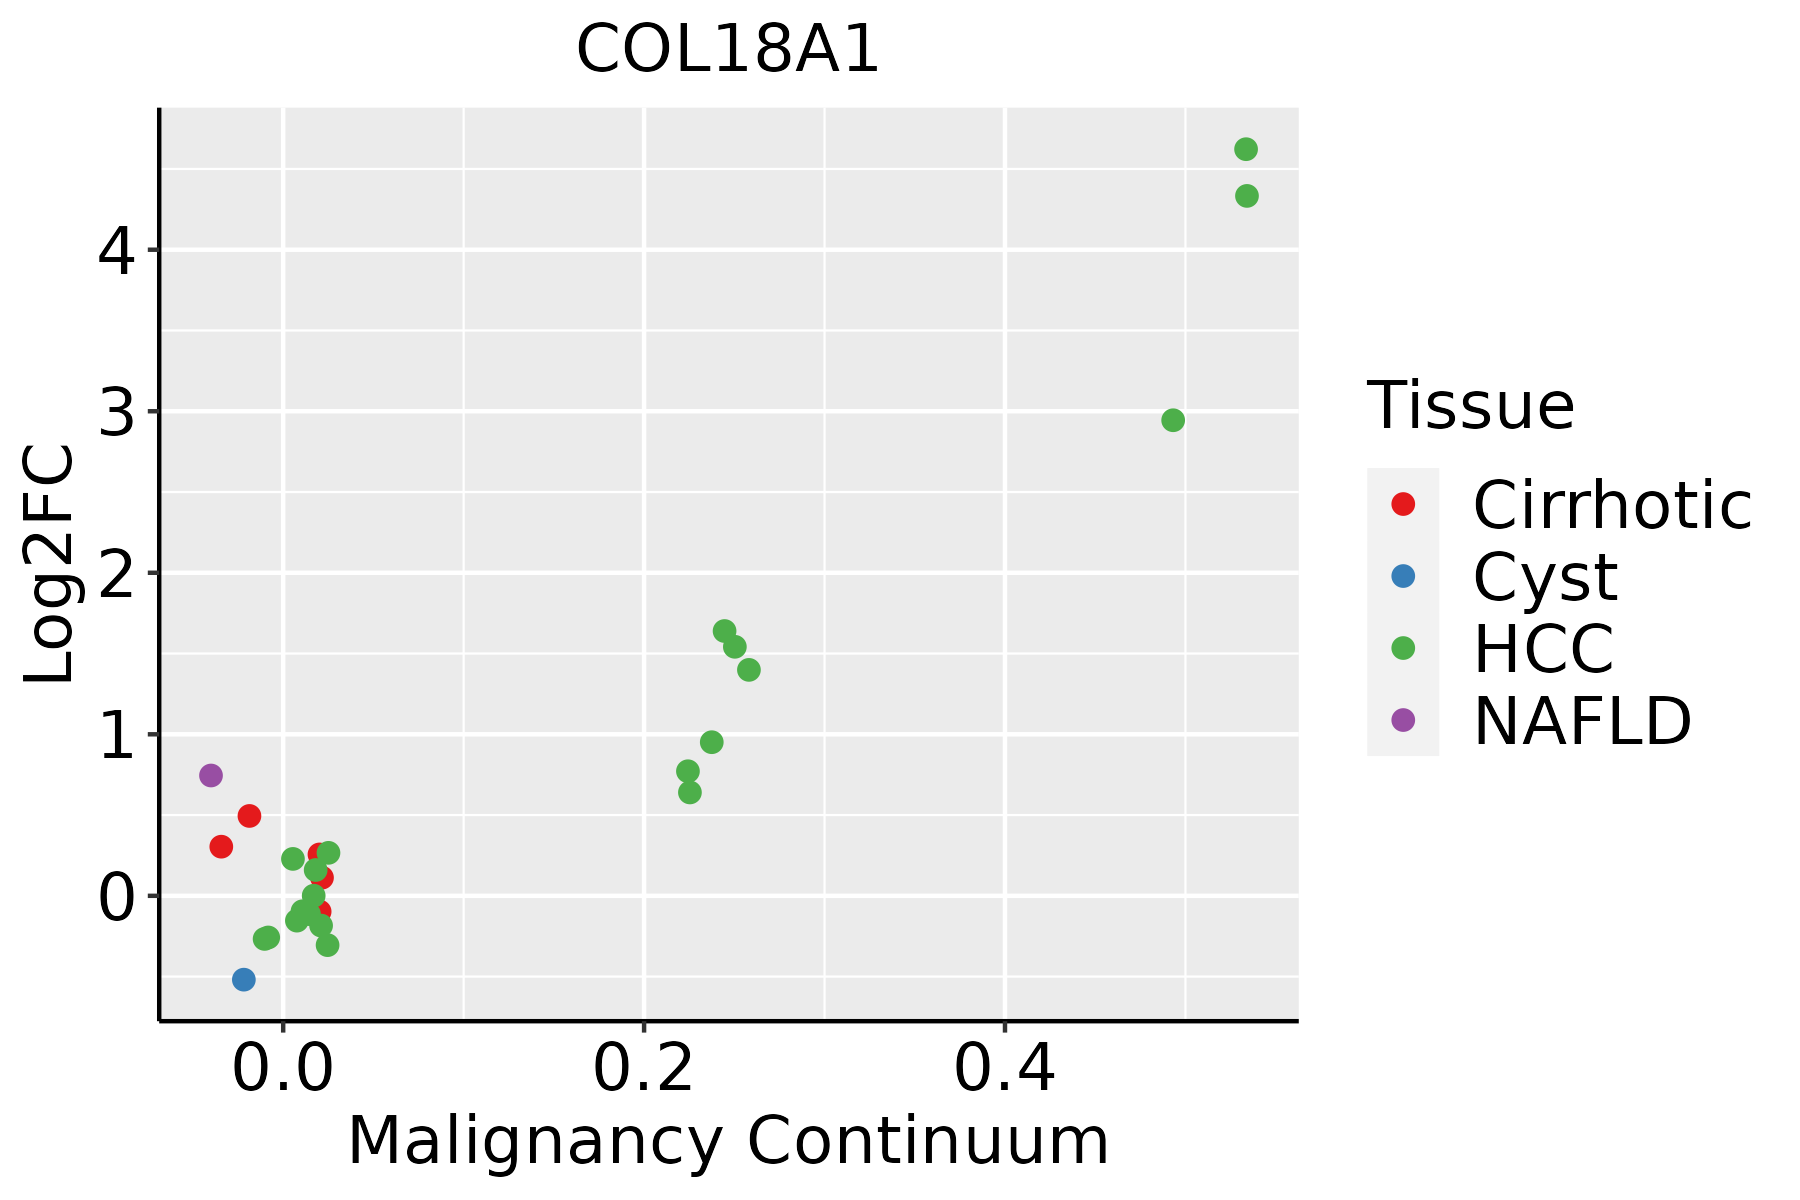 | HCC: Hepatocellular carcinoma |
| NAFLD: Non-alcoholic fatty liver disease | ||
| Oral Cavity | 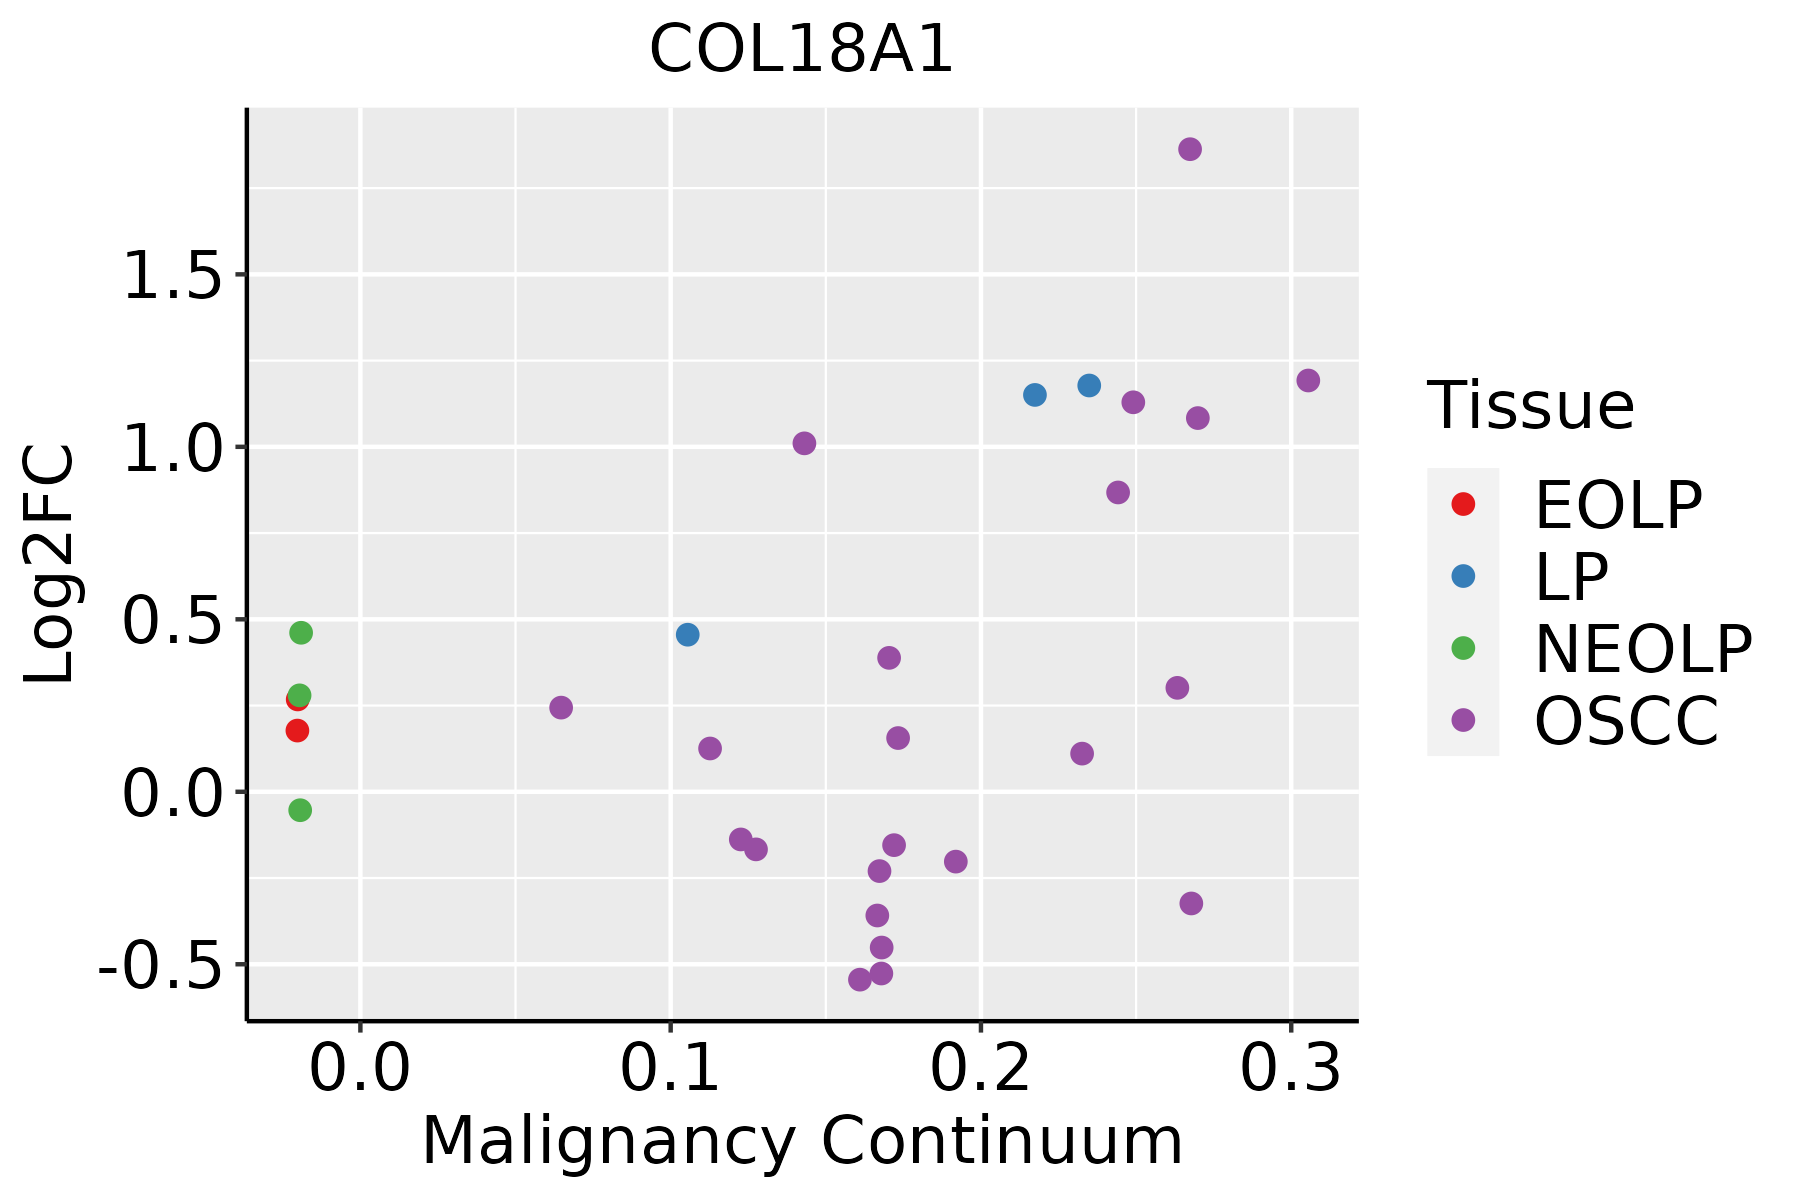 | EOLP: Erosive Oral lichen planus |
| LP: leukoplakia | ||
| NEOLP: Non-erosive oral lichen planus | ||
| OSCC: Oral squamous cell carcinoma | ||
| Prostate |  | BPH: Benign Prostatic Hyperplasia |
| Skin | 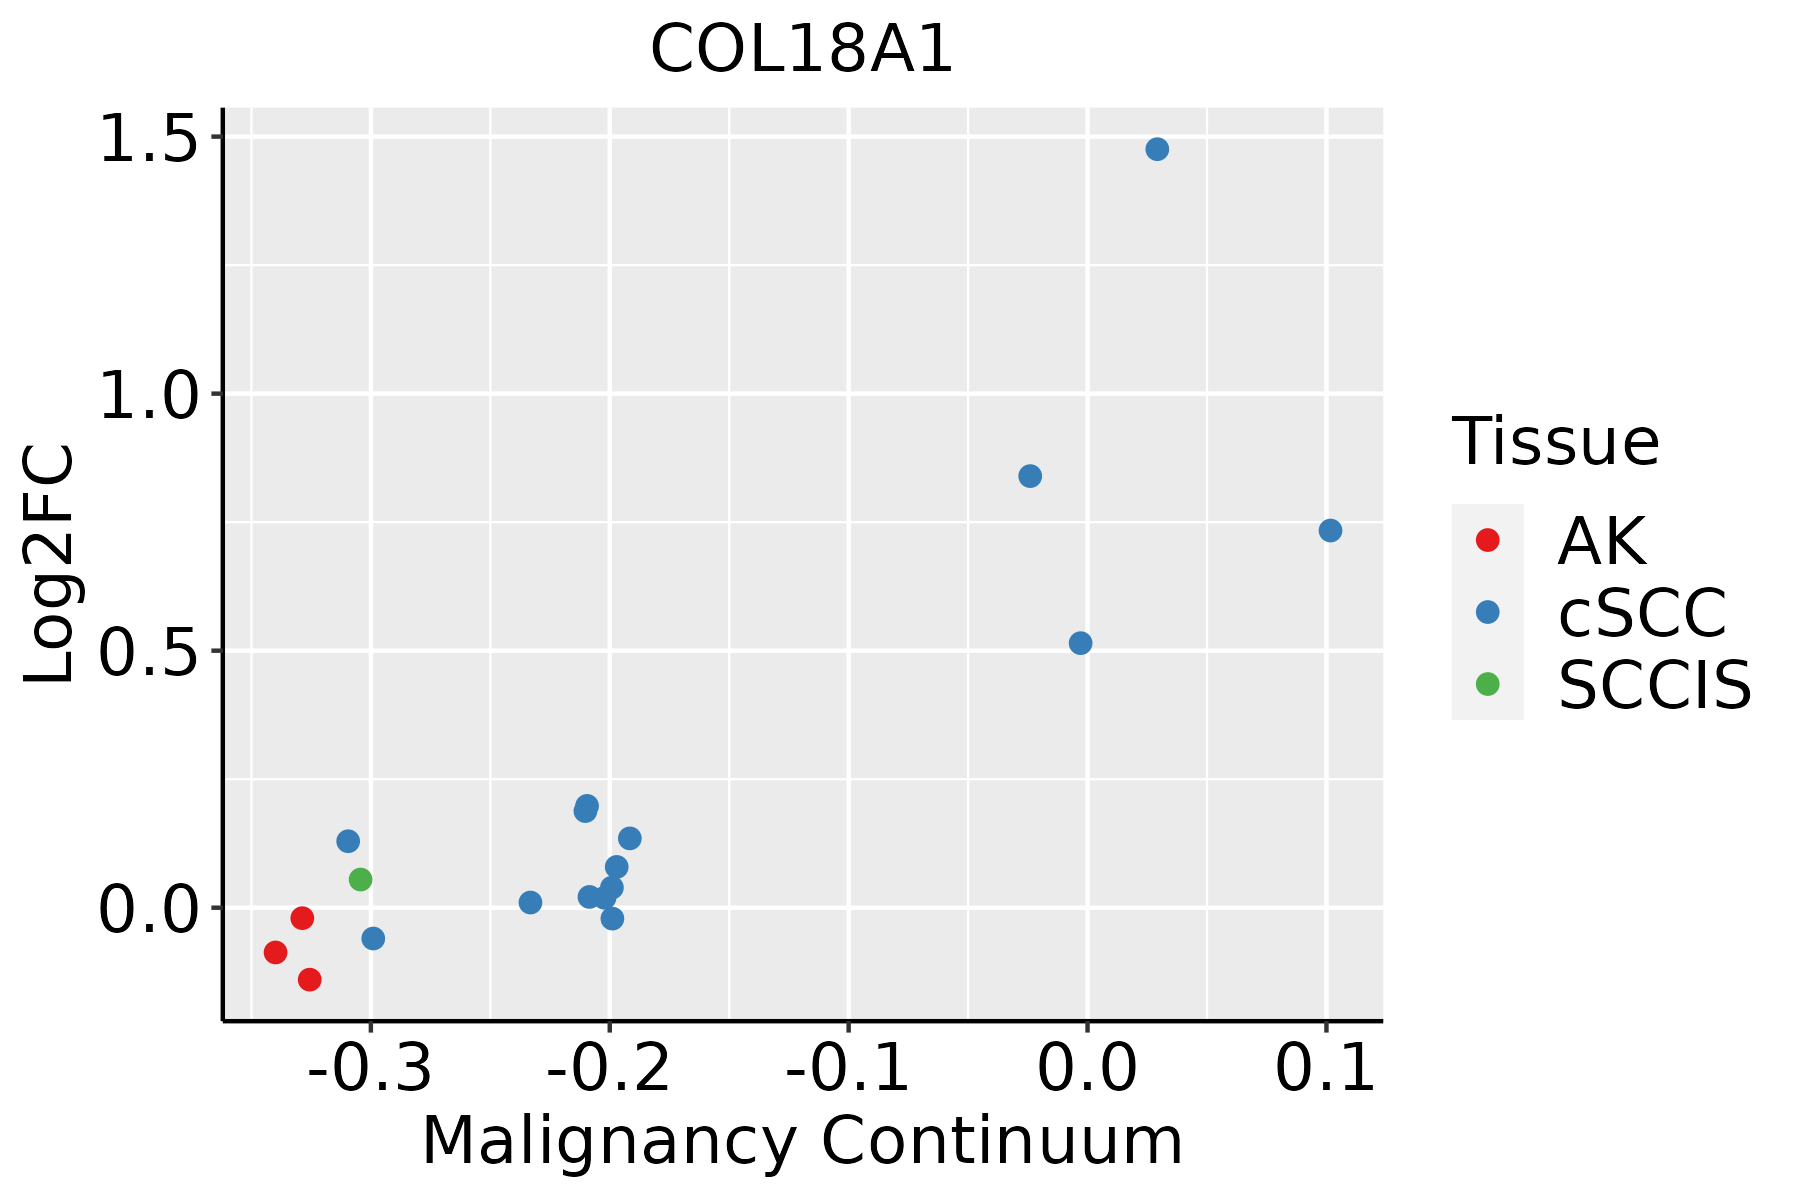 | AK: Actinic keratosis |
| cSCC: Cutaneous squamous cell carcinoma | ||
| SCCIS:squamous cell carcinoma in situ | ||
| Thyroid | 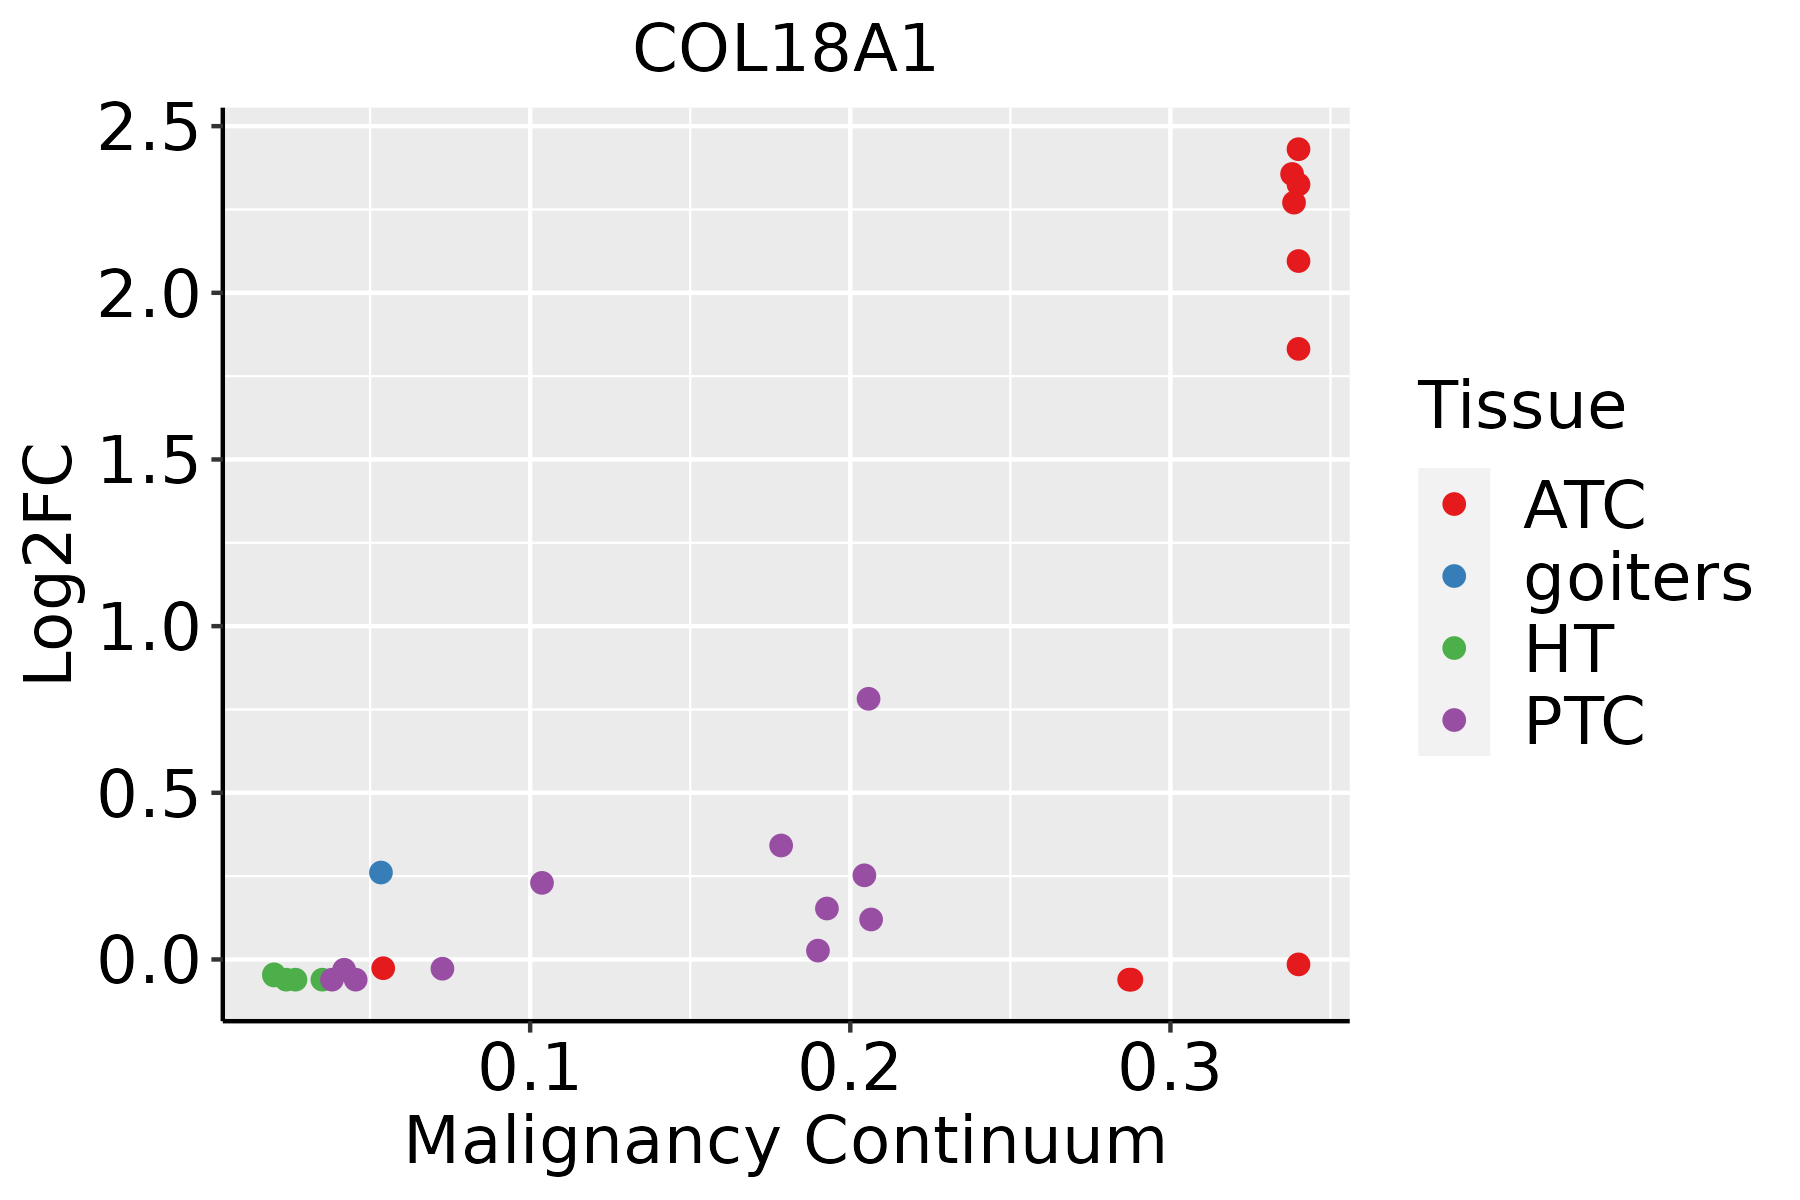 | ATC: Anaplastic thyroid cancer |
| HT: Hashimoto's thyroiditis | ||
| PTC: Papillary thyroid cancer |
| ∗log2FC in expression of this searched gene in stem-like cells from each diseased tissue sample relative to stem-like cells in normal samples in each tissue plotted against the malignancy continuum. Samples are colored based on if they are from different disease stage. |
Top |
Malignant transformation related pathway analysis |
| Find out the enriched GO biological processes and KEGG pathways involved in transition from healthy to precancer to cancer |
| Tissue | Disease Stage | Enriched GO biological Processes |
| Colorectum | AD |  |
| Colorectum | SER |  |
| Colorectum | MSS |  |
| Colorectum | MSI-H |  |
| Colorectum | FAP |  |
| ∗Top 15 enriched GO BP terms are showed in the bar plot of each disease state in each tissue. Each row represents a significant GO biological process which is colored according to the -log10(p.adjust). |
| Page: 1 2 3 4 5 6 7 8 9 |
| GO ID | Tissue | Disease Stage | Description | Gene Ratio | Bg Ratio | pvalue | p.adjust | Count |
| GO:000315810 | Endometrium | AEH | endothelium development | 31/2100 | 136/18723 | 8.53e-05 | 1.26e-03 | 31 |
| GO:000206415 | Endometrium | AEH | epithelial cell development | 43/2100 | 220/18723 | 1.94e-04 | 2.48e-03 | 43 |
| GO:00011017 | Endometrium | AEH | response to acid chemical | 28/2100 | 135/18723 | 9.24e-04 | 8.43e-03 | 28 |
| GO:00454467 | Endometrium | AEH | endothelial cell differentiation | 24/2100 | 118/18723 | 2.71e-03 | 1.96e-02 | 24 |
| GO:000941010 | Endometrium | AEH | response to xenobiotic stimulus | 71/2100 | 462/18723 | 3.66e-03 | 2.50e-02 | 71 |
| GO:000315813 | Endometrium | EEC | endothelium development | 32/2168 | 136/18723 | 6.37e-05 | 9.48e-04 | 32 |
| GO:000206416 | Endometrium | EEC | epithelial cell development | 45/2168 | 220/18723 | 9.73e-05 | 1.35e-03 | 45 |
| GO:000110113 | Endometrium | EEC | response to acid chemical | 29/2168 | 135/18723 | 6.98e-04 | 6.68e-03 | 29 |
| GO:004544613 | Endometrium | EEC | endothelial cell differentiation | 25/2168 | 118/18723 | 1.93e-03 | 1.47e-02 | 25 |
| GO:000941015 | Endometrium | EEC | response to xenobiotic stimulus | 73/2168 | 462/18723 | 3.55e-03 | 2.38e-02 | 73 |
| GO:00018857 | Endometrium | EEC | endothelial cell development | 15/2168 | 64/18723 | 5.54e-03 | 3.36e-02 | 15 |
| GO:000206420 | Esophagus | ESCC | epithelial cell development | 136/8552 | 220/18723 | 9.50e-07 | 1.21e-05 | 136 |
| GO:000941020 | Esophagus | ESCC | response to xenobiotic stimulus | 253/8552 | 462/18723 | 4.55e-05 | 3.58e-04 | 253 |
| GO:00301984 | Esophagus | ESCC | extracellular matrix organization | 171/8552 | 301/18723 | 6.08e-05 | 4.67e-04 | 171 |
| GO:000110110 | Esophagus | ESCC | response to acid chemical | 84/8552 | 135/18723 | 7.70e-05 | 5.74e-04 | 84 |
| GO:00430624 | Esophagus | ESCC | extracellular structure organization | 171/8552 | 302/18723 | 7.73e-05 | 5.76e-04 | 171 |
| GO:00452294 | Esophagus | ESCC | external encapsulating structure organization | 172/8552 | 304/18723 | 7.80e-05 | 5.80e-04 | 172 |
| GO:000188510 | Esophagus | ESCC | endothelial cell development | 44/8552 | 64/18723 | 1.59e-04 | 1.05e-03 | 44 |
| GO:004544610 | Esophagus | ESCC | endothelial cell differentiation | 67/8552 | 118/18723 | 9.86e-03 | 3.40e-02 | 67 |
| GO:000315818 | Esophagus | ESCC | endothelium development | 76/8552 | 136/18723 | 1.05e-02 | 3.59e-02 | 76 |
| Page: 1 2 3 4 5 6 |
| Pathway ID | Tissue | Disease Stage | Description | Gene Ratio | Bg Ratio | pvalue | p.adjust | qvalue | Count |
| Page: 1 |
Top |
Cell-cell communication analysis |
| Identification of potential cell-cell interactions between two cell types and their ligand-receptor pairs for different disease states |
| Ligand | Receptor | LRpair | Pathway | Tissue | Disease Stage |
| Page: 1 |
Top |
Single-cell gene regulatory network inference analysis |
| Find out the significant the regulons (TFs) and the target genes of each regulon across cell types for different disease states |
| TF | Cell Type | Tissue | Disease Stage | Target Gene | RSS | Regulon Activity |
| ∗The dot plots of a searched regulon are shown for all cell subpopulations in each disease state of each tissue based on the regulon specific score inferred using pySCENIC and by calculating the average expression. |
| Page: 1 |
Top |
Somatic mutation of malignant transformation related genes |
| Annotation of somatic variants for genes involved in malignant transformation |
| Hugo Symbol | Variant Class | Variant Classification | dbSNP RS | HGVSc | HGVSp | HGVSp Short | SWISSPROT | BIOTYPE | SIFT | PolyPhen | Tumor Sample Barcode | Tissue | Histology | Sex | Age | Stage | Therapy Types | Drugs | Outcome |
| COL18A1 | SNV | Missense_Mutation | novel | c.5002N>T | p.Gly1668Trp | p.G1668W | P39060 | protein_coding | deleterious(0) | probably_damaging(1) | TCGA-A7-A0DB-01 | Breast | breast invasive carcinoma | Female | <65 | I/II | Hormone Therapy | arimidex | SD |
| COL18A1 | SNV | Missense_Mutation | c.1509C>G | p.Phe503Leu | p.F503L | P39060 | protein_coding | deleterious(0.02) | possibly_damaging(0.526) | TCGA-AC-A23H-01 | Breast | breast invasive carcinoma | Female | >=65 | I/II | Unknown | Unknown | PD | |
| COL18A1 | SNV | Missense_Mutation | c.2490N>T | p.Lys830Asn | p.K830N | P39060 | protein_coding | deleterious(0.02) | possibly_damaging(0.741) | TCGA-AO-A0J3-01 | Breast | breast invasive carcinoma | Female | >=65 | I/II | Chemotherapy | cyclophosphamide | SD | |
| COL18A1 | SNV | Missense_Mutation | rs576719084 | c.3919N>A | p.Gly1307Arg | p.G1307R | P39060 | protein_coding | deleterious(0.02) | probably_damaging(1) | TCGA-B6-A0RL-01 | Breast | breast invasive carcinoma | Female | <65 | I/II | Unknown | Unknown | SD |
| COL18A1 | SNV | Missense_Mutation | c.17N>A | p.Cys6Tyr | p.C6Y | P39060 | protein_coding | deleterious_low_confidence(0.04) | benign(0.018) | TCGA-BH-A1EY-01 | Breast | breast invasive carcinoma | Female | >=65 | I/II | Unknown | Unknown | PD | |
| COL18A1 | SNV | Missense_Mutation | rs551388856 | c.2224N>T | p.Arg742Trp | p.R742W | P39060 | protein_coding | tolerated(0.1) | benign(0) | TCGA-E2-A14R-01 | Breast | breast invasive carcinoma | Female | <65 | I/II | Chemotherapy | doxorubicin | PD |
| COL18A1 | insertion | Frame_Shift_Ins | novel | c.1600_1601insCCCAGGATGGGATTTTGGGGATGAGA | p.Val534AlafsTer14 | p.V534Afs*14 | P39060 | protein_coding | TCGA-A2-A0CT-01 | Breast | breast invasive carcinoma | Female | >=65 | I/II | Chemotherapy | cytoxan | SD | ||
| COL18A1 | insertion | Frame_Shift_Ins | novel | c.2626_2627insCGGTGAGTCTGCTTTTCTTTCTGACCCCTGTG | p.Phe876SerfsTer17 | p.F876Sfs*17 | P39060 | protein_coding | TCGA-AR-A0TY-01 | Breast | breast invasive carcinoma | Female | <65 | I/II | Unspecific | Paclitaxel | PD | ||
| COL18A1 | deletion | Frame_Shift_Del | c.3151_3163delGGCCTGCCGGGAC | p.Gly1051LeufsTer84 | p.G1051Lfs*84 | P39060 | protein_coding | TCGA-E2-A1LH-01 | Breast | breast invasive carcinoma | Female | <65 | I/II | Chemotherapy | adriamycin | SD | |||
| COL18A1 | deletion | Frame_Shift_Del | novel | c.4349delN | p.Thr1450AsnfsTer216 | p.T1450Nfs*216 | P39060 | protein_coding | TCGA-EW-A2FV-01 | Breast | breast invasive carcinoma | Female | <65 | III/IV | Chemotherapy | docetaxel | SD |
| Page: 1 2 3 4 5 6 7 8 9 10 11 12 13 |
Top |
Related drugs of malignant transformation related genes |
| Identification of chemicals and drugs interact with genes involved in malignant transfromation |
| (DGIdb 4.0) |
| Entrez ID | Symbol | Category | Interaction Types | Drug Claim Name | Drug Name | PMIDs |
| 80781 | COL18A1 | DRUGGABLE GENOME | CSF | 14693162 | ||
| 80781 | COL18A1 | DRUGGABLE GENOME | GLUTAMINE | GLUTAMINE | 16572858 | |
| 80781 | COL18A1 | DRUGGABLE GENOME | ASPIRIN | ASPIRIN | 11353854 | |
| 80781 | COL18A1 | DRUGGABLE GENOME | TAMOXIFEN | TAMOXIFEN | 16651433 | |
| 80781 | COL18A1 | DRUGGABLE GENOME | CHEMBL2095222 | OCRIPLASMIN | ||
| 80781 | COL18A1 | DRUGGABLE GENOME | VITAMIN E | 12792883 | ||
| 80781 | COL18A1 | DRUGGABLE GENOME | H2O2 | 12832291 | ||
| 80781 | COL18A1 | DRUGGABLE GENOME | RED CELLS | 15181823 | ||
| 80781 | COL18A1 | DRUGGABLE GENOME | THROMBIN | THROMBIN | 15615851 | |
| 80781 | COL18A1 | DRUGGABLE GENOME | CAMPTOTHECIN | CAMPTOTHECIN | 15069724 |
| Page: 1 2 |

Copyright 2023-Present -The University of Texas Health Science Center at Houston |