
|
|||||
|
 | |
| |
| |
| |
| |
| |
|
Gene: COL17A1 |
Gene summary for COL17A1 |
| Gene information | Species | Human | Gene symbol | COL17A1 | Gene ID | 1308 |
| Gene name | collagen type XVII alpha 1 chain | |
| Gene Alias | BA16H23.2 | |
| Cytomap | 10q25.1 | |
| Gene Type | protein-coding | GO ID | GO:0007044 | UniProtAcc | Q9UMD9 |
Top |
Malignant transformation analysis |
| Identification of the aberrant gene expression in precancerous and cancerous lesions by comparing the gene expression of stem-like cells in diseased tissues with normal stem cells |
| Entrez ID | Symbol | Replicates | Species | Organ | Tissue | Adj P-value | Log2FC | Malignancy |
| 1308 | COL17A1 | CA_HPV_1 | Human | Cervix | CC | 1.15e-02 | -2.72e-01 | 0.0264 |
| 1308 | COL17A1 | CA_HPV_3 | Human | Cervix | CC | 5.66e-32 | 8.65e-01 | 0.0414 |
| 1308 | COL17A1 | HSIL_HPV_1 | Human | Cervix | HSIL_HPV | 4.60e-02 | -2.39e-01 | 0.0116 |
| 1308 | COL17A1 | Tumor | Human | Cervix | CC | 2.21e-02 | -1.39e-01 | 0.1241 |
| 1308 | COL17A1 | sample1 | Human | Cervix | CC | 1.55e-05 | 3.06e-01 | 0.0959 |
| 1308 | COL17A1 | H2 | Human | Cervix | HSIL_HPV | 2.44e-05 | -2.75e-01 | 0.0632 |
| 1308 | COL17A1 | L1 | Human | Cervix | CC | 4.27e-04 | -2.80e-01 | 0.0802 |
| 1308 | COL17A1 | T1 | Human | Cervix | CC | 2.41e-04 | 2.94e-01 | 0.0918 |
| 1308 | COL17A1 | HTA11_2487_2000001011 | Human | Colorectum | SER | 5.69e-09 | 6.91e-01 | -0.1808 |
| 1308 | COL17A1 | HTA11_1938_2000001011 | Human | Colorectum | AD | 6.92e-20 | 9.31e-01 | -0.0811 |
| 1308 | COL17A1 | HTA11_78_2000001011 | Human | Colorectum | AD | 2.76e-11 | 6.58e-01 | -0.1088 |
| 1308 | COL17A1 | HTA11_347_2000001011 | Human | Colorectum | AD | 2.52e-13 | 5.34e-01 | -0.1954 |
| 1308 | COL17A1 | HTA11_411_2000001011 | Human | Colorectum | SER | 1.49e-04 | 1.17e+00 | -0.2602 |
| 1308 | COL17A1 | HTA11_2112_2000001011 | Human | Colorectum | SER | 2.65e-02 | 4.58e-01 | -0.2196 |
| 1308 | COL17A1 | HTA11_83_2000001011 | Human | Colorectum | SER | 4.64e-02 | 4.05e-01 | -0.1526 |
| 1308 | COL17A1 | HTA11_696_2000001011 | Human | Colorectum | AD | 2.35e-08 | 3.87e-01 | -0.1464 |
| 1308 | COL17A1 | HTA11_1391_2000001011 | Human | Colorectum | AD | 1.17e-11 | 6.27e-01 | -0.059 |
| 1308 | COL17A1 | HTA11_6818_2000001021 | Human | Colorectum | AD | 9.91e-05 | 4.01e-01 | 0.0588 |
| 1308 | COL17A1 | HTA11_99999970781_79442 | Human | Colorectum | MSS | 5.60e-06 | 1.30e-01 | 0.294 |
| 1308 | COL17A1 | HTA11_99999971662_82457 | Human | Colorectum | MSS | 1.11e-06 | 2.44e-01 | 0.3859 |
| Page: 1 2 3 4 5 6 7 |
| Tissue | Expression Dynamics | Abbreviation |
| Cervix | 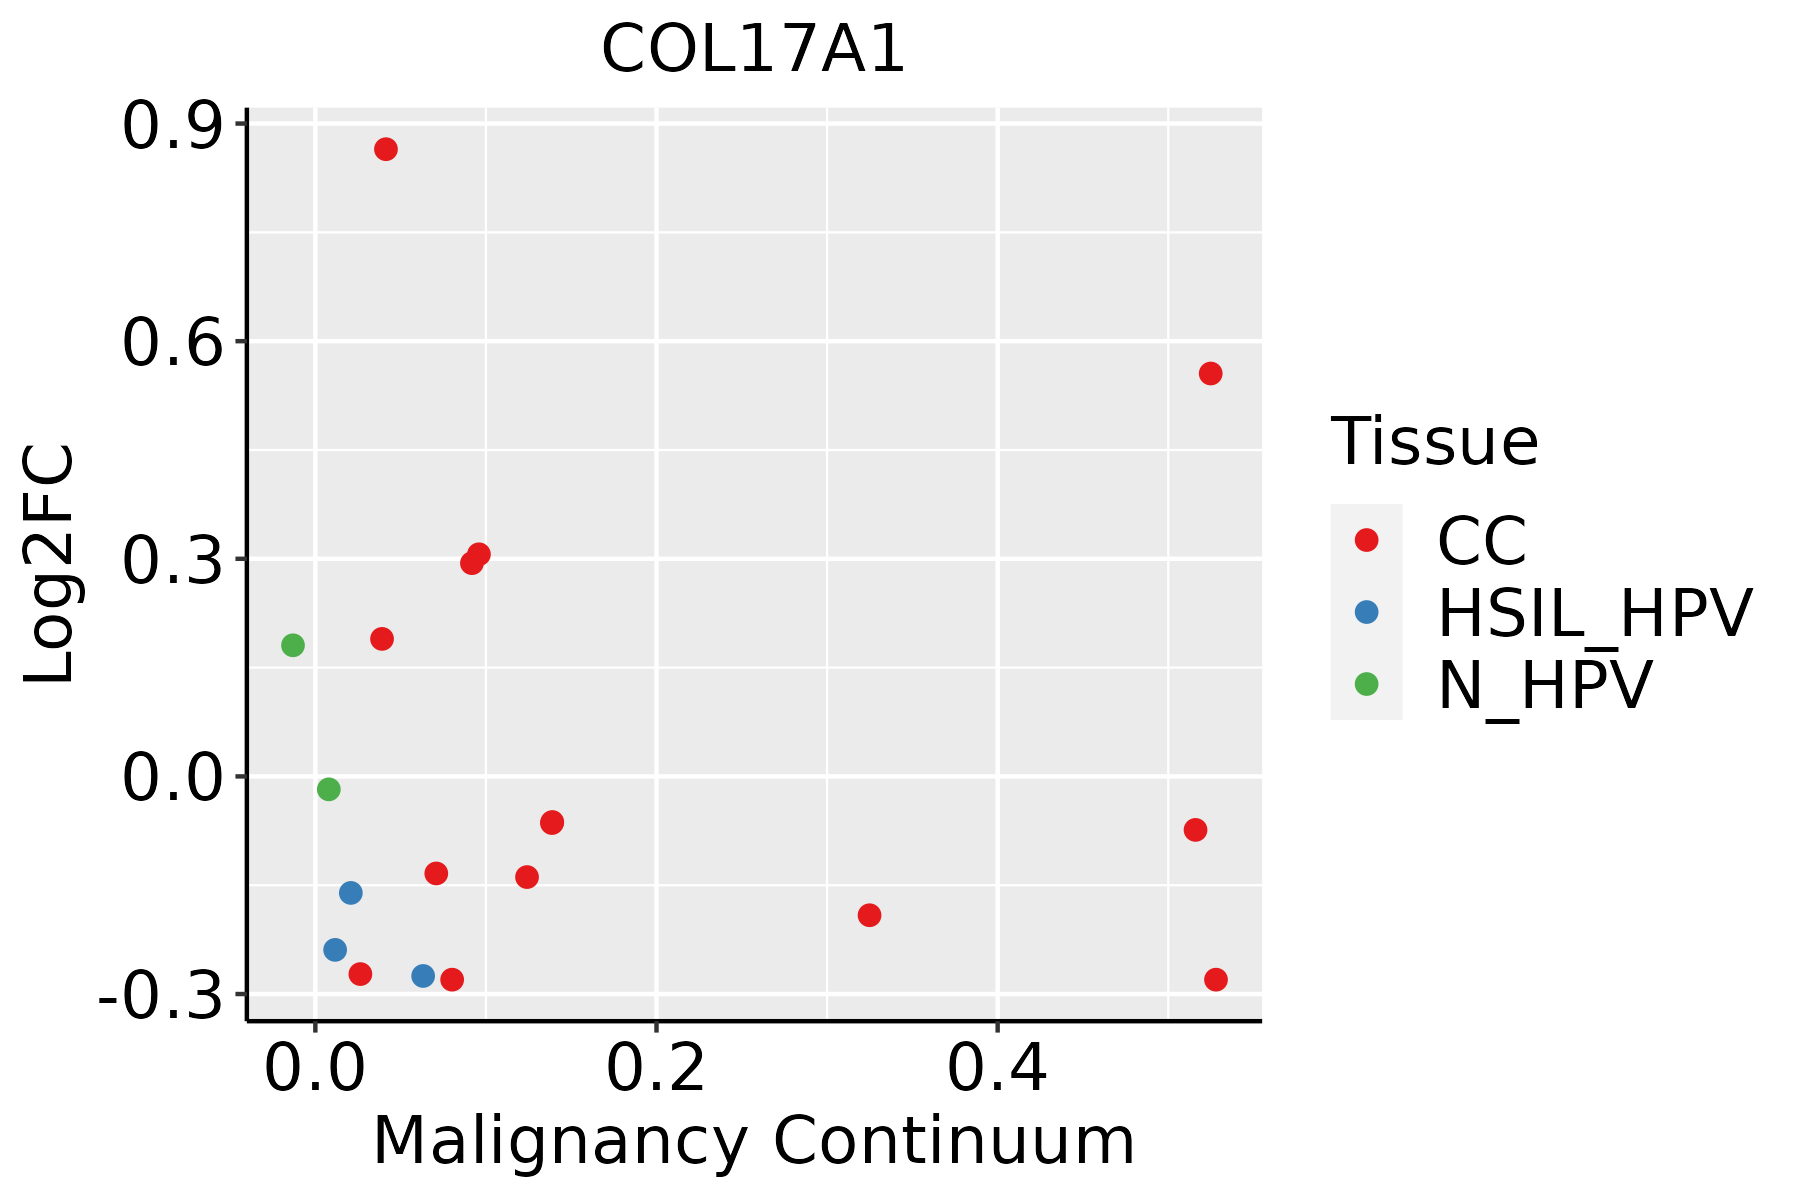 | CC: Cervix cancer |
| HSIL_HPV: HPV-infected high-grade squamous intraepithelial lesions | ||
| N_HPV: HPV-infected normal cervix | ||
| Colorectum (GSE201348) |  | FAP: Familial adenomatous polyposis |
| CRC: Colorectal cancer | ||
| Colorectum (HTA11) |  | AD: Adenomas |
| SER: Sessile serrated lesions | ||
| MSI-H: Microsatellite-high colorectal cancer | ||
| MSS: Microsatellite stable colorectal cancer | ||
| Esophagus | 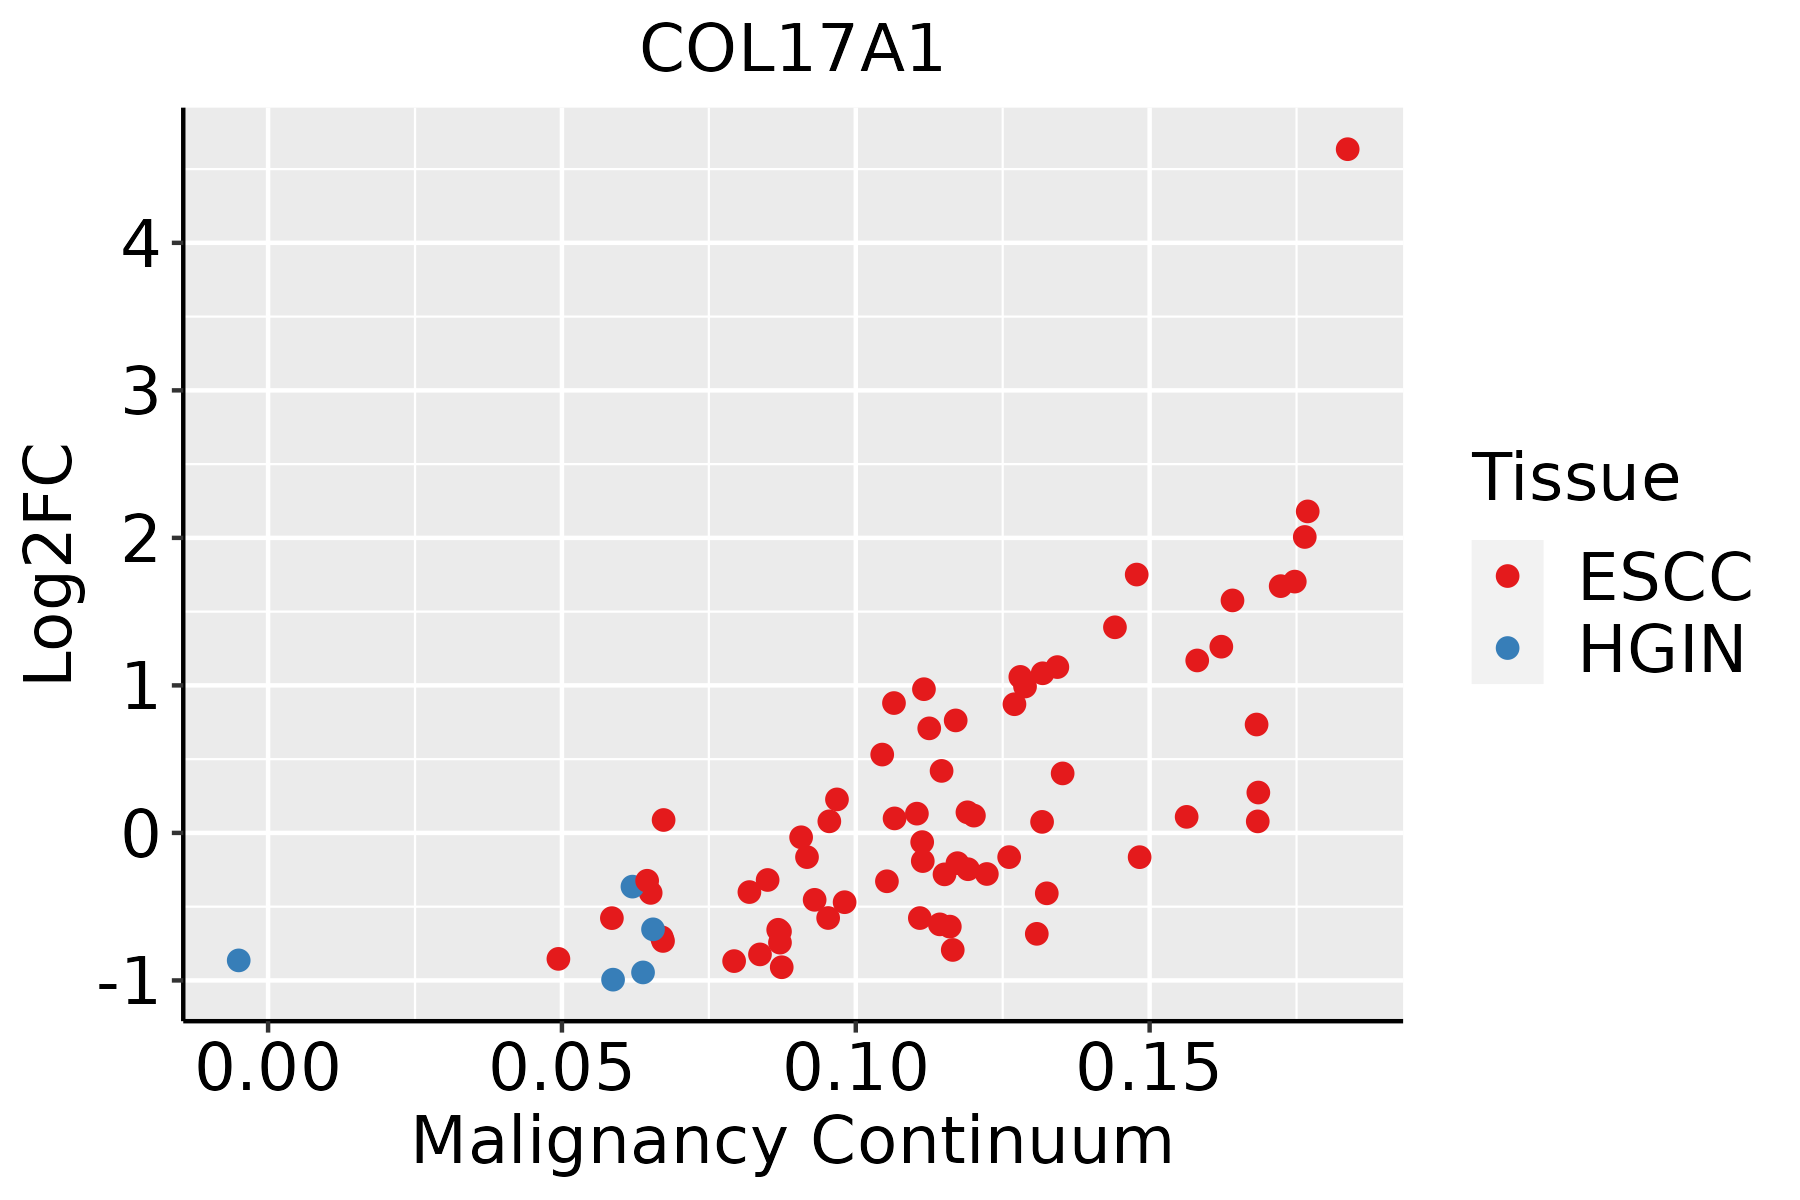 | ESCC: Esophageal squamous cell carcinoma |
| HGIN: High-grade intraepithelial neoplasias | ||
| LGIN: Low-grade intraepithelial neoplasias | ||
| Oral Cavity |  | EOLP: Erosive Oral lichen planus |
| LP: leukoplakia | ||
| NEOLP: Non-erosive oral lichen planus | ||
| OSCC: Oral squamous cell carcinoma | ||
| Prostate | 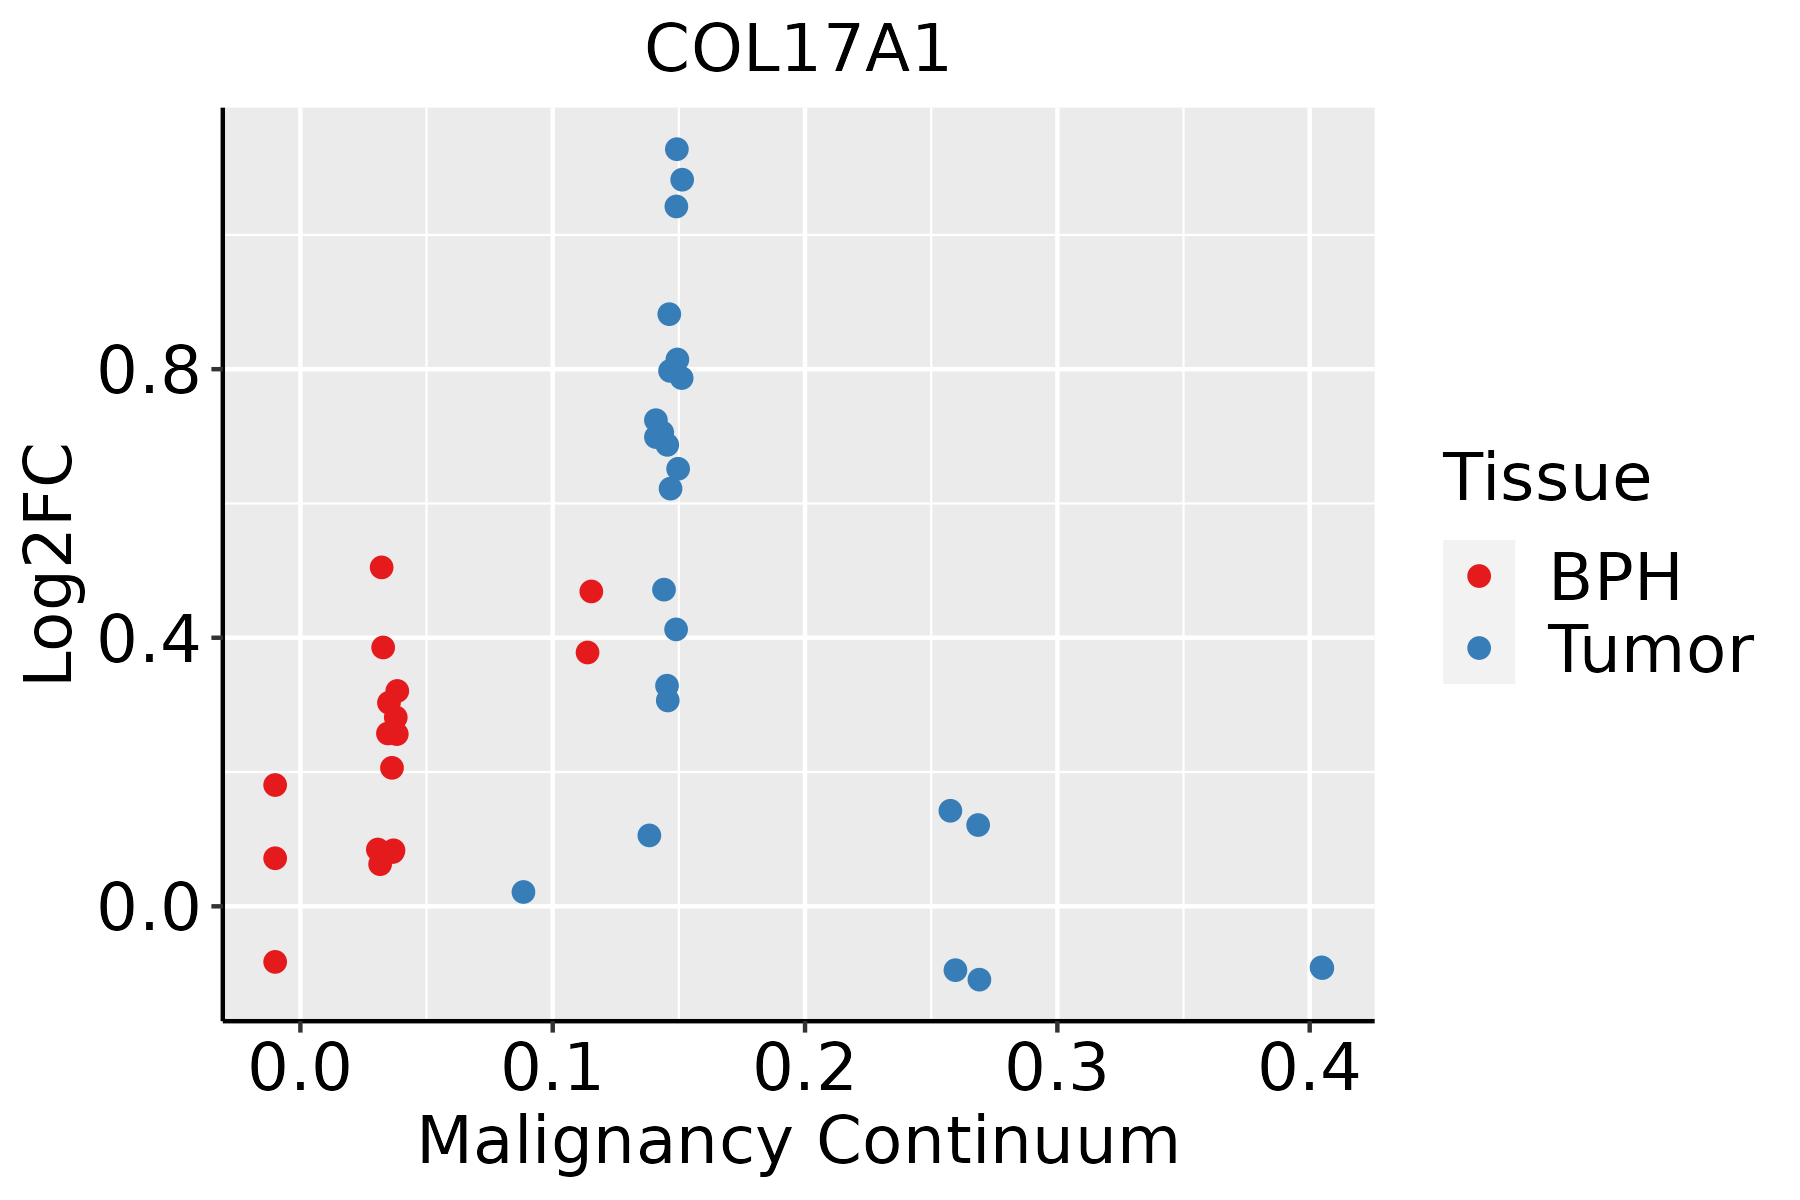 | BPH: Benign Prostatic Hyperplasia |
| Skin | 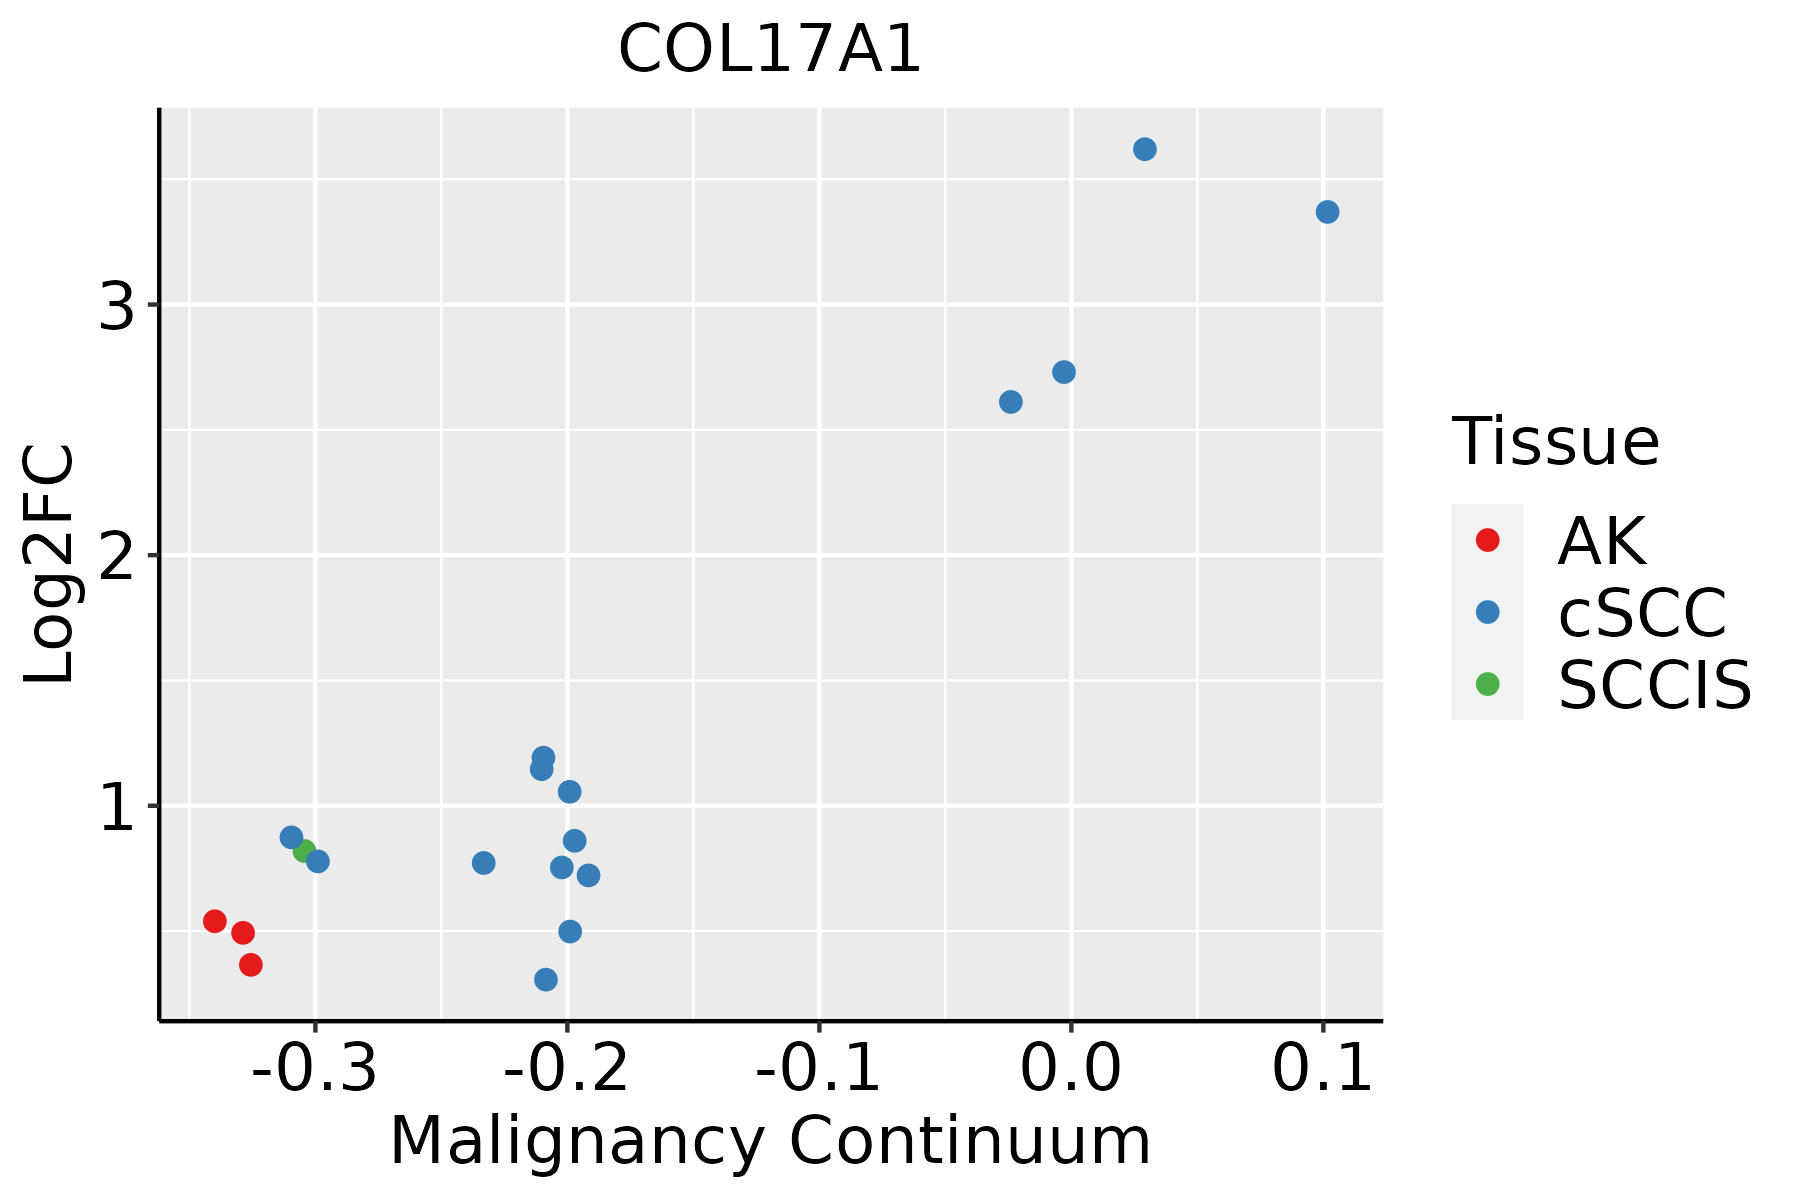 | AK: Actinic keratosis |
| cSCC: Cutaneous squamous cell carcinoma | ||
| SCCIS:squamous cell carcinoma in situ |
| ∗log2FC in expression of this searched gene in stem-like cells from each diseased tissue sample relative to stem-like cells in normal samples in each tissue plotted against the malignancy continuum. Samples are colored based on if they are from different disease stage. |
Top |
Malignant transformation related pathway analysis |
| Find out the enriched GO biological processes and KEGG pathways involved in transition from healthy to precancer to cancer |
| Tissue | Disease Stage | Enriched GO biological Processes |
| Colorectum | AD |  |
| Colorectum | SER |  |
| Colorectum | MSS |  |
| Colorectum | MSI-H |  |
| Colorectum | FAP |  |
| ∗Top 15 enriched GO BP terms are showed in the bar plot of each disease state in each tissue. Each row represents a significant GO biological process which is colored according to the -log10(p.adjust). |
| Page: 1 2 3 4 5 6 7 8 9 |
| GO ID | Tissue | Disease Stage | Description | Gene Ratio | Bg Ratio | pvalue | p.adjust | Count |
| GO:00315898 | Cervix | CC | cell-substrate adhesion | 96/2311 | 363/18723 | 1.48e-13 | 8.85e-11 | 96 |
| GO:00085446 | Cervix | CC | epidermis development | 83/2311 | 324/18723 | 3.91e-11 | 8.54e-09 | 83 |
| GO:01501159 | Cervix | CC | cell-substrate junction organization | 37/2311 | 101/18723 | 3.20e-10 | 4.46e-08 | 37 |
| GO:00070448 | Cervix | CC | cell-substrate junction assembly | 34/2311 | 95/18723 | 3.35e-09 | 3.45e-07 | 34 |
| GO:00071608 | Cervix | CC | cell-matrix adhesion | 60/2311 | 233/18723 | 1.58e-08 | 1.23e-06 | 60 |
| GO:00343298 | Cervix | CC | cell junction assembly | 88/2311 | 420/18723 | 3.42e-07 | 1.38e-05 | 88 |
| GO:0030198 | Cervix | CC | extracellular matrix organization | 52/2311 | 301/18723 | 7.43e-03 | 3.98e-02 | 52 |
| GO:0043062 | Cervix | CC | extracellular structure organization | 52/2311 | 302/18723 | 7.92e-03 | 4.17e-02 | 52 |
| GO:0045229 | Cervix | CC | external encapsulating structure organization | 52/2311 | 304/18723 | 9.00e-03 | 4.57e-02 | 52 |
| GO:000854413 | Cervix | HSIL_HPV | epidermis development | 38/737 | 324/18723 | 1.92e-09 | 3.23e-07 | 38 |
| GO:003158914 | Cervix | HSIL_HPV | cell-substrate adhesion | 30/737 | 363/18723 | 1.12e-04 | 2.34e-03 | 30 |
| GO:003432913 | Cervix | HSIL_HPV | cell junction assembly | 28/737 | 420/18723 | 4.82e-03 | 3.98e-02 | 28 |
| GO:0034329 | Colorectum | AD | cell junction assembly | 136/3918 | 420/18723 | 2.02e-08 | 1.15e-06 | 136 |
| GO:0150115 | Colorectum | AD | cell-substrate junction organization | 44/3918 | 101/18723 | 2.38e-07 | 9.81e-06 | 44 |
| GO:0031589 | Colorectum | AD | cell-substrate adhesion | 116/3918 | 363/18723 | 4.68e-07 | 1.76e-05 | 116 |
| GO:0007044 | Colorectum | AD | cell-substrate junction assembly | 41/3918 | 95/18723 | 8.20e-07 | 2.85e-05 | 41 |
| GO:0007160 | Colorectum | AD | cell-matrix adhesion | 75/3918 | 233/18723 | 3.56e-05 | 6.45e-04 | 75 |
| GO:0008544 | Colorectum | AD | epidermis development | 87/3918 | 324/18723 | 5.99e-03 | 3.76e-02 | 87 |
| GO:00343291 | Colorectum | SER | cell junction assembly | 100/2897 | 420/18723 | 4.23e-06 | 1.61e-04 | 100 |
| GO:01501151 | Colorectum | SER | cell-substrate junction organization | 34/2897 | 101/18723 | 4.46e-06 | 1.67e-04 | 34 |
| Page: 1 2 3 4 5 6 |
| Pathway ID | Tissue | Disease Stage | Description | Gene Ratio | Bg Ratio | pvalue | p.adjust | qvalue | Count |
| Page: 1 |
Top |
Cell-cell communication analysis |
| Identification of potential cell-cell interactions between two cell types and their ligand-receptor pairs for different disease states |
| Ligand | Receptor | LRpair | Pathway | Tissue | Disease Stage |
| Page: 1 |
Top |
Single-cell gene regulatory network inference analysis |
| Find out the significant the regulons (TFs) and the target genes of each regulon across cell types for different disease states |
| TF | Cell Type | Tissue | Disease Stage | Target Gene | RSS | Regulon Activity |
| ∗The dot plots of a searched regulon are shown for all cell subpopulations in each disease state of each tissue based on the regulon specific score inferred using pySCENIC and by calculating the average expression. |
| Page: 1 |
Top |
Somatic mutation of malignant transformation related genes |
| Annotation of somatic variants for genes involved in malignant transformation |
| Hugo Symbol | Variant Class | Variant Classification | dbSNP RS | HGVSc | HGVSp | HGVSp Short | SWISSPROT | BIOTYPE | SIFT | PolyPhen | Tumor Sample Barcode | Tissue | Histology | Sex | Age | Stage | Therapy Types | Drugs | Outcome |
| COL17A1 | SNV | Missense_Mutation | novel | c.3119N>A | p.Pro1040Gln | p.P1040Q | Q9UMD9 | protein_coding | deleterious(0.03) | probably_damaging(0.997) | TCGA-A7-A4SF-01 | Breast | breast invasive carcinoma | Female | <65 | I/II | Chemotherapy | carboplatin | CR |
| COL17A1 | SNV | Missense_Mutation | c.3191N>C | p.Val1064Ala | p.V1064A | Q9UMD9 | protein_coding | tolerated(0.06) | probably_damaging(0.978) | TCGA-A8-A09Z-01 | Breast | breast invasive carcinoma | Female | >=65 | I/II | Unknown | Unknown | SD | |
| COL17A1 | SNV | Missense_Mutation | novel | c.1089N>T | p.Met363Ile | p.M363I | Q9UMD9 | protein_coding | deleterious(0.01) | possibly_damaging(0.462) | TCGA-AC-A4ZE-01 | Breast | breast invasive carcinoma | Female | <65 | I/II | Unknown | Unknown | SD |
| COL17A1 | SNV | Missense_Mutation | c.3027N>A | p.Ser1009Arg | p.S1009R | Q9UMD9 | protein_coding | tolerated(0.08) | benign(0.172) | TCGA-AN-A0XN-01 | Breast | breast invasive carcinoma | Female | >=65 | III/IV | Unknown | Unknown | SD | |
| COL17A1 | SNV | Missense_Mutation | c.4426N>C | p.Lys1476Gln | p.K1476Q | Q9UMD9 | protein_coding | deleterious_low_confidence(0) | possibly_damaging(0.783) | TCGA-AR-A0U0-01 | Breast | breast invasive carcinoma | Female | >=65 | I/II | Unknown | Unknown | SD | |
| COL17A1 | SNV | Missense_Mutation | novel | c.3328C>A | p.Pro1110Thr | p.P1110T | Q9UMD9 | protein_coding | tolerated(0.07) | possibly_damaging(0.521) | TCGA-BH-A0B7-01 | Breast | breast invasive carcinoma | Female | <65 | I/II | Chemotherapy | adriamycin | CR |
| COL17A1 | SNV | Missense_Mutation | rs529850690 | c.317G>A | p.Arg106His | p.R106H | Q9UMD9 | protein_coding | deleterious(0.04) | benign(0.028) | TCGA-BH-A0HK-01 | Breast | breast invasive carcinoma | Female | >=65 | I/II | Hormone Therapy | arimidex | SD |
| COL17A1 | SNV | Missense_Mutation | novel | c.295G>C | p.Glu99Gln | p.E99Q | Q9UMD9 | protein_coding | deleterious(0.02) | possibly_damaging(0.863) | TCGA-BH-A2L8-01 | Breast | breast invasive carcinoma | Female | <65 | I/II | Chemotherapy | cytoxan | CR |
| COL17A1 | SNV | Missense_Mutation | c.1860N>T | p.Met620Ile | p.M620I | Q9UMD9 | protein_coding | tolerated(0.59) | benign(0.005) | TCGA-C8-A274-01 | Breast | breast invasive carcinoma | Female | <65 | I/II | Hormone Therapy | tamoxiphen | SD | |
| COL17A1 | SNV | Missense_Mutation | novel | c.3944N>A | p.Gly1315Glu | p.G1315E | Q9UMD9 | protein_coding | deleterious_low_confidence(0.01) | benign(0.381) | TCGA-D8-A73U-01 | Breast | breast invasive carcinoma | Female | >=65 | I/II | Hormone Therapy | tamoxiphen | SD |
| Page: 1 2 3 4 5 6 7 8 9 10 11 12 13 14 |
Top |
Related drugs of malignant transformation related genes |
| Identification of chemicals and drugs interact with genes involved in malignant transfromation |
| (DGIdb 4.0) |
| Entrez ID | Symbol | Category | Interaction Types | Drug Claim Name | Drug Name | PMIDs |
| Page: 1 |

Copyright 2023-Present -The University of Texas Health Science Center at Houston |