Schematic overview of the cellular and molecular mechanisms involved in the cancer progression, including the proposed cellular and molecular mechanisms in cancer cells trajectory. AT1: alveolar type 1 cells; AT2: alveolar type 2 cells; AAH: atypical adenomatous hyperplasia; AIS: adenocarcinoma in situ; MIA: minimally invasive adenocarcinoma; IA: invasive adenocarcinoma; EMT: epithelial-mesenchymal transition

Home

Download

Statistics

Help

Contact

Center for Computational Systems Medicine
leaf

Gene summary

leaf

Malignant transformation analysis

leaf

Malignant transformation related pathway analysis

leaf

Cell-cell communication analysis

leaf

Single-cell gene regulatory network inference analysis

leaf

Somatic mutation of malignant transformation related genes

leaf

Related drugs of malignant transformation related genes

Gene: COL16A1

Gene summary for COL16A1

check button Gene summary.

Gene informationSpeciesHuman
Gene symbol

COL16A1

Gene ID

1307

Gene namecollagen type XVI alpha 1 chain
Gene Alias447AA
Cytomap1p35.2
Gene Typeprotein-coding
GO ID

GO:0000003

UniProtAcc

Q07092


Top

Malignant transformation analysis

check button Identification of the aberrant gene expression in precancerous and cancerous lesions by comparing the gene expression of stem-like cells in diseased tissues with normal stem cells
check button Malignant transformation involving gene list.
Entrez IDSymbolReplicatesSpeciesOrganTissueAdj P-valueLog2FCMalignancy
1307COL16A1LZE24THumanEsophagusESCC8.53e-132.25e-010.0596
1307COL16A1P2T-EHumanEsophagusESCC2.14e-254.78e-010.1177
1307COL16A1P4T-EHumanEsophagusESCC6.23e-071.63e-010.1323
1307COL16A1P5T-EHumanEsophagusESCC2.59e-041.18e-010.1327
1307COL16A1P8T-EHumanEsophagusESCC1.15e-091.84e-010.0889
1307COL16A1P10T-EHumanEsophagusESCC5.86e-336.80e-010.116
1307COL16A1P11T-EHumanEsophagusESCC2.94e-085.57e-010.1426
1307COL16A1P12T-EHumanEsophagusESCC5.19e-121.97e-010.1122
1307COL16A1P15T-EHumanEsophagusESCC2.07e-031.69e-010.1149
1307COL16A1P16T-EHumanEsophagusESCC6.64e-077.32e-020.1153
1307COL16A1P19T-EHumanEsophagusESCC3.89e-042.41e-010.1662
1307COL16A1P20T-EHumanEsophagusESCC3.09e-133.18e-010.1124
1307COL16A1P21T-EHumanEsophagusESCC8.47e-193.47e-010.1617
1307COL16A1P22T-EHumanEsophagusESCC2.18e-081.53e-010.1236
1307COL16A1P23T-EHumanEsophagusESCC2.00e-031.97e-010.108
1307COL16A1P24T-EHumanEsophagusESCC9.52e-039.32e-020.1287
1307COL16A1P26T-EHumanEsophagusESCC6.59e-081.57e-010.1276
1307COL16A1P27T-EHumanEsophagusESCC1.03e-101.90e-010.1055
1307COL16A1P28T-EHumanEsophagusESCC5.29e-081.47e-010.1149
1307COL16A1P31T-EHumanEsophagusESCC5.64e-142.14e-010.1251
Page: 1 2 3 4 

check button Transcriptomic changes along malignancy continuum.
TissueExpression DynamicsAbbreviation
EsophagusThe image shows the transcriptomic changes along malignancy continuum.log2FC in expression of this searched gene in stem-like cells from each diseased tissue sample relative to stem-like cells in normal samples in each tissue plotted against the malignancy continuum. Samples are colored based on if they are from different disease stage.ESCC: Esophageal squamous cell carcinoma
HGIN: High-grade intraepithelial neoplasias
LGIN: Low-grade intraepithelial neoplasias
LiverThe image shows the transcriptomic changes along malignancy continuum.log2FC in expression of this searched gene in stem-like cells from each diseased tissue sample relative to stem-like cells in normal samples in each tissue plotted against the malignancy continuum. Samples are colored based on if they are from different disease stage.HCC: Hepatocellular carcinoma
NAFLD: Non-alcoholic fatty liver disease
Oral CavityThe image shows the transcriptomic changes along malignancy continuum.log2FC in expression of this searched gene in stem-like cells from each diseased tissue sample relative to stem-like cells in normal samples in each tissue plotted against the malignancy continuum. Samples are colored based on if they are from different disease stage.
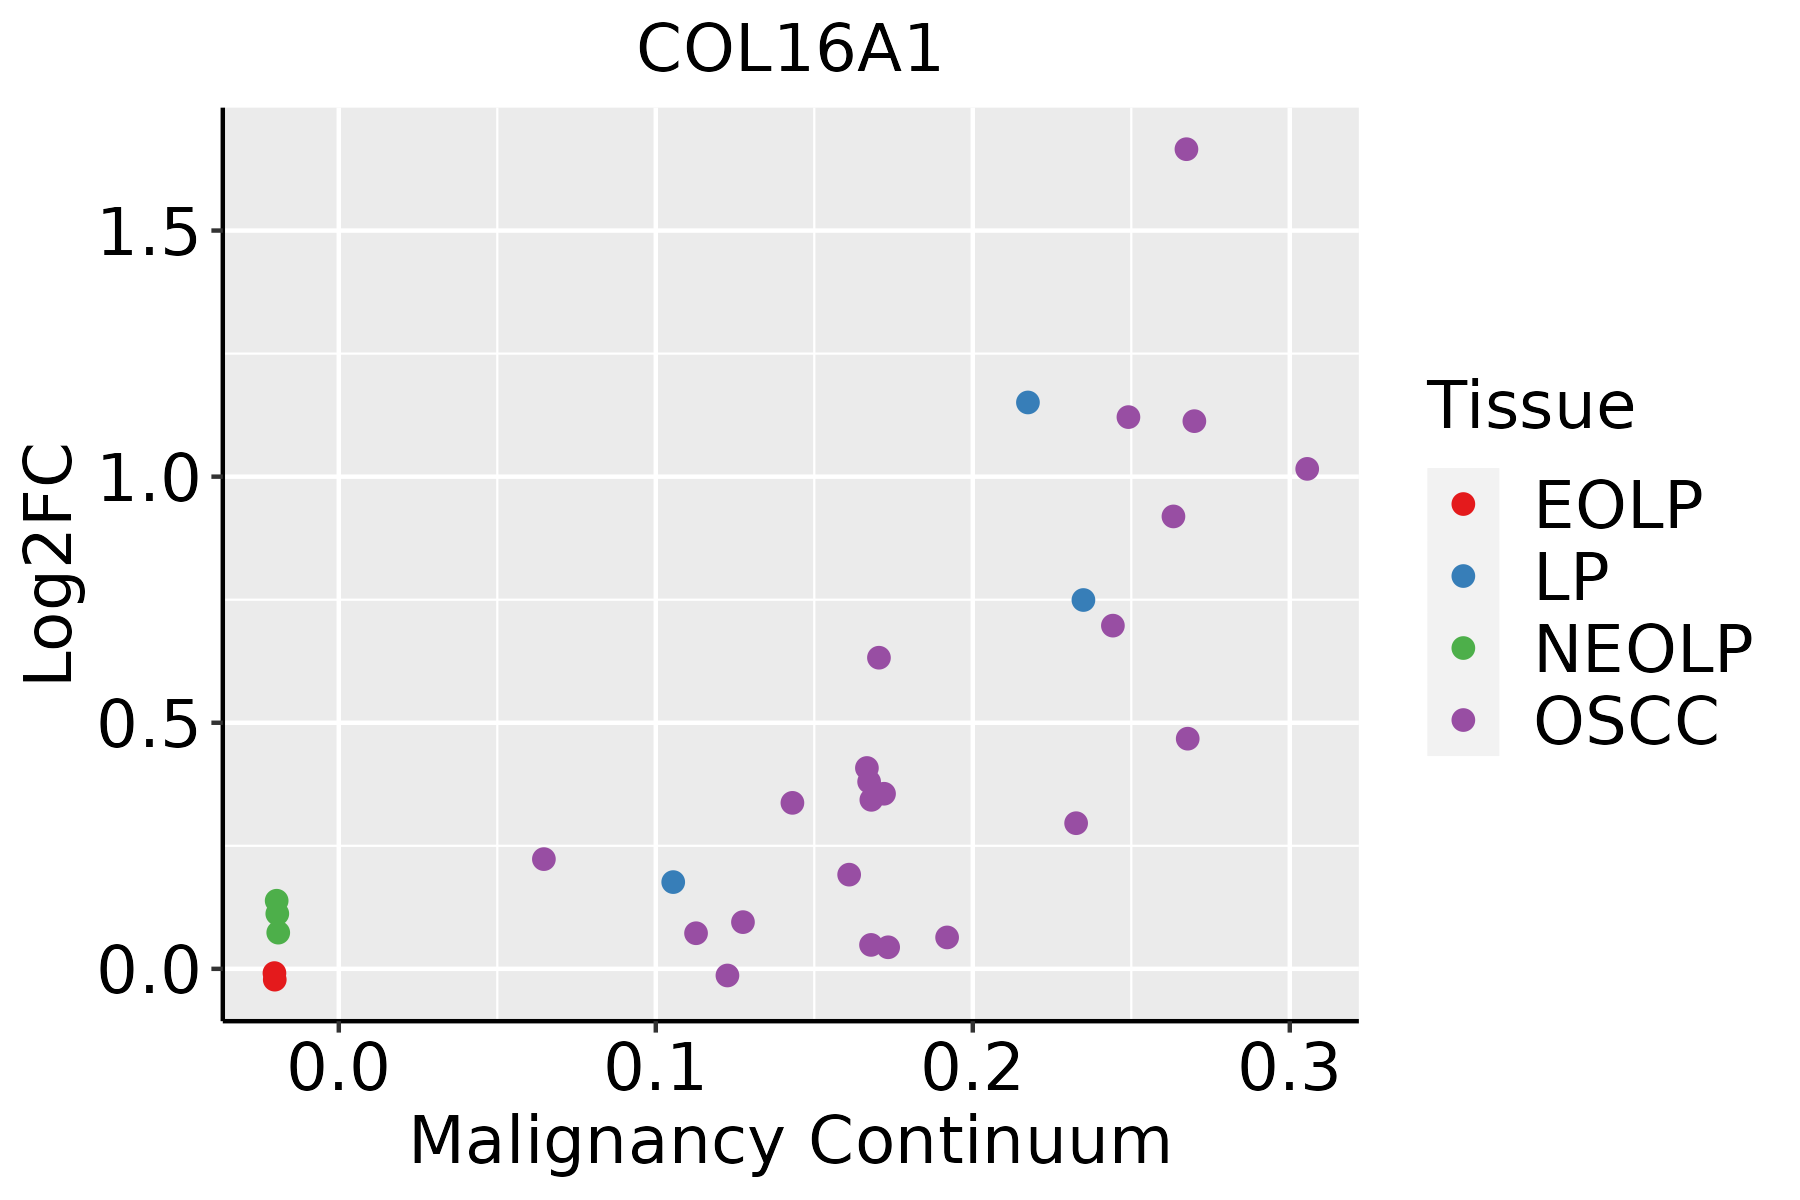
EOLP: Erosive Oral lichen planus
LP: leukoplakia
NEOLP: Non-erosive oral lichen planus
OSCC: Oral squamous cell carcinoma
ThyroidThe image shows the transcriptomic changes along malignancy continuum.log2FC in expression of this searched gene in stem-like cells from each diseased tissue sample relative to stem-like cells in normal samples in each tissue plotted against the malignancy continuum. Samples are colored based on if they are from different disease stage.
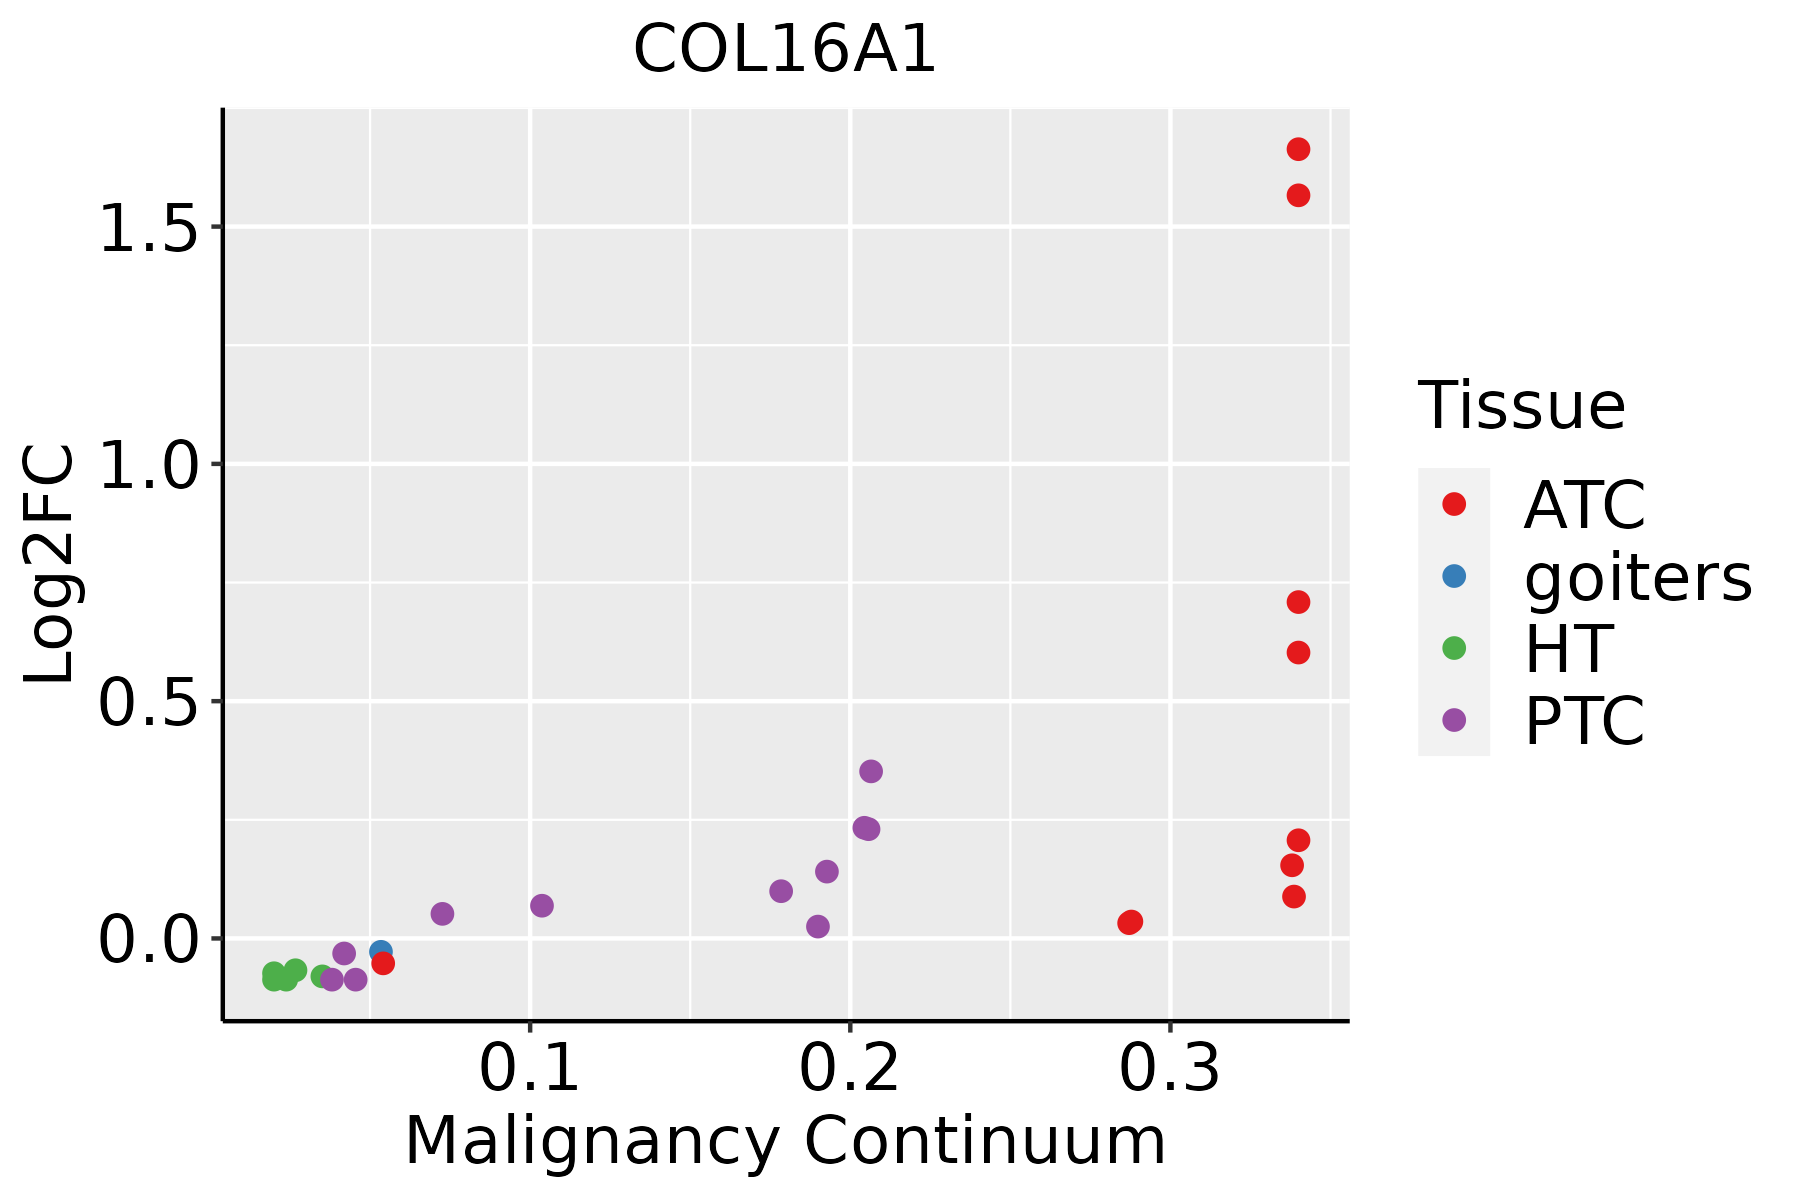
ATC: Anaplastic thyroid cancer
HT: Hashimoto's thyroiditis
PTC: Papillary thyroid cancer
∗log2FC in expression of this searched gene in stem-like cells from each diseased tissue sample relative to stem-like cells in normal samples in each tissue plotted against the malignancy continuum. Samples are colored based on if they are from different disease stage.

Top

Malignant transformation related pathway analysis

check buttonFind out the enriched GO biological processes and KEGG pathways involved in transition from healthy to precancer to cancer
check button Figure of enriched GO biological processes.
TissueDisease StageEnriched GO biological Processes
ColorectumADGO analysis - Figure of enriched GO biological processes: Top 15 enriched GO BP terms are showed in the bar plot of each disease state in each tissue. Each row represents a significant GO biological process which is colored according to the -log10(p.adjust).
ColorectumSERGO analysis - Figure of enriched GO biological processes: Top 15 enriched GO BP terms are showed in the bar plot of each disease state in each tissue. Each row represents a significant GO biological process which is colored according to the -log10(p.adjust).
ColorectumMSSGO analysis - Figure of enriched GO biological processes: Top 15 enriched GO BP terms are showed in the bar plot of each disease state in each tissue. Each row represents a significant GO biological process which is colored according to the -log10(p.adjust).
ColorectumMSI-HGO analysis - Figure of enriched GO biological processes: Top 15 enriched GO BP terms are showed in the bar plot of each disease state in each tissue. Each row represents a significant GO biological process which is colored according to the -log10(p.adjust).
ColorectumFAPGO analysis - Figure of enriched GO biological processes: Top 15 enriched GO BP terms are showed in the bar plot of each disease state in each tissue. Each row represents a significant GO biological process which is colored according to the -log10(p.adjust).
∗Top 15 enriched GO BP terms are showed in the bar plot of each disease state in each tissue. Each row represents a significant GO biological process which is colored according to the -log10(p.adjust).
Page: 1 2 3 4 5 6 7 8 9 

check button Enriched GO biological processes.
GO IDTissueDisease StageDescriptionGene RatioBg Ratiopvaluep.adjustCount
GO:0150115110EsophagusESCCcell-substrate junction organization77/8552101/187233.46e-109.57e-0977
GO:000704418EsophagusESCCcell-substrate junction assembly73/855295/187235.27e-101.35e-0873
GO:003158919EsophagusESCCcell-substrate adhesion221/8552363/187233.06e-096.62e-08221
GO:001081020EsophagusESCCregulation of cell-substrate adhesion144/8552221/187233.55e-097.45e-08144
GO:004804116EsophagusESCCfocal adhesion assembly65/855287/187233.28e-086.08e-0765
GO:004578527EsophagusESCCpositive regulation of cell adhesion255/8552437/187235.07e-089.11e-07255
GO:001081126EsophagusESCCpositive regulation of cell-substrate adhesion84/8552123/187233.18e-074.50e-0684
GO:000195217EsophagusESCCregulation of cell-matrix adhesion85/8552128/187231.70e-062.02e-0585
GO:000716018EsophagusESCCcell-matrix adhesion141/8552233/187233.33e-063.71e-05141
GO:015011619EsophagusESCCregulation of cell-substrate junction organization51/855271/187236.99e-067.04e-0551
GO:005189318EsophagusESCCregulation of focal adhesion assembly47/855266/187232.31e-051.98e-0447
GO:009010918EsophagusESCCregulation of cell-substrate junction assembly47/855266/187232.31e-051.98e-0447
GO:00301984EsophagusESCCextracellular matrix organization171/8552301/187236.08e-054.67e-04171
GO:00432007EsophagusESCCresponse to amino acid74/8552116/187236.23e-054.76e-0474
GO:000110110EsophagusESCCresponse to acid chemical84/8552135/187237.70e-055.74e-0484
GO:00430624EsophagusESCCextracellular structure organization171/8552302/187237.73e-055.76e-04171
GO:00452294EsophagusESCCexternal encapsulating structure organization172/8552304/187237.80e-055.80e-04172
GO:00712305EsophagusESCCcellular response to amino acid stimulus48/855271/187231.55e-041.03e-0348
GO:000195418EsophagusESCCpositive regulation of cell-matrix adhesion40/855258/187232.83e-041.71e-0340
GO:00072299EsophagusESCCintegrin-mediated signaling pathway67/8552107/187233.03e-041.81e-0367
Page: 1 2 3 4 5 6 7 

check button Enriched KEGG pathways.
Pathway IDTissueDisease StageDescriptionGene RatioBg Ratiopvaluep.adjustqvalueCount
Page: 1 

Top

Cell-cell communication analysis

check buttonIdentification of potential cell-cell interactions between two cell types and their ligand-receptor pairs for different disease states
LigandReceptorLRpairPathwayTissueDisease Stage
Page: 1 

Top

Single-cell gene regulatory network inference analysis

check buttonFind out the significant the regulons (TFs) and the target genes of each regulon across cell types for different disease states
TFCell TypeTissueDisease StageTarget GeneRSSRegulon Activity
∗The dot plots of a searched regulon are shown for all cell subpopulations in each disease state of each tissue based on the regulon specific score inferred using pySCENIC and by calculating the average expression.
Page: 1 

Top

Somatic mutation of malignant transformation related genes

check buttonAnnotation of somatic variants for genes involved in malignant transformation
Hugo SymbolVariant ClassVariant ClassificationdbSNP RSHGVScHGVSpHGVSp ShortSWISSPROTBIOTYPESIFTPolyPhenTumor Sample BarcodeTissueHistologySexAgeStageTherapy TypesDrugsOutcome
COL16A1SNVMissense_Mutationc.2224G>Tp.Gly742Trpp.G742WQ07092protein_codingdeleterious(0)probably_damaging(0.982)TCGA-A8-A097-01Breastbreast invasive carcinomaFemale>=65I/IIHormone TherapytamoxiphenSD
COL16A1SNVMissense_Mutationnovelc.2005N>Gp.Pro669Alap.P669AQ07092protein_codingdeleterious(0.01)possibly_damaging(0.525)TCGA-AR-A5QQ-01Breastbreast invasive carcinomaFemale>=65III/IVChemotherapycarboplatinPD
COL16A1SNVMissense_Mutationrs573984488c.233N>Ap.Arg78Hisp.R78HQ07092protein_codingdeleterious(0)probably_damaging(0.987)TCGA-B6-A400-01Breastbreast invasive carcinomaFemale<65III/IVUnknownUnknownSD
COL16A1SNVMissense_Mutationc.2512N>Tp.Pro838Serp.P838SQ07092protein_codingtolerated(0.1)benign(0.018)TCGA-BH-A0HF-01Breastbreast invasive carcinomaFemale>=65I/IIHormone TherapyarimidexSD
COL16A1SNVMissense_Mutationc.3994N>Ap.Gly1332Serp.G1332SQ07092protein_codingdeleterious(0)probably_damaging(0.998)TCGA-BH-A0HN-01Breastbreast invasive carcinomaFemale>=65I/IIHormone TherapyarimidexSD
COL16A1SNVMissense_Mutationc.4054G>Ap.Glu1352Lysp.E1352KQ07092protein_codingtolerated(0.11)possibly_damaging(0.824)TCGA-D8-A13Y-01Breastbreast invasive carcinomaFemale<65I/IIChemotherapydoxorubicinSD
COL16A1SNVMissense_Mutationc.3941G>Cp.Gly1314Alap.G1314AQ07092protein_codingdeleterious(0.01)probably_damaging(0.996)TCGA-E2-A10C-01Breastbreast invasive carcinomaFemale<65I/IIChemotherapycytoxanSD
COL16A1SNVMissense_Mutationc.4303N>Gp.Asn1435Aspp.N1435DQ07092protein_codingtolerated(0.12)possibly_damaging(0.874)TCGA-EW-A1OZ-01Breastbreast invasive carcinomaFemale<65I/IITargeted Molecular therapytrastuzumabSD
COL16A1insertionFrame_Shift_Insnovelc.3043_3044insCAAGGCTGAAAGAAATGATTCTAAAATCAp.Gly1015AlafsTer36p.G1015Afs*36Q07092protein_codingTCGA-A2-A0CP-01Breastbreast invasive carcinomaFemale<65I/IIChemotherapycytoxanSD
COL16A1insertionIn_Frame_Insnovelc.468_469insCCTTGGGCTp.Cys156_Ile157insProTrpAlap.C156_I157insPWAQ07092protein_codingTCGA-AN-A0FS-01Breastbreast invasive carcinomaFemale<65I/IIUnknownUnknownSD
Page: 1 2 3 4 5 6 7 8 9 10 11 12 13 14 15 

Top

Related drugs of malignant transformation related genes

check buttonIdentification of chemicals and drugs interact with genes involved in malignant transfromation
(DGIdb 4.0)
Entrez IDSymbolCategoryInteraction TypesDrug Claim NameDrug NamePMIDs
Page: 1