
|
|||||
|
 | |
| |
| |
| |
| |
| |
|
Gene: COL12A1 |
Gene summary for COL12A1 |
| Gene information | Species | Human | Gene symbol | COL12A1 | Gene ID | 1303 |
| Gene name | collagen type XII alpha 1 chain | |
| Gene Alias | BA209D8.1 | |
| Cytomap | 6q13-q14.1 | |
| Gene Type | protein-coding | GO ID | GO:0001704 | UniProtAcc | Q99715 |
Top |
Malignant transformation analysis |
| Identification of the aberrant gene expression in precancerous and cancerous lesions by comparing the gene expression of stem-like cells in diseased tissues with normal stem cells |
| Entrez ID | Symbol | Replicates | Species | Organ | Tissue | Adj P-value | Log2FC | Malignancy |
| 1303 | COL12A1 | LZE6T | Human | Esophagus | ESCC | 1.26e-03 | 3.38e-01 | 0.0845 |
| 1303 | COL12A1 | P4T-E | Human | Esophagus | ESCC | 2.51e-06 | 8.74e-01 | 0.1323 |
| 1303 | COL12A1 | P9T-E | Human | Esophagus | ESCC | 1.41e-11 | 1.01e+00 | 0.1131 |
| 1303 | COL12A1 | P10T-E | Human | Esophagus | ESCC | 9.42e-66 | 1.34e+00 | 0.116 |
| 1303 | COL12A1 | P11T-E | Human | Esophagus | ESCC | 1.14e-09 | 9.53e-01 | 0.1426 |
| 1303 | COL12A1 | P12T-E | Human | Esophagus | ESCC | 5.32e-18 | 3.79e-01 | 0.1122 |
| 1303 | COL12A1 | P15T-E | Human | Esophagus | ESCC | 9.03e-07 | 6.21e-01 | 0.1149 |
| 1303 | COL12A1 | P16T-E | Human | Esophagus | ESCC | 1.58e-02 | 6.41e-03 | 0.1153 |
| 1303 | COL12A1 | P17T-E | Human | Esophagus | ESCC | 2.53e-03 | 5.37e-01 | 0.1278 |
| 1303 | COL12A1 | P20T-E | Human | Esophagus | ESCC | 2.59e-02 | 1.71e-01 | 0.1124 |
| 1303 | COL12A1 | P21T-E | Human | Esophagus | ESCC | 1.31e-25 | 7.24e-01 | 0.1617 |
| 1303 | COL12A1 | P22T-E | Human | Esophagus | ESCC | 1.44e-03 | 4.48e-01 | 0.1236 |
| 1303 | COL12A1 | P23T-E | Human | Esophagus | ESCC | 2.76e-02 | 5.58e-01 | 0.108 |
| 1303 | COL12A1 | P24T-E | Human | Esophagus | ESCC | 4.58e-05 | 4.57e-01 | 0.1287 |
| 1303 | COL12A1 | P26T-E | Human | Esophagus | ESCC | 1.34e-09 | 3.30e-01 | 0.1276 |
| 1303 | COL12A1 | P30T-E | Human | Esophagus | ESCC | 8.51e-05 | 6.64e-01 | 0.137 |
| 1303 | COL12A1 | P31T-E | Human | Esophagus | ESCC | 2.91e-32 | 9.34e-01 | 0.1251 |
| 1303 | COL12A1 | P32T-E | Human | Esophagus | ESCC | 2.19e-57 | 1.54e+00 | 0.1666 |
| 1303 | COL12A1 | P37T-E | Human | Esophagus | ESCC | 8.47e-41 | 1.39e+00 | 0.1371 |
| 1303 | COL12A1 | P42T-E | Human | Esophagus | ESCC | 2.15e-19 | 1.28e+00 | 0.1175 |
| Page: 1 2 3 |
| Tissue | Expression Dynamics | Abbreviation |
| Esophagus |  | ESCC: Esophageal squamous cell carcinoma |
| HGIN: High-grade intraepithelial neoplasias | ||
| LGIN: Low-grade intraepithelial neoplasias | ||
| Oral Cavity | 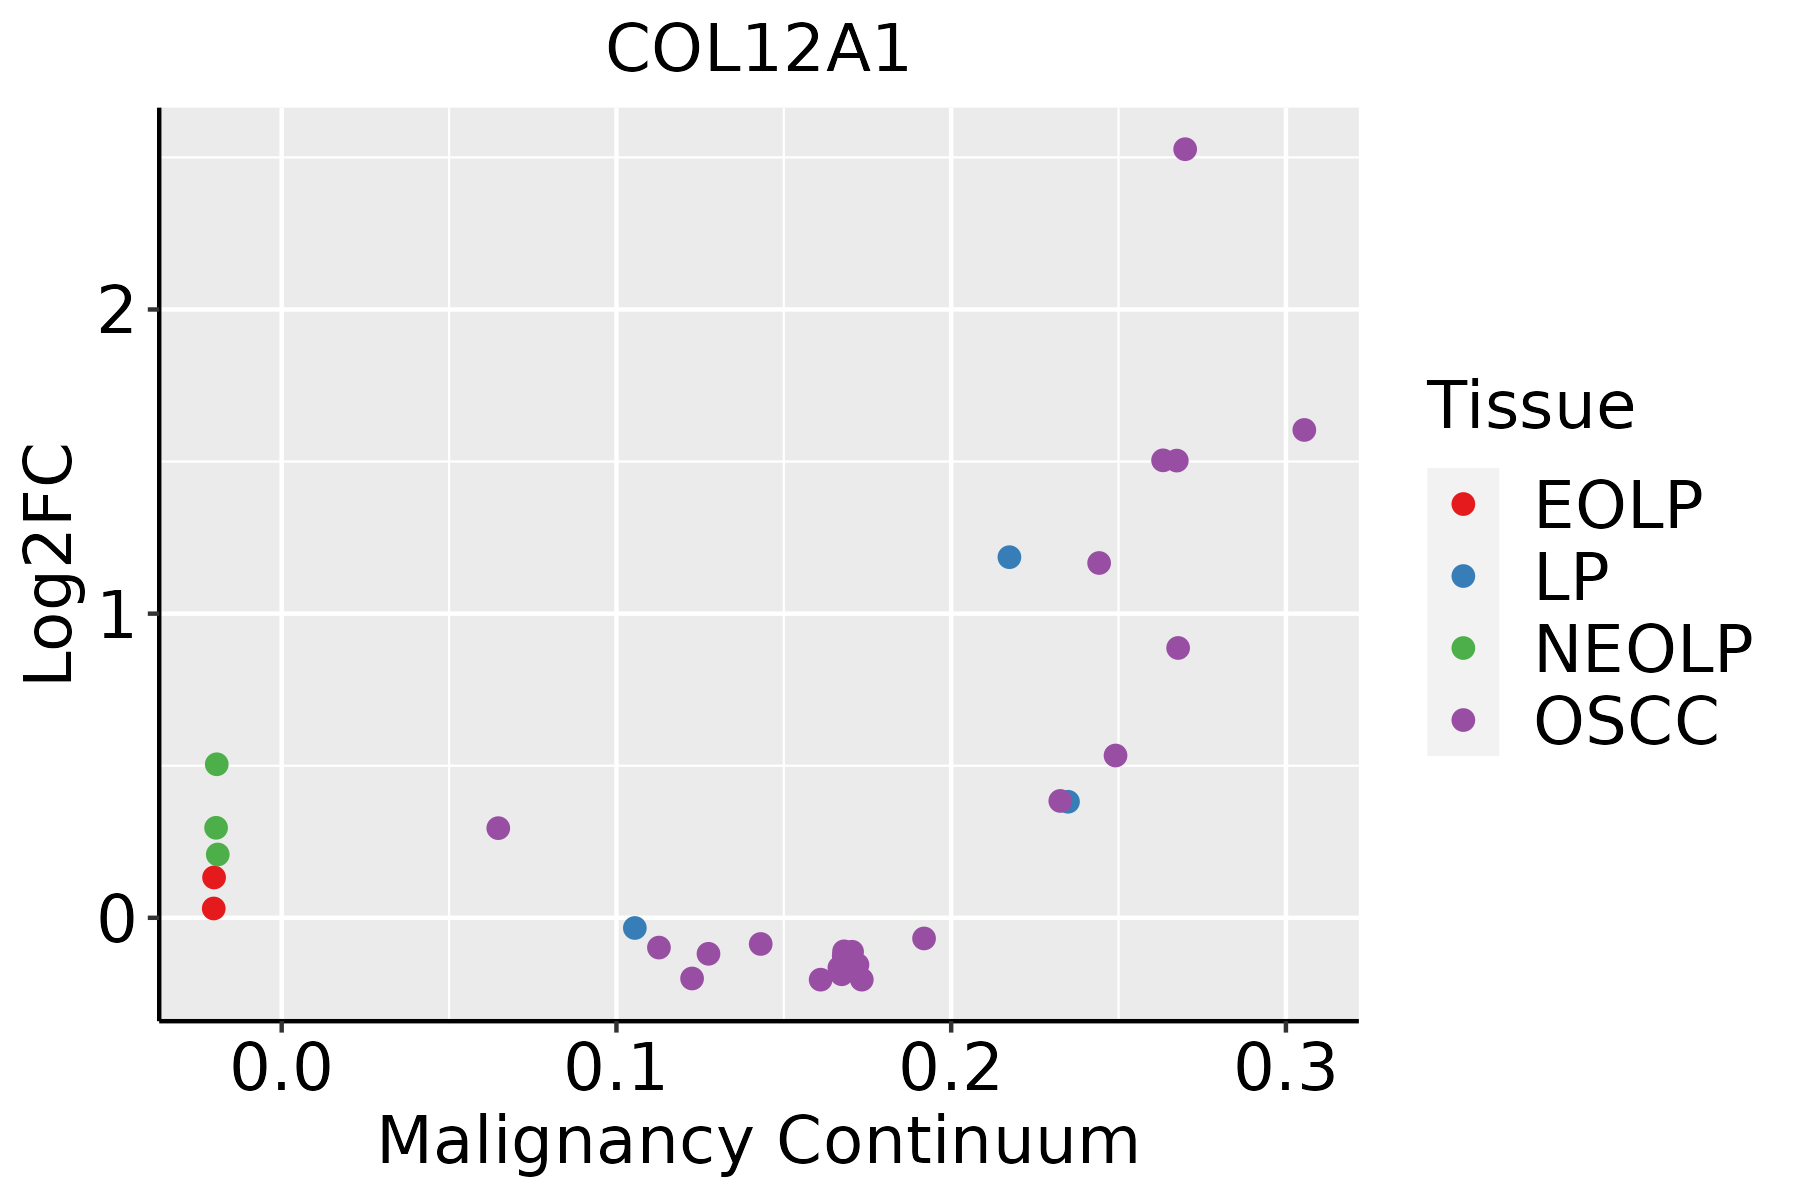 | EOLP: Erosive Oral lichen planus |
| LP: leukoplakia | ||
| NEOLP: Non-erosive oral lichen planus | ||
| OSCC: Oral squamous cell carcinoma | ||
| Prostate |  | BPH: Benign Prostatic Hyperplasia |
| Thyroid |  | ATC: Anaplastic thyroid cancer |
| HT: Hashimoto's thyroiditis | ||
| PTC: Papillary thyroid cancer |
| ∗log2FC in expression of this searched gene in stem-like cells from each diseased tissue sample relative to stem-like cells in normal samples in each tissue plotted against the malignancy continuum. Samples are colored based on if they are from different disease stage. |
Top |
Malignant transformation related pathway analysis |
| Find out the enriched GO biological processes and KEGG pathways involved in transition from healthy to precancer to cancer |
| Tissue | Disease Stage | Enriched GO biological Processes |
| Colorectum | AD |  |
| Colorectum | SER |  |
| Colorectum | MSS |  |
| Colorectum | MSI-H |  |
| Colorectum | FAP |  |
| ∗Top 15 enriched GO BP terms are showed in the bar plot of each disease state in each tissue. Each row represents a significant GO biological process which is colored according to the -log10(p.adjust). |
| Page: 1 2 3 4 5 6 7 8 9 |
| GO ID | Tissue | Disease Stage | Description | Gene Ratio | Bg Ratio | pvalue | p.adjust | Count |
| GO:00073698 | Esophagus | ESCC | gastrulation | 115/8552 | 185/18723 | 4.35e-06 | 4.64e-05 | 115 |
| GO:00074926 | Esophagus | ESCC | endoderm development | 54/8552 | 77/18723 | 1.20e-05 | 1.12e-04 | 54 |
| GO:00301984 | Esophagus | ESCC | extracellular matrix organization | 171/8552 | 301/18723 | 6.08e-05 | 4.67e-04 | 171 |
| GO:00430624 | Esophagus | ESCC | extracellular structure organization | 171/8552 | 302/18723 | 7.73e-05 | 5.76e-04 | 171 |
| GO:00452294 | Esophagus | ESCC | external encapsulating structure organization | 172/8552 | 304/18723 | 7.80e-05 | 5.80e-04 | 172 |
| GO:00017064 | Esophagus | ESCC | endoderm formation | 38/8552 | 54/18723 | 2.08e-04 | 1.31e-03 | 38 |
| GO:00017044 | Esophagus | ESCC | formation of primary germ layer | 75/8552 | 121/18723 | 2.17e-04 | 1.36e-03 | 75 |
| GO:00359873 | Esophagus | ESCC | endodermal cell differentiation | 32/8552 | 45/18723 | 4.87e-04 | 2.70e-03 | 32 |
| GO:00301993 | Esophagus | ESCC | collagen fibril organization | 40/8552 | 61/18723 | 1.35e-03 | 6.44e-03 | 40 |
| GO:00074925 | Oral cavity | OSCC | endoderm development | 47/7305 | 77/18723 | 7.40e-05 | 5.81e-04 | 47 |
| GO:00017063 | Oral cavity | OSCC | endoderm formation | 34/7305 | 54/18723 | 3.12e-04 | 1.94e-03 | 34 |
| GO:00073697 | Oral cavity | OSCC | gastrulation | 95/7305 | 185/18723 | 4.17e-04 | 2.54e-03 | 95 |
| GO:00301983 | Oral cavity | OSCC | extracellular matrix organization | 146/7305 | 301/18723 | 4.67e-04 | 2.77e-03 | 146 |
| GO:00452293 | Oral cavity | OSCC | external encapsulating structure organization | 147/7305 | 304/18723 | 5.30e-04 | 3.08e-03 | 147 |
| GO:00430623 | Oral cavity | OSCC | extracellular structure organization | 146/7305 | 302/18723 | 5.59e-04 | 3.23e-03 | 146 |
| GO:00017043 | Oral cavity | OSCC | formation of primary germ layer | 65/7305 | 121/18723 | 7.08e-04 | 3.90e-03 | 65 |
| GO:00359872 | Oral cavity | OSCC | endodermal cell differentiation | 28/7305 | 45/18723 | 1.36e-03 | 6.62e-03 | 28 |
| GO:00301982 | Oral cavity | NEOLP | extracellular matrix organization | 64/2005 | 301/18723 | 5.66e-08 | 2.24e-06 | 64 |
| GO:00430622 | Oral cavity | NEOLP | extracellular structure organization | 64/2005 | 302/18723 | 6.44e-08 | 2.50e-06 | 64 |
| GO:00452292 | Oral cavity | NEOLP | external encapsulating structure organization | 64/2005 | 304/18723 | 8.33e-08 | 3.17e-06 | 64 |
| Page: 1 2 3 |
| Pathway ID | Tissue | Disease Stage | Description | Gene Ratio | Bg Ratio | pvalue | p.adjust | qvalue | Count |
| Page: 1 |
Top |
Cell-cell communication analysis |
| Identification of potential cell-cell interactions between two cell types and their ligand-receptor pairs for different disease states |
| Ligand | Receptor | LRpair | Pathway | Tissue | Disease Stage |
| Page: 1 |
Top |
Single-cell gene regulatory network inference analysis |
| Find out the significant the regulons (TFs) and the target genes of each regulon across cell types for different disease states |
| TF | Cell Type | Tissue | Disease Stage | Target Gene | RSS | Regulon Activity |
| ∗The dot plots of a searched regulon are shown for all cell subpopulations in each disease state of each tissue based on the regulon specific score inferred using pySCENIC and by calculating the average expression. |
| Page: 1 |
Top |
Somatic mutation of malignant transformation related genes |
| Annotation of somatic variants for genes involved in malignant transformation |
| Hugo Symbol | Variant Class | Variant Classification | dbSNP RS | HGVSc | HGVSp | HGVSp Short | SWISSPROT | BIOTYPE | SIFT | PolyPhen | Tumor Sample Barcode | Tissue | Histology | Sex | Age | Stage | Therapy Types | Drugs | Outcome |
| COL12A1 | SNV | Missense_Mutation | c.6136N>A | p.Asp2046Asn | p.D2046N | Q99715 | protein_coding | deleterious(0) | probably_damaging(0.936) | TCGA-A2-A0EQ-01 | Breast | breast invasive carcinoma | Female | <65 | I/II | Chemotherapy | adriamycin | SD | |
| COL12A1 | SNV | Missense_Mutation | c.472T>A | p.Tyr158Asn | p.Y158N | Q99715 | protein_coding | tolerated(0.29) | possibly_damaging(0.812) | TCGA-A2-A0T0-01 | Breast | breast invasive carcinoma | Female | <65 | I/II | Chemotherapy | taxotere | SD | |
| COL12A1 | SNV | Missense_Mutation | novel | c.6806N>T | p.Gly2269Val | p.G2269V | Q99715 | protein_coding | tolerated(0.15) | benign(0.077) | TCGA-A2-A3Y0-01 | Breast | breast invasive carcinoma | Female | <65 | I/II | Chemotherapy | adriamycin | CR |
| COL12A1 | SNV | Missense_Mutation | c.6181C>T | p.Pro2061Ser | p.P2061S | Q99715 | protein_coding | tolerated(0.11) | benign(0.152) | TCGA-A8-A07R-01 | Breast | breast invasive carcinoma | Female | >=65 | III/IV | Ancillary | zoledronic | SD | |
| COL12A1 | SNV | Missense_Mutation | c.2747N>A | p.Ile916Asn | p.I916N | Q99715 | protein_coding | deleterious(0.01) | probably_damaging(0.962) | TCGA-A8-A095-01 | Breast | breast invasive carcinoma | Female | <65 | I/II | Chemotherapy | 5-fluorouracil | CR | |
| COL12A1 | SNV | Missense_Mutation | c.7281G>T | p.Lys2427Asn | p.K2427N | Q99715 | protein_coding | deleterious(0) | probably_damaging(0.967) | TCGA-AC-A23H-01 | Breast | breast invasive carcinoma | Female | >=65 | I/II | Unknown | Unknown | PD | |
| COL12A1 | SNV | Missense_Mutation | c.3019G>A | p.Glu1007Lys | p.E1007K | Q99715 | protein_coding | deleterious(0.02) | probably_damaging(0.969) | TCGA-AC-A23H-01 | Breast | breast invasive carcinoma | Female | >=65 | I/II | Unknown | Unknown | PD | |
| COL12A1 | SNV | Missense_Mutation | c.7596G>T | p.Lys2532Asn | p.K2532N | Q99715 | protein_coding | deleterious(0.02) | probably_damaging(0.931) | TCGA-AN-A046-01 | Breast | breast invasive carcinoma | Female | >=65 | I/II | Unknown | Unknown | SD | |
| COL12A1 | SNV | Missense_Mutation | c.1567N>C | p.Met523Leu | p.M523L | Q99715 | protein_coding | tolerated(0.54) | probably_damaging(0.945) | TCGA-AR-A1AI-01 | Breast | breast invasive carcinoma | Female | <65 | I/II | Chemotherapy | cytoxan | PD | |
| COL12A1 | SNV | Missense_Mutation | novel | c.40G>A | p.Ala14Thr | p.A14T | Q99715 | protein_coding | tolerated_low_confidence(0.61) | benign(0.041) | TCGA-B6-A409-01 | Breast | breast invasive carcinoma | Female | <65 | III/IV | Chemotherapy | cyclophosphamide | PD |
| Page: 1 2 3 4 5 6 7 8 9 10 11 12 13 14 15 16 17 18 19 20 21 22 23 24 25 26 27 28 29 30 31 32 33 34 35 36 37 38 39 40 41 42 43 44 45 46 47 |
Top |
Related drugs of malignant transformation related genes |
| Identification of chemicals and drugs interact with genes involved in malignant transfromation |
| (DGIdb 4.0) |
| Entrez ID | Symbol | Category | Interaction Types | Drug Claim Name | Drug Name | PMIDs |
| Page: 1 |

Copyright 2023-Present -The University of Texas Health Science Center at Houston |