
|
|||||
|
 | |
| |
| |
| |
| |
| |
|
Gene: COL11A1 |
Gene summary for COL11A1 |
| Gene information | Species | Human | Gene symbol | COL11A1 | Gene ID | 1301 |
| Gene name | collagen type XI alpha 1 chain | |
| Gene Alias | CO11A1 | |
| Cytomap | 1p21.1 | |
| Gene Type | protein-coding | GO ID | GO:0001501 | UniProtAcc | P12107 |
Top |
Malignant transformation analysis |
| Identification of the aberrant gene expression in precancerous and cancerous lesions by comparing the gene expression of stem-like cells in diseased tissues with normal stem cells |
| Entrez ID | Symbol | Replicates | Species | Organ | Tissue | Adj P-value | Log2FC | Malignancy |
| 1301 | COL11A1 | P4T-E | Human | Esophagus | ESCC | 2.20e-02 | 2.73e-01 | 0.1323 |
| 1301 | COL11A1 | P9T-E | Human | Esophagus | ESCC | 4.01e-04 | 7.07e-01 | 0.1131 |
| 1301 | COL11A1 | P10T-E | Human | Esophagus | ESCC | 2.02e-06 | 3.94e-01 | 0.116 |
| 1301 | COL11A1 | P22T-E | Human | Esophagus | ESCC | 1.66e-02 | 2.68e-01 | 0.1236 |
| 1301 | COL11A1 | P32T-E | Human | Esophagus | ESCC | 9.53e-09 | 7.25e-01 | 0.1666 |
| 1301 | COL11A1 | P42T-E | Human | Esophagus | ESCC | 9.46e-03 | 3.79e-01 | 0.1175 |
| 1301 | COL11A1 | P44T-E | Human | Esophagus | ESCC | 1.25e-08 | 1.26e+00 | 0.1096 |
| 1301 | COL11A1 | P47T-E | Human | Esophagus | ESCC | 4.17e-05 | 4.84e-01 | 0.1067 |
| 1301 | COL11A1 | P76T-E | Human | Esophagus | ESCC | 1.96e-05 | 2.04e-01 | 0.1207 |
| 1301 | COL11A1 | P128T-E | Human | Esophagus | ESCC | 3.90e-02 | 1.35e-01 | 0.1241 |
| 1301 | COL11A1 | ATC13 | Human | Thyroid | ATC | 2.48e-11 | 3.77e-01 | 0.34 |
| 1301 | COL11A1 | ATC2 | Human | Thyroid | ATC | 4.44e-15 | 2.14e+00 | 0.34 |
| 1301 | COL11A1 | ATC5 | Human | Thyroid | ATC | 2.12e-13 | 4.03e-01 | 0.34 |
| Page: 1 |
| Tissue | Expression Dynamics | Abbreviation |
| Esophagus | 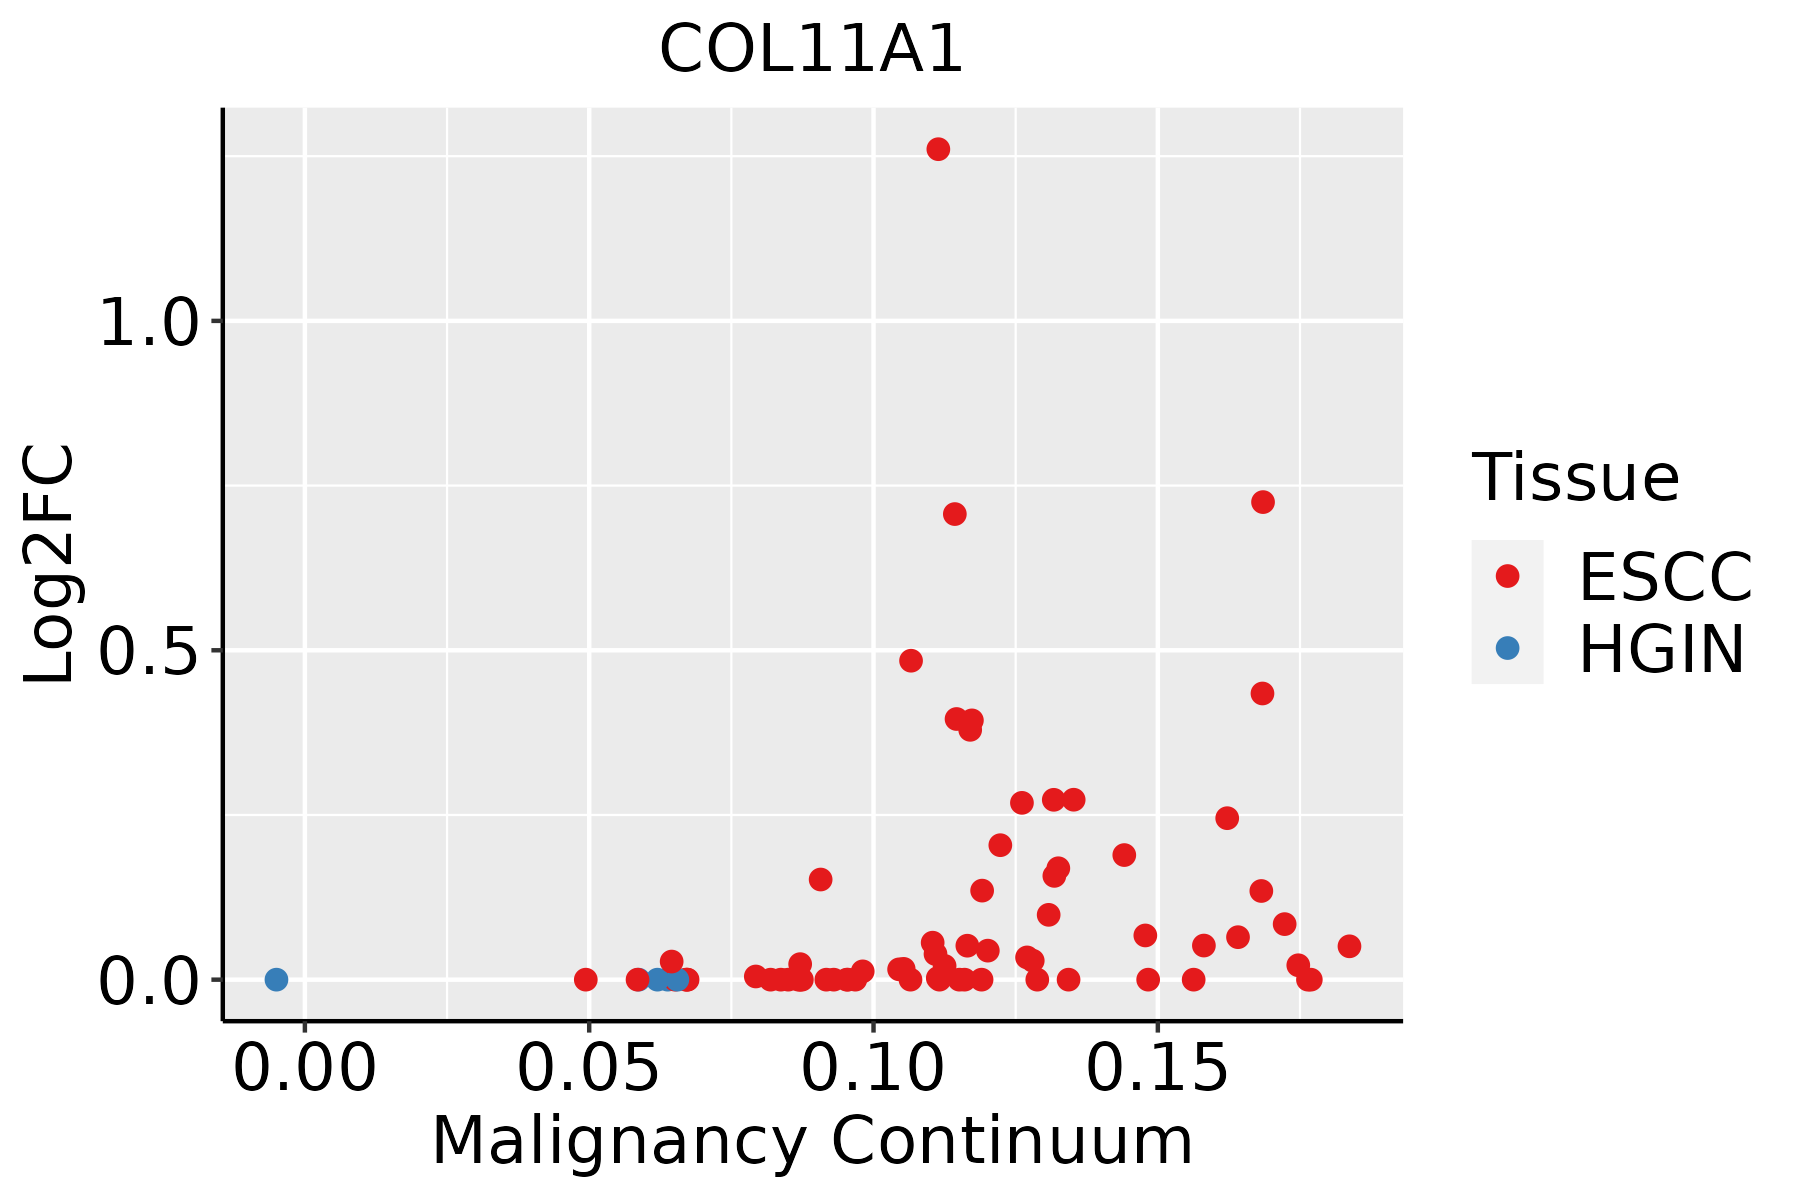 | ESCC: Esophageal squamous cell carcinoma |
| HGIN: High-grade intraepithelial neoplasias | ||
| LGIN: Low-grade intraepithelial neoplasias | ||
| Thyroid | 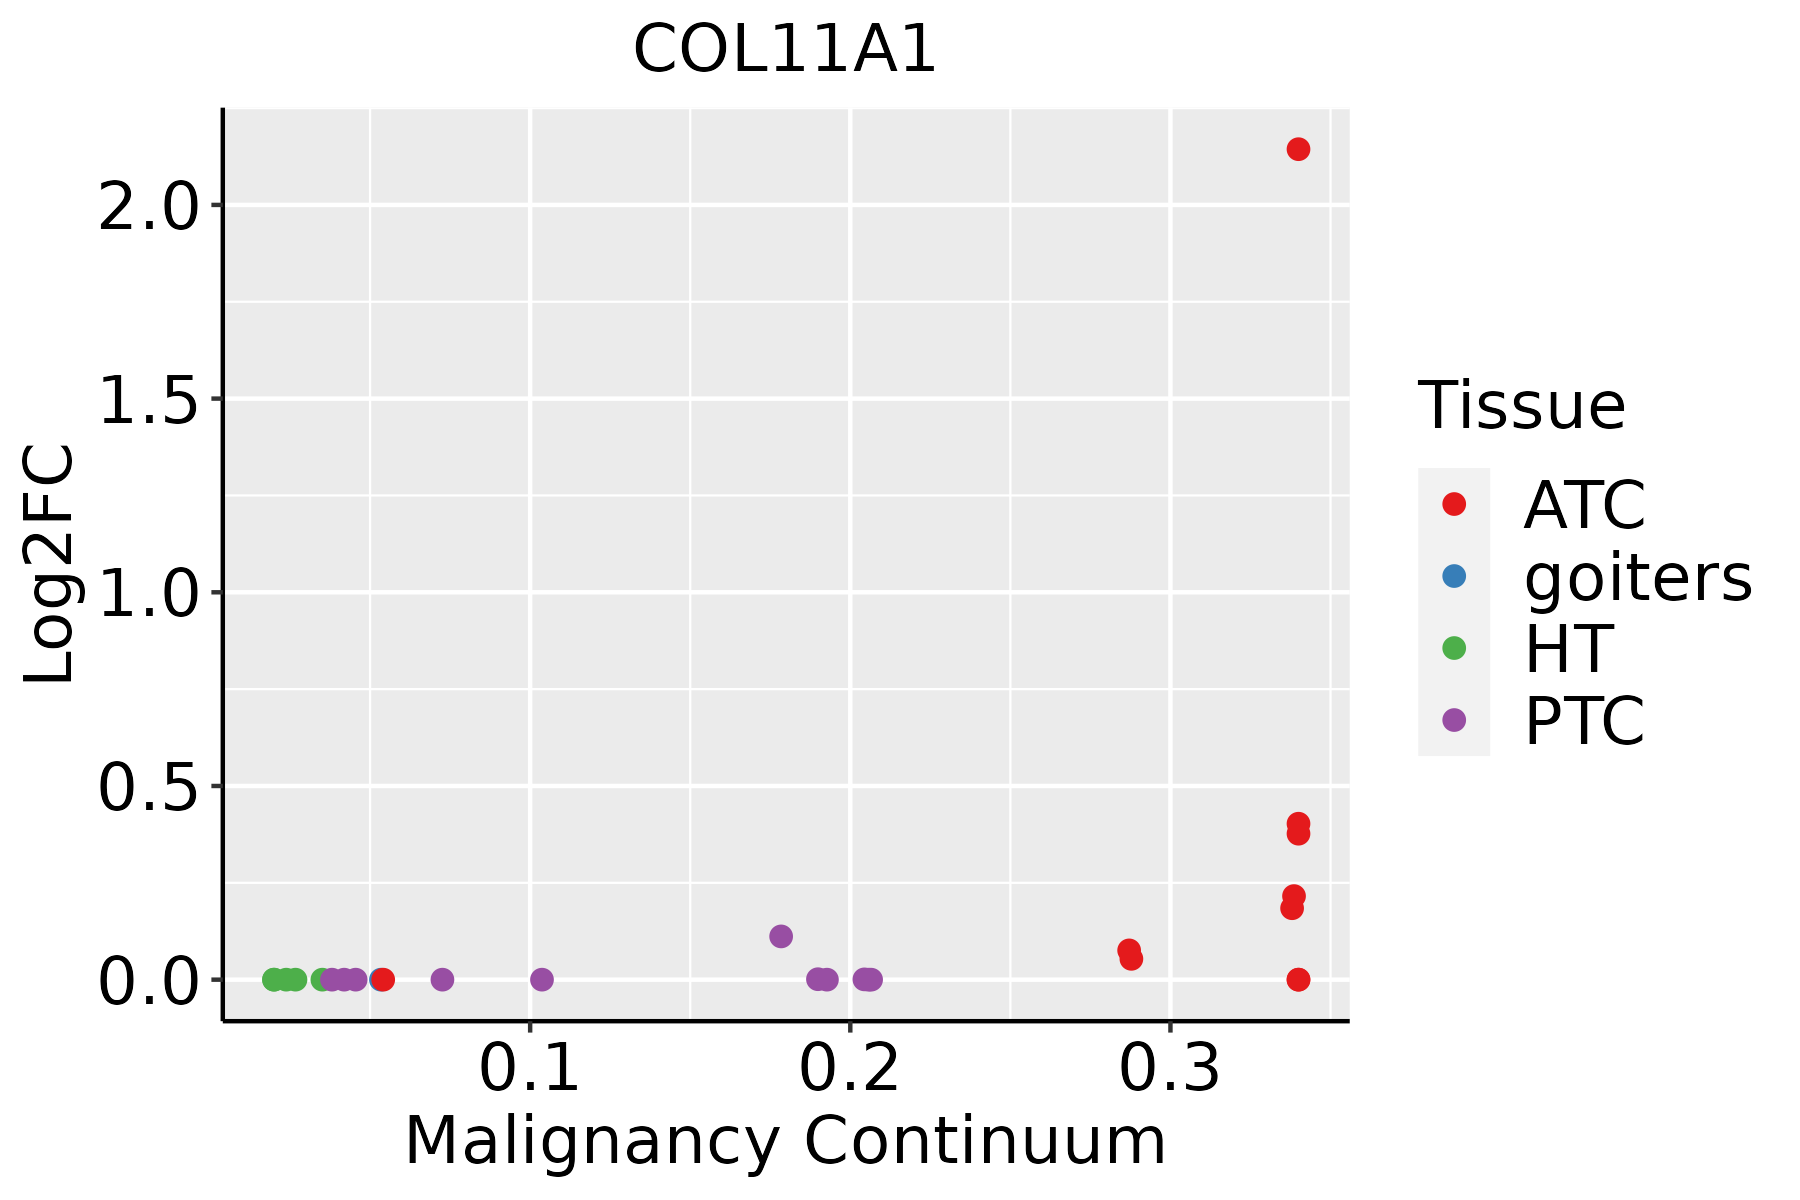 | ATC: Anaplastic thyroid cancer |
| HT: Hashimoto's thyroiditis | ||
| PTC: Papillary thyroid cancer |
| ∗log2FC in expression of this searched gene in stem-like cells from each diseased tissue sample relative to stem-like cells in normal samples in each tissue plotted against the malignancy continuum. Samples are colored based on if they are from different disease stage. |
Top |
Malignant transformation related pathway analysis |
| Find out the enriched GO biological processes and KEGG pathways involved in transition from healthy to precancer to cancer |
| Tissue | Disease Stage | Enriched GO biological Processes |
| Colorectum | AD |  |
| Colorectum | SER |  |
| Colorectum | MSS |  |
| Colorectum | MSI-H |  |
| Colorectum | FAP |  |
| ∗Top 15 enriched GO BP terms are showed in the bar plot of each disease state in each tissue. Each row represents a significant GO biological process which is colored according to the -log10(p.adjust). |
| Page: 1 2 3 4 5 6 7 8 9 |
| GO ID | Tissue | Disease Stage | Description | Gene Ratio | Bg Ratio | pvalue | p.adjust | Count |
| GO:00091002 | Esophagus | ESCC | glycoprotein metabolic process | 226/8552 | 387/18723 | 2.64e-07 | 3.94e-06 | 226 |
| GO:000150317 | Esophagus | ESCC | ossification | 232/8552 | 408/18723 | 3.00e-06 | 3.40e-05 | 232 |
| GO:00073698 | Esophagus | ESCC | gastrulation | 115/8552 | 185/18723 | 4.35e-06 | 4.64e-05 | 115 |
| GO:00074926 | Esophagus | ESCC | endoderm development | 54/8552 | 77/18723 | 1.20e-05 | 1.12e-04 | 54 |
| GO:00301984 | Esophagus | ESCC | extracellular matrix organization | 171/8552 | 301/18723 | 6.08e-05 | 4.67e-04 | 171 |
| GO:00430624 | Esophagus | ESCC | extracellular structure organization | 171/8552 | 302/18723 | 7.73e-05 | 5.76e-04 | 171 |
| GO:00452294 | Esophagus | ESCC | external encapsulating structure organization | 172/8552 | 304/18723 | 7.80e-05 | 5.80e-04 | 172 |
| GO:00017064 | Esophagus | ESCC | endoderm formation | 38/8552 | 54/18723 | 2.08e-04 | 1.31e-03 | 38 |
| GO:00017044 | Esophagus | ESCC | formation of primary germ layer | 75/8552 | 121/18723 | 2.17e-04 | 1.36e-03 | 75 |
| GO:000961216 | Esophagus | ESCC | response to mechanical stimulus | 124/8552 | 216/18723 | 3.30e-04 | 1.94e-03 | 124 |
| GO:00359873 | Esophagus | ESCC | endodermal cell differentiation | 32/8552 | 45/18723 | 4.87e-04 | 2.70e-03 | 32 |
| GO:00485687 | Esophagus | ESCC | embryonic organ development | 228/8552 | 427/18723 | 7.28e-04 | 3.79e-03 | 228 |
| GO:00301993 | Esophagus | ESCC | collagen fibril organization | 40/8552 | 61/18723 | 1.35e-03 | 6.44e-03 | 40 |
| GO:006053716 | Esophagus | ESCC | muscle tissue development | 211/8552 | 403/18723 | 3.84e-03 | 1.56e-02 | 211 |
| GO:00487052 | Esophagus | ESCC | skeletal system morphogenesis | 120/8552 | 220/18723 | 4.90e-03 | 1.89e-02 | 120 |
| GO:0006029 | Esophagus | ESCC | proteoglycan metabolic process | 48/8552 | 79/18723 | 4.93e-03 | 1.89e-02 | 48 |
| GO:00512161 | Esophagus | ESCC | cartilage development | 103/8552 | 190/18723 | 1.08e-02 | 3.67e-02 | 103 |
| GO:001470615 | Esophagus | ESCC | striated muscle tissue development | 197/8552 | 384/18723 | 1.46e-02 | 4.74e-02 | 197 |
| GO:00020623 | Esophagus | ESCC | chondrocyte differentiation | 60/8552 | 106/18723 | 1.53e-02 | 4.94e-02 | 60 |
| GO:000150332 | Thyroid | ATC | ossification | 206/6293 | 408/18723 | 9.23e-13 | 3.95e-11 | 206 |
| Page: 1 2 3 |
| Pathway ID | Tissue | Disease Stage | Description | Gene Ratio | Bg Ratio | pvalue | p.adjust | qvalue | Count |
| Page: 1 |
Top |
Cell-cell communication analysis |
| Identification of potential cell-cell interactions between two cell types and their ligand-receptor pairs for different disease states |
| Ligand | Receptor | LRpair | Pathway | Tissue | Disease Stage |
| Page: 1 |
Top |
Single-cell gene regulatory network inference analysis |
| Find out the significant the regulons (TFs) and the target genes of each regulon across cell types for different disease states |
| TF | Cell Type | Tissue | Disease Stage | Target Gene | RSS | Regulon Activity |
| ∗The dot plots of a searched regulon are shown for all cell subpopulations in each disease state of each tissue based on the regulon specific score inferred using pySCENIC and by calculating the average expression. |
| Page: 1 |
Top |
Somatic mutation of malignant transformation related genes |
| Annotation of somatic variants for genes involved in malignant transformation |
| Hugo Symbol | Variant Class | Variant Classification | dbSNP RS | HGVSc | HGVSp | HGVSp Short | SWISSPROT | BIOTYPE | SIFT | PolyPhen | Tumor Sample Barcode | Tissue | Histology | Sex | Age | Stage | Therapy Types | Drugs | Outcome |
| COL11A1 | SNV | Missense_Mutation | c.3193N>A | p.Ala1065Thr | p.A1065T | P12107 | protein_coding | deleterious(0.05) | probably_damaging(0.989) | TCGA-A2-A0YK-01 | Breast | breast invasive carcinoma | Female | <65 | I/II | Chemotherapy | cytoxan | SD | |
| COL11A1 | SNV | Missense_Mutation | novel | c.1307C>A | p.Pro436His | p.P436H | P12107 | protein_coding | deleterious(0) | probably_damaging(0.999) | TCGA-A2-A25A-01 | Breast | breast invasive carcinoma | Female | <65 | I/II | Unspecific | Cytoxan | SD |
| COL11A1 | SNV | Missense_Mutation | c.3187N>C | p.Gly1063Arg | p.G1063R | P12107 | protein_coding | deleterious(0) | probably_damaging(0.999) | TCGA-A8-A06X-01 | Breast | breast invasive carcinoma | Female | >=65 | I/II | Unknown | Unknown | SD | |
| COL11A1 | SNV | Missense_Mutation | novel | c.3863G>C | p.Gly1288Ala | p.G1288A | P12107 | protein_coding | deleterious(0) | probably_damaging(0.996) | TCGA-AC-A23H-01 | Breast | breast invasive carcinoma | Female | >=65 | I/II | Unknown | Unknown | PD |
| COL11A1 | SNV | Missense_Mutation | c.2288G>C | p.Gly763Ala | p.G763A | P12107 | protein_coding | deleterious(0) | probably_damaging(0.996) | TCGA-AC-A23H-01 | Breast | breast invasive carcinoma | Female | >=65 | I/II | Unknown | Unknown | PD | |
| COL11A1 | SNV | Missense_Mutation | novel | c.4106G>A | p.Gly1369Asp | p.G1369D | P12107 | protein_coding | deleterious(0) | possibly_damaging(0.541) | TCGA-AC-A2BM-01 | Breast | breast invasive carcinoma | Female | <65 | I/II | Unknown | Unknown | SD |
| COL11A1 | SNV | Missense_Mutation | c.3184N>T | p.Arg1062Cys | p.R1062C | P12107 | protein_coding | deleterious(0) | probably_damaging(0.99) | TCGA-AN-A0AK-01 | Breast | breast invasive carcinoma | Female | >=65 | I/II | Unknown | Unknown | SD | |
| COL11A1 | SNV | Missense_Mutation | c.5295N>C | p.Lys1765Asn | p.K1765N | P12107 | protein_coding | deleterious(0.01) | benign(0.007) | TCGA-D8-A1JA-01 | Breast | breast invasive carcinoma | Female | <65 | III/IV | Chemotherapy | adriamycin | PD | |
| COL11A1 | SNV | Missense_Mutation | c.545N>T | p.Cys182Phe | p.C182F | P12107 | protein_coding | deleterious(0) | probably_damaging(0.998) | TCGA-D8-A1XJ-01 | Breast | breast invasive carcinoma | Female | >=65 | III/IV | Hormone Therapy | tamoxiphen | SD | |
| COL11A1 | SNV | Missense_Mutation | c.3973C>T | p.Pro1325Ser | p.P1325S | P12107 | protein_coding | deleterious(0.05) | benign(0.395) | TCGA-E2-A10C-01 | Breast | breast invasive carcinoma | Female | <65 | I/II | Chemotherapy | cytoxan | SD |
| Page: 1 2 3 4 5 6 7 8 9 10 11 12 13 14 15 16 17 18 19 20 21 22 23 24 25 26 27 28 29 30 31 32 33 34 35 36 37 38 39 40 41 42 43 44 45 46 47 48 49 50 51 |
Top |
Related drugs of malignant transformation related genes |
| Identification of chemicals and drugs interact with genes involved in malignant transfromation |
| (DGIdb 4.0) |
| Entrez ID | Symbol | Category | Interaction Types | Drug Claim Name | Drug Name | PMIDs |
| 1301 | COL11A1 | DRUGGABLE GENOME | CHEMBL2095222 | OCRIPLASMIN | ||
| 1301 | COL11A1 | DRUGGABLE GENOME | CHEMBL2108709 | COLLAGENASE CLOSTRIDIUM HISTOLYTICUM |
| Page: 1 |

Copyright 2023-Present -The University of Texas Health Science Center at Houston |