Schematic overview of the cellular and molecular mechanisms involved in the cancer progression, including the proposed cellular and molecular mechanisms in cancer cells trajectory. AT1: alveolar type 1 cells; AT2: alveolar type 2 cells; AAH: atypical adenomatous hyperplasia; AIS: adenocarcinoma in situ; MIA: minimally invasive adenocarcinoma; IA: invasive adenocarcinoma; EMT: epithelial-mesenchymal transition

Home

Download

Statistics

Help

Contact

Center for Computational Systems Medicine
leaf

Gene summary

leaf

Malignant transformation analysis

leaf

Malignant transformation related pathway analysis

leaf

Cell-cell communication analysis

leaf

Single-cell gene regulatory network inference analysis

leaf

Somatic mutation of malignant transformation related genes

leaf

Related drugs of malignant transformation related genes

Gene: COIL

Gene summary for COIL

check button Gene summary.

Gene informationSpeciesHuman
Gene symbol

COIL

Gene ID

8161

Gene namecoilin
Gene AliasCLN80
Cytomap17q22
Gene Typeprotein-coding
GO ID

GO:0000375

UniProtAcc

P38432


Top

Malignant transformation analysis

check button Identification of the aberrant gene expression in precancerous and cancerous lesions by comparing the gene expression of stem-like cells in diseased tissues with normal stem cells
check button Malignant transformation involving gene list.
Entrez IDSymbolReplicatesSpeciesOrganTissueAdj P-valueLog2FCMalignancy
8161COILLZE2THumanEsophagusESCC3.47e-023.45e-010.082
8161COILLZE4THumanEsophagusESCC4.90e-143.28e-010.0811
8161COILLZE7THumanEsophagusESCC5.42e-073.13e-010.0667
8161COILLZE8THumanEsophagusESCC1.05e-021.08e-010.067
8161COILLZE20THumanEsophagusESCC6.21e-052.01e-010.0662
8161COILLZE24THumanEsophagusESCC9.86e-154.03e-010.0596
8161COILLZE21THumanEsophagusESCC2.52e-043.59e-010.0655
8161COILP1T-EHumanEsophagusESCC2.24e-147.06e-010.0875
8161COILP2T-EHumanEsophagusESCC5.28e-336.22e-010.1177
8161COILP4T-EHumanEsophagusESCC3.04e-234.43e-010.1323
8161COILP5T-EHumanEsophagusESCC7.69e-112.00e-010.1327
8161COILP8T-EHumanEsophagusESCC1.51e-294.87e-010.0889
8161COILP9T-EHumanEsophagusESCC1.24e-142.98e-010.1131
8161COILP10T-EHumanEsophagusESCC2.33e-274.83e-010.116
8161COILP11T-EHumanEsophagusESCC5.53e-114.57e-010.1426
8161COILP12T-EHumanEsophagusESCC6.47e-284.75e-010.1122
8161COILP15T-EHumanEsophagusESCC9.87e-266.12e-010.1149
8161COILP16T-EHumanEsophagusESCC4.77e-336.02e-010.1153
8161COILP17T-EHumanEsophagusESCC1.33e-073.17e-010.1278
8161COILP20T-EHumanEsophagusESCC3.76e-244.48e-010.1124
Page: 1 2 3 4 5 6 

check button Transcriptomic changes along malignancy continuum.
TissueExpression DynamicsAbbreviation
EsophagusThe image shows the transcriptomic changes along malignancy continuum.log2FC in expression of this searched gene in stem-like cells from each diseased tissue sample relative to stem-like cells in normal samples in each tissue plotted against the malignancy continuum. Samples are colored based on if they are from different disease stage.
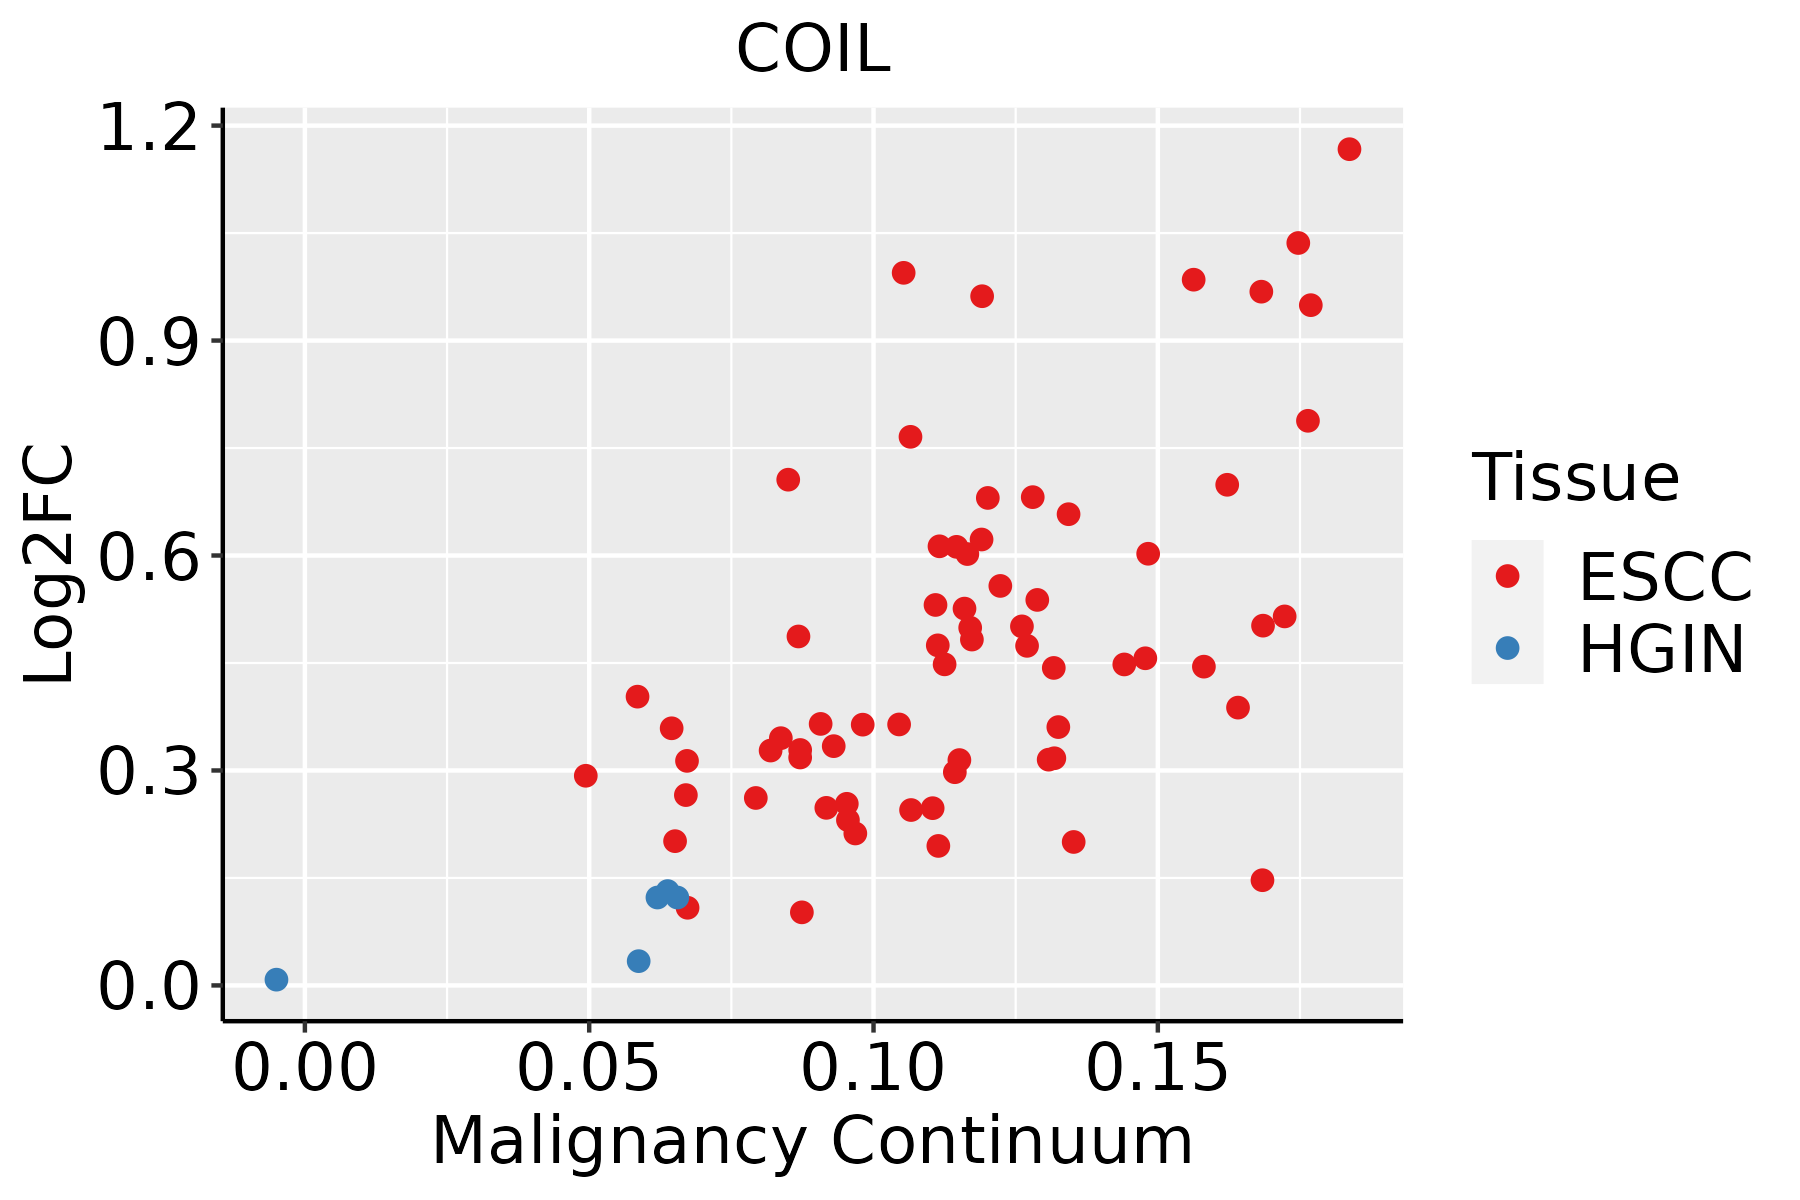
ESCC: Esophageal squamous cell carcinoma
HGIN: High-grade intraepithelial neoplasias
LGIN: Low-grade intraepithelial neoplasias
LiverThe image shows the transcriptomic changes along malignancy continuum.log2FC in expression of this searched gene in stem-like cells from each diseased tissue sample relative to stem-like cells in normal samples in each tissue plotted against the malignancy continuum. Samples are colored based on if they are from different disease stage.HCC: Hepatocellular carcinoma
NAFLD: Non-alcoholic fatty liver disease
Oral CavityThe image shows the transcriptomic changes along malignancy continuum.log2FC in expression of this searched gene in stem-like cells from each diseased tissue sample relative to stem-like cells in normal samples in each tissue plotted against the malignancy continuum. Samples are colored based on if they are from different disease stage.
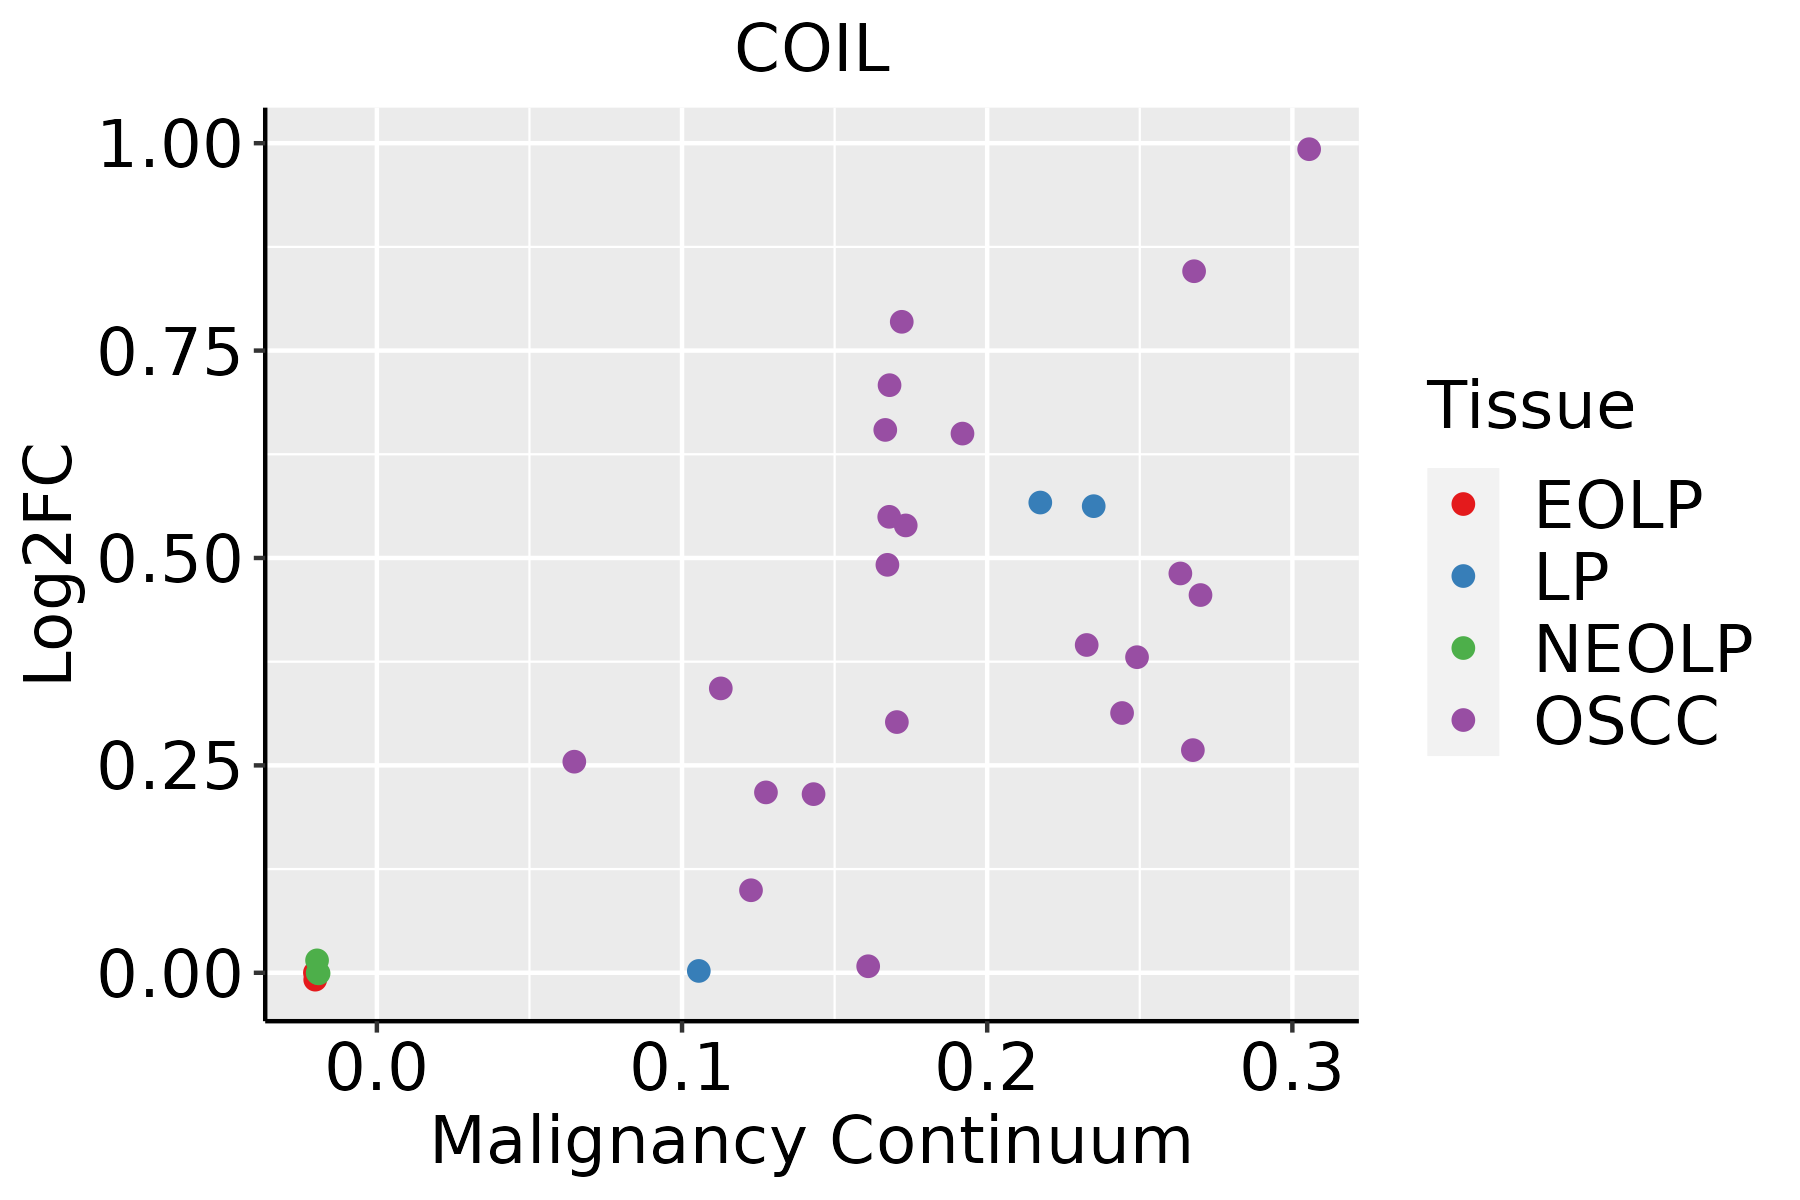
EOLP: Erosive Oral lichen planus
LP: leukoplakia
NEOLP: Non-erosive oral lichen planus
OSCC: Oral squamous cell carcinoma
ThyroidThe image shows the transcriptomic changes along malignancy continuum.log2FC in expression of this searched gene in stem-like cells from each diseased tissue sample relative to stem-like cells in normal samples in each tissue plotted against the malignancy continuum. Samples are colored based on if they are from different disease stage.ATC: Anaplastic thyroid cancer
HT: Hashimoto's thyroiditis
PTC: Papillary thyroid cancer
∗log2FC in expression of this searched gene in stem-like cells from each diseased tissue sample relative to stem-like cells in normal samples in each tissue plotted against the malignancy continuum. Samples are colored based on if they are from different disease stage.

Top

Malignant transformation related pathway analysis

check buttonFind out the enriched GO biological processes and KEGG pathways involved in transition from healthy to precancer to cancer
check button Figure of enriched GO biological processes.
TissueDisease StageEnriched GO biological Processes
ColorectumADGO analysis - Figure of enriched GO biological processes: Top 15 enriched GO BP terms are showed in the bar plot of each disease state in each tissue. Each row represents a significant GO biological process which is colored according to the -log10(p.adjust).
ColorectumSERGO analysis - Figure of enriched GO biological processes: Top 15 enriched GO BP terms are showed in the bar plot of each disease state in each tissue. Each row represents a significant GO biological process which is colored according to the -log10(p.adjust).
ColorectumMSSGO analysis - Figure of enriched GO biological processes: Top 15 enriched GO BP terms are showed in the bar plot of each disease state in each tissue. Each row represents a significant GO biological process which is colored according to the -log10(p.adjust).
ColorectumMSI-HGO analysis - Figure of enriched GO biological processes: Top 15 enriched GO BP terms are showed in the bar plot of each disease state in each tissue. Each row represents a significant GO biological process which is colored according to the -log10(p.adjust).
ColorectumFAPGO analysis - Figure of enriched GO biological processes: Top 15 enriched GO BP terms are showed in the bar plot of each disease state in each tissue. Each row represents a significant GO biological process which is colored according to the -log10(p.adjust).
∗Top 15 enriched GO BP terms are showed in the bar plot of each disease state in each tissue. Each row represents a significant GO biological process which is colored according to the -log10(p.adjust).
Page: 1 2 3 4 5 6 7 8 9 

check button Enriched GO biological processes.
GO IDTissueDisease StageDescriptionGene RatioBg Ratiopvaluep.adjustCount
GO:0022613111EsophagusESCCribonucleoprotein complex biogenesis365/8552463/187231.74e-491.11e-45365
GO:0008380111EsophagusESCCRNA splicing336/8552434/187231.74e-423.67e-39336
GO:0000375111EsophagusESCCRNA splicing, via transesterification reactions248/8552324/187233.05e-301.49e-27248
GO:0000377111EsophagusESCCRNA splicing, via transesterification reactions with bulged adenosine as nucleophile244/8552320/187232.52e-291.07e-26244
GO:0000398111EsophagusESCCmRNA splicing, via spliceosome244/8552320/187232.52e-291.07e-26244
GO:0071826111EsophagusESCCribonucleoprotein complex subunit organization166/8552227/187232.94e-172.42e-15166
GO:0022618111EsophagusESCCribonucleoprotein complex assembly159/8552220/187238.19e-165.71e-14159
GO:00003875EsophagusESCCspliceosomal snRNP assembly32/855250/187236.90e-032.52e-0232
GO:002261322LiverHCCribonucleoprotein complex biogenesis355/7958463/187237.76e-524.92e-48355
GO:000838022LiverHCCRNA splicing313/7958434/187231.36e-361.73e-33313
GO:000037522LiverHCCRNA splicing, via transesterification reactions228/7958324/187231.47e-244.06e-22228
GO:000037722LiverHCCRNA splicing, via transesterification reactions with bulged adenosine as nucleophile224/7958320/187231.16e-232.62e-21224
GO:000039822LiverHCCmRNA splicing, via spliceosome224/7958320/187231.16e-232.62e-21224
GO:007182622LiverHCCribonucleoprotein complex subunit organization159/7958227/187233.14e-173.06e-15159
GO:002261822LiverHCCribonucleoprotein complex assembly153/7958220/187233.44e-162.91e-14153
GO:00003872LiverHCCspliceosomal snRNP assembly31/795850/187234.23e-031.84e-0231
GO:002261320Oral cavityOSCCribonucleoprotein complex biogenesis333/7305463/187238.28e-485.24e-44333
GO:000838020Oral cavityOSCCRNA splicing308/7305434/187232.43e-427.70e-39308
GO:000037519Oral cavityOSCCRNA splicing, via transesterification reactions225/7305324/187235.20e-292.99e-26225
GO:000037719Oral cavityOSCCRNA splicing, via transesterification reactions with bulged adenosine as nucleophile221/7305320/187235.50e-282.18e-25221
Page: 1 2 3 

check button Enriched KEGG pathways.
Pathway IDTissueDisease StageDescriptionGene RatioBg Ratiopvaluep.adjustqvalueCount
Page: 1 

Top

Cell-cell communication analysis

check buttonIdentification of potential cell-cell interactions between two cell types and their ligand-receptor pairs for different disease states
LigandReceptorLRpairPathwayTissueDisease Stage
Page: 1 

Top

Single-cell gene regulatory network inference analysis

check buttonFind out the significant the regulons (TFs) and the target genes of each regulon across cell types for different disease states
TFCell TypeTissueDisease StageTarget GeneRSSRegulon Activity
∗The dot plots of a searched regulon are shown for all cell subpopulations in each disease state of each tissue based on the regulon specific score inferred using pySCENIC and by calculating the average expression.
Page: 1 

Top

Somatic mutation of malignant transformation related genes

check buttonAnnotation of somatic variants for genes involved in malignant transformation
Hugo SymbolVariant ClassVariant ClassificationdbSNP RSHGVScHGVSpHGVSp ShortSWISSPROTBIOTYPESIFTPolyPhenTumor Sample BarcodeTissueHistologySexAgeStageTherapy TypesDrugsOutcome
COILSNVMissense_Mutationc.775N>Ap.Asp259Asnp.D259NP38432protein_codingdeleterious(0.05)benign(0.027)TCGA-AC-A23H-01Breastbreast invasive carcinomaFemale>=65I/IIUnknownUnknownPD
COILSNVMissense_Mutationc.1543N>Gp.Leu515Valp.L515VP38432protein_codingdeleterious(0.03)possibly_damaging(0.508)TCGA-OL-A5DA-01Breastbreast invasive carcinomaFemale<65I/IIUnknownUnknownSD
COILSNVMissense_Mutationc.984G>Cp.Leu328Phep.L328FP38432protein_codingdeleterious(0.03)benign(0.103)TCGA-EK-A2R8-01Cervixcervical & endocervical cancerFemale<65I/IIUnknownUnknownSD
COILSNVMissense_Mutationc.373G>Cp.Asp125Hisp.D125HP38432protein_codingdeleterious(0.02)possibly_damaging(0.742)TCGA-EK-A2R8-01Cervixcervical & endocervical cancerFemale<65I/IIUnknownUnknownSD
COILSNVMissense_Mutationc.984G>Cp.Leu328Phep.L328FP38432protein_codingdeleterious(0.03)benign(0.103)TCGA-VS-A953-01Cervixcervical & endocervical cancerFemale<65I/IIUnknownUnknownPD
COILSNVMissense_Mutationnovelc.557N>Cp.Lys186Thrp.K186TP38432protein_codingdeleterious(0.04)probably_damaging(0.999)TCGA-F5-6814-01Colorectumrectum adenocarcinomaMale<65I/IIUnknownUnknownSD
COILSNVMissense_Mutationnovelc.1553N>Cp.Leu518Serp.L518SP38432protein_codingtolerated(0.36)benign(0.03)TCGA-A5-A0G1-01Endometriumuterine corpus endometrioid carcinomaFemale>=65I/IIUnknownUnknownSD
COILSNVMissense_Mutationnovelc.1496N>Tp.Arg499Ilep.R499IP38432protein_codingdeleterious(0.01)benign(0.088)TCGA-A5-A0G2-01Endometriumuterine corpus endometrioid carcinomaFemale<65III/IVUnknownUnknownSD
COILSNVMissense_Mutationnovelc.527N>Gp.Asp176Glyp.D176GP38432protein_codingtolerated(0.2)benign(0.003)TCGA-AJ-A3EL-01Endometriumuterine corpus endometrioid carcinomaFemale<65I/IIUnknownUnknownSD
COILSNVMissense_Mutationc.1543N>Ap.Leu515Ilep.L515IP38432protein_codingtolerated(0.08)possibly_damaging(0.573)TCGA-AP-A1E0-01Endometriumuterine corpus endometrioid carcinomaFemale<65III/IVChemotherapypaclitaxelSD
Page: 1 2 3 4 5 

Top

Related drugs of malignant transformation related genes

check buttonIdentification of chemicals and drugs interact with genes involved in malignant transfromation
(DGIdb 4.0)
Entrez IDSymbolCategoryInteraction TypesDrug Claim NameDrug NamePMIDs
8161COILNAEGCGEPIGALOCATECHIN GALLATE16046615
8161COILNAACTINOMYCIN D2088441
8161COILNAANTI-P8016246523
Page: 1