
|
|||||
|
 | |
| |
| |
| |
| |
| |
|
Gene: COG8 |
Gene summary for COG8 |
| Gene information | Species | Human | Gene symbol | COG8 | Gene ID | 84342 |
| Gene name | component of oligomeric golgi complex 8 | |
| Gene Alias | CDG2H | |
| Cytomap | 16q22.1 | |
| Gene Type | protein-coding | GO ID | GO:0006810 | UniProtAcc | A0A024R6Z6 |
Top |
Malignant transformation analysis |
| Identification of the aberrant gene expression in precancerous and cancerous lesions by comparing the gene expression of stem-like cells in diseased tissues with normal stem cells |
| Entrez ID | Symbol | Replicates | Species | Organ | Tissue | Adj P-value | Log2FC | Malignancy |
| 84342 | COG8 | LZE4T | Human | Esophagus | ESCC | 7.39e-03 | 9.99e-02 | 0.0811 |
| 84342 | COG8 | LZE7T | Human | Esophagus | ESCC | 2.14e-03 | 2.00e-01 | 0.0667 |
| 84342 | COG8 | LZE24T | Human | Esophagus | ESCC | 7.50e-09 | 1.60e-01 | 0.0596 |
| 84342 | COG8 | P1T-E | Human | Esophagus | ESCC | 1.68e-03 | 3.34e-01 | 0.0875 |
| 84342 | COG8 | P2T-E | Human | Esophagus | ESCC | 4.07e-18 | 1.29e-01 | 0.1177 |
| 84342 | COG8 | P4T-E | Human | Esophagus | ESCC | 5.72e-12 | 2.85e-01 | 0.1323 |
| 84342 | COG8 | P5T-E | Human | Esophagus | ESCC | 4.25e-12 | 1.37e-01 | 0.1327 |
| 84342 | COG8 | P8T-E | Human | Esophagus | ESCC | 1.91e-19 | 1.84e-01 | 0.0889 |
| 84342 | COG8 | P9T-E | Human | Esophagus | ESCC | 2.59e-03 | 9.04e-02 | 0.1131 |
| 84342 | COG8 | P10T-E | Human | Esophagus | ESCC | 1.13e-11 | 1.46e-01 | 0.116 |
| 84342 | COG8 | P11T-E | Human | Esophagus | ESCC | 3.48e-12 | 3.18e-01 | 0.1426 |
| 84342 | COG8 | P12T-E | Human | Esophagus | ESCC | 9.18e-13 | 2.08e-01 | 0.1122 |
| 84342 | COG8 | P15T-E | Human | Esophagus | ESCC | 1.38e-05 | 1.49e-01 | 0.1149 |
| 84342 | COG8 | P16T-E | Human | Esophagus | ESCC | 2.53e-14 | 1.82e-01 | 0.1153 |
| 84342 | COG8 | P17T-E | Human | Esophagus | ESCC | 2.20e-06 | 2.38e-01 | 0.1278 |
| 84342 | COG8 | P19T-E | Human | Esophagus | ESCC | 1.78e-02 | 2.19e-01 | 0.1662 |
| 84342 | COG8 | P20T-E | Human | Esophagus | ESCC | 1.00e-12 | 2.25e-01 | 0.1124 |
| 84342 | COG8 | P21T-E | Human | Esophagus | ESCC | 8.28e-12 | 2.11e-01 | 0.1617 |
| 84342 | COG8 | P22T-E | Human | Esophagus | ESCC | 7.82e-13 | 2.45e-01 | 0.1236 |
| 84342 | COG8 | P23T-E | Human | Esophagus | ESCC | 5.51e-22 | 5.06e-01 | 0.108 |
| Page: 1 2 3 4 |
| Tissue | Expression Dynamics | Abbreviation |
| Esophagus | 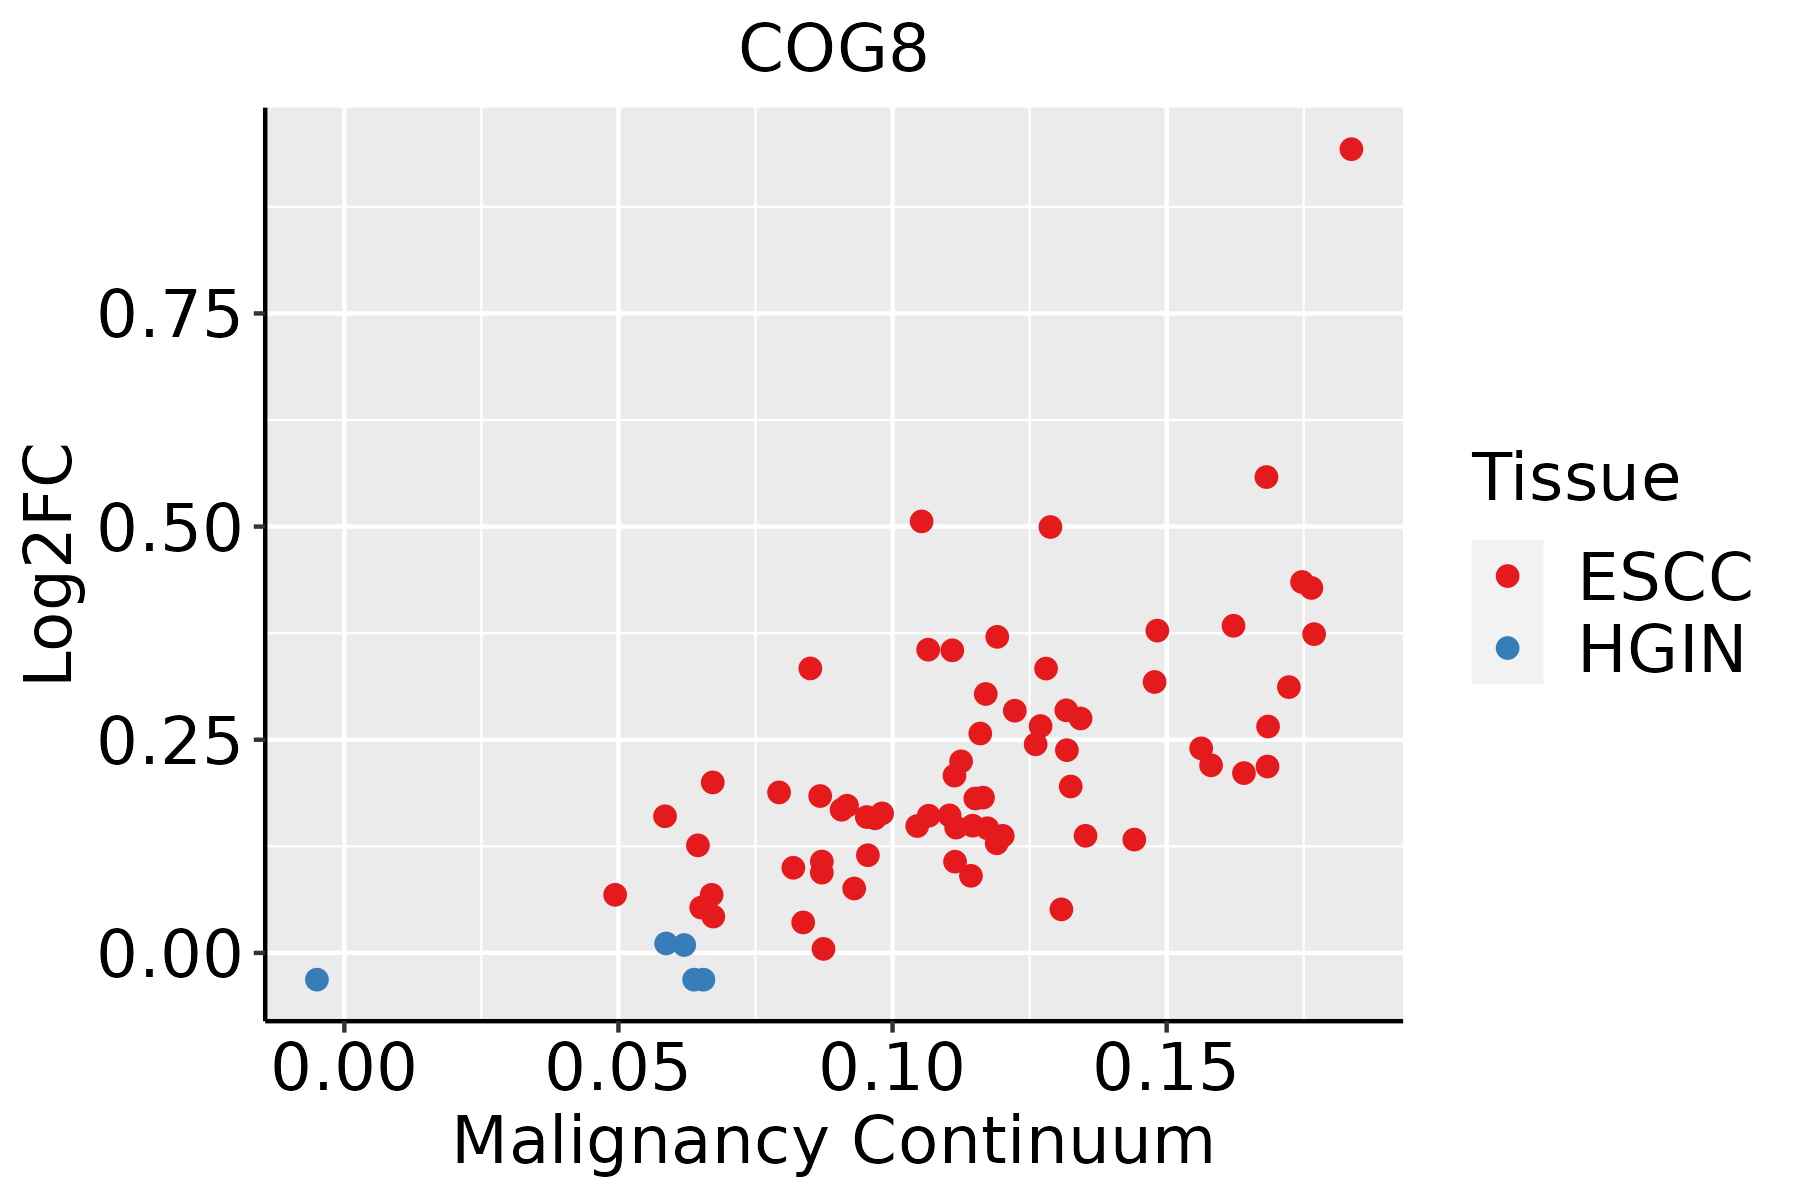 | ESCC: Esophageal squamous cell carcinoma |
| HGIN: High-grade intraepithelial neoplasias | ||
| LGIN: Low-grade intraepithelial neoplasias | ||
| Oral Cavity |  | EOLP: Erosive Oral lichen planus |
| LP: leukoplakia | ||
| NEOLP: Non-erosive oral lichen planus | ||
| OSCC: Oral squamous cell carcinoma |
| ∗log2FC in expression of this searched gene in stem-like cells from each diseased tissue sample relative to stem-like cells in normal samples in each tissue plotted against the malignancy continuum. Samples are colored based on if they are from different disease stage. |
Top |
Malignant transformation related pathway analysis |
| Find out the enriched GO biological processes and KEGG pathways involved in transition from healthy to precancer to cancer |
| Tissue | Disease Stage | Enriched GO biological Processes |
| Colorectum | AD |  |
| Colorectum | SER |  |
| Colorectum | MSS |  |
| Colorectum | MSI-H |  |
| Colorectum | FAP |  |
| ∗Top 15 enriched GO BP terms are showed in the bar plot of each disease state in each tissue. Each row represents a significant GO biological process which is colored according to the -log10(p.adjust). |
| Page: 1 2 3 4 5 6 7 8 9 |
| GO ID | Tissue | Disease Stage | Description | Gene Ratio | Bg Ratio | pvalue | p.adjust | Count |
| GO:004819318 | Esophagus | ESCC | Golgi vesicle transport | 231/8552 | 296/18723 | 1.82e-30 | 9.63e-28 | 231 |
| GO:00068914 | Esophagus | ESCC | intra-Golgi vesicle-mediated transport | 26/8552 | 33/18723 | 1.06e-04 | 7.43e-04 | 26 |
| GO:004819315 | Oral cavity | OSCC | Golgi vesicle transport | 209/7305 | 296/18723 | 1.39e-28 | 6.30e-26 | 209 |
| GO:00068913 | Oral cavity | OSCC | intra-Golgi vesicle-mediated transport | 23/7305 | 33/18723 | 3.47e-04 | 2.12e-03 | 23 |
| GO:004819316 | Oral cavity | LP | Golgi vesicle transport | 141/4623 | 296/18723 | 6.11e-18 | 1.06e-15 | 141 |
| GO:000689111 | Oral cavity | LP | intra-Golgi vesicle-mediated transport | 16/4623 | 33/18723 | 2.59e-03 | 1.83e-02 | 16 |
| Page: 1 |
| Pathway ID | Tissue | Disease Stage | Description | Gene Ratio | Bg Ratio | pvalue | p.adjust | qvalue | Count |
| Page: 1 |
Top |
Cell-cell communication analysis |
| Identification of potential cell-cell interactions between two cell types and their ligand-receptor pairs for different disease states |
| Ligand | Receptor | LRpair | Pathway | Tissue | Disease Stage |
| Page: 1 |
Top |
Single-cell gene regulatory network inference analysis |
| Find out the significant the regulons (TFs) and the target genes of each regulon across cell types for different disease states |
| TF | Cell Type | Tissue | Disease Stage | Target Gene | RSS | Regulon Activity |
| ∗The dot plots of a searched regulon are shown for all cell subpopulations in each disease state of each tissue based on the regulon specific score inferred using pySCENIC and by calculating the average expression. |
| Page: 1 |
Top |
Somatic mutation of malignant transformation related genes |
| Annotation of somatic variants for genes involved in malignant transformation |
| Hugo Symbol | Variant Class | Variant Classification | dbSNP RS | HGVSc | HGVSp | HGVSp Short | SWISSPROT | BIOTYPE | SIFT | PolyPhen | Tumor Sample Barcode | Tissue | Histology | Sex | Age | Stage | Therapy Types | Drugs | Outcome |
| COG8 | SNV | Missense_Mutation | c.820A>T | p.Thr274Ser | p.T274S | Q96MW5 | protein_coding | deleterious(0.04) | possibly_damaging(0.9) | TCGA-AN-A0FX-01 | Breast | breast invasive carcinoma | Female | <65 | I/II | Unknown | Unknown | SD | |
| COG8 | insertion | Frame_Shift_Ins | novel | c.1220_1221insA | p.Thr408HisfsTer3 | p.T408Hfs*3 | Q96MW5 | protein_coding | TCGA-A8-A07R-01 | Breast | breast invasive carcinoma | Female | >=65 | III/IV | Ancillary | zoledronic | SD | ||
| COG8 | insertion | Frame_Shift_Ins | novel | c.1218_1219insATTGAGAAGCTCTGGCCAGTTGCCCTTCATGGGACCTA | p.Gly407IlefsTer13 | p.G407Ifs*13 | Q96MW5 | protein_coding | TCGA-A8-A07R-01 | Breast | breast invasive carcinoma | Female | >=65 | III/IV | Ancillary | zoledronic | SD | ||
| COG8 | insertion | Frame_Shift_Ins | novel | c.821_822insGCTGTCTCCAAGT | p.Ile275LeufsTer14 | p.I275Lfs*14 | Q96MW5 | protein_coding | TCGA-AN-A0FX-01 | Breast | breast invasive carcinoma | Female | <65 | I/II | Unknown | Unknown | SD | ||
| COG8 | deletion | Frame_Shift_Del | novel | c.1376delA | p.Gln459ArgfsTer3 | p.Q459Rfs*3 | Q96MW5 | protein_coding | TCGA-EW-A2FV-01 | Breast | breast invasive carcinoma | Female | <65 | III/IV | Chemotherapy | docetaxel | SD | ||
| COG8 | SNV | Missense_Mutation | rs749837571 | c.752G>A | p.Arg251Gln | p.R251Q | Q96MW5 | protein_coding | deleterious(0) | probably_damaging(0.999) | TCGA-2W-A8YY-01 | Cervix | cervical & endocervical cancer | Female | <65 | I/II | Chemotherapy | cisplatin | CR |
| COG8 | SNV | Missense_Mutation | c.296G>A | p.Arg99His | p.R99H | Q96MW5 | protein_coding | tolerated(0.12) | benign(0.01) | TCGA-2W-A8YY-01 | Cervix | cervical & endocervical cancer | Female | <65 | I/II | Chemotherapy | cisplatin | CR | |
| COG8 | insertion | Frame_Shift_Ins | novel | c.1192_1193insGAATG | p.Met398ArgfsTer35 | p.M398Rfs*35 | Q96MW5 | protein_coding | TCGA-DS-A1OD-01 | Cervix | cervical & endocervical cancer | Female | <65 | I/II | Chemotherapy | cisplatin | SD | ||
| COG8 | SNV | Missense_Mutation | novel | c.1223C>A | p.Thr408Asn | p.T408N | Q96MW5 | protein_coding | tolerated(0.35) | benign(0.014) | TCGA-AA-3947-01 | Colorectum | colon adenocarcinoma | Female | <65 | I/II | Unknown | Unknown | SD |
| COG8 | SNV | Missense_Mutation | c.1045T>C | p.Cys349Arg | p.C349R | Q96MW5 | protein_coding | deleterious(0) | probably_damaging(0.985) | TCGA-AZ-6598-01 | Colorectum | colon adenocarcinoma | Female | >=65 | I/II | Unknown | Unknown | SD |
| Page: 1 2 3 4 5 |
Top |
Related drugs of malignant transformation related genes |
| Identification of chemicals and drugs interact with genes involved in malignant transfromation |
| (DGIdb 4.0) |
| Entrez ID | Symbol | Category | Interaction Types | Drug Claim Name | Drug Name | PMIDs |
| Page: 1 |

Copyright 2023-Present -The University of Texas Health Science Center at Houston |