
|
|||||
|
 | |
| |
| |
| |
| |
| |
|
Gene: COG7 |
Gene summary for COG7 |
| Gene information | Species | Human | Gene symbol | COG7 | Gene ID | 91949 |
| Gene name | component of oligomeric golgi complex 7 | |
| Gene Alias | CDG2E | |
| Cytomap | 16p12.2 | |
| Gene Type | protein-coding | GO ID | GO:0006464 | UniProtAcc | A0A0S2Z652 |
Top |
Malignant transformation analysis |
| Identification of the aberrant gene expression in precancerous and cancerous lesions by comparing the gene expression of stem-like cells in diseased tissues with normal stem cells |
| Entrez ID | Symbol | Replicates | Species | Organ | Tissue | Adj P-value | Log2FC | Malignancy |
| 91949 | COG7 | LZE4T | Human | Esophagus | ESCC | 2.32e-09 | 8.72e-02 | 0.0811 |
| 91949 | COG7 | LZE7T | Human | Esophagus | ESCC | 3.40e-06 | 3.61e-01 | 0.0667 |
| 91949 | COG7 | LZE8T | Human | Esophagus | ESCC | 4.87e-06 | 9.31e-02 | 0.067 |
| 91949 | COG7 | LZE20T | Human | Esophagus | ESCC | 1.03e-03 | 5.67e-02 | 0.0662 |
| 91949 | COG7 | LZE21D1 | Human | Esophagus | HGIN | 1.01e-04 | 3.70e-01 | 0.0632 |
| 91949 | COG7 | LZE24T | Human | Esophagus | ESCC | 4.45e-08 | 1.40e-01 | 0.0596 |
| 91949 | COG7 | LZE21T | Human | Esophagus | ESCC | 2.34e-05 | 1.92e-01 | 0.0655 |
| 91949 | COG7 | P1T-E | Human | Esophagus | ESCC | 8.89e-09 | 3.30e-01 | 0.0875 |
| 91949 | COG7 | P2T-E | Human | Esophagus | ESCC | 1.49e-39 | 6.68e-01 | 0.1177 |
| 91949 | COG7 | P4T-E | Human | Esophagus | ESCC | 8.14e-20 | 2.12e-01 | 0.1323 |
| 91949 | COG7 | P5T-E | Human | Esophagus | ESCC | 1.46e-09 | 5.77e-02 | 0.1327 |
| 91949 | COG7 | P8T-E | Human | Esophagus | ESCC | 5.15e-24 | 4.14e-01 | 0.0889 |
| 91949 | COG7 | P9T-E | Human | Esophagus | ESCC | 2.52e-09 | 2.96e-02 | 0.1131 |
| 91949 | COG7 | P10T-E | Human | Esophagus | ESCC | 8.06e-24 | 1.50e-01 | 0.116 |
| 91949 | COG7 | P11T-E | Human | Esophagus | ESCC | 7.27e-12 | 3.17e-01 | 0.1426 |
| 91949 | COG7 | P12T-E | Human | Esophagus | ESCC | 8.11e-27 | 3.61e-01 | 0.1122 |
| 91949 | COG7 | P15T-E | Human | Esophagus | ESCC | 1.98e-16 | 2.04e-01 | 0.1149 |
| 91949 | COG7 | P16T-E | Human | Esophagus | ESCC | 1.01e-27 | 3.68e-01 | 0.1153 |
| 91949 | COG7 | P17T-E | Human | Esophagus | ESCC | 4.27e-07 | 1.53e-01 | 0.1278 |
| 91949 | COG7 | P19T-E | Human | Esophagus | ESCC | 2.23e-05 | 3.49e-01 | 0.1662 |
| Page: 1 2 3 4 |
| Tissue | Expression Dynamics | Abbreviation |
| Esophagus | 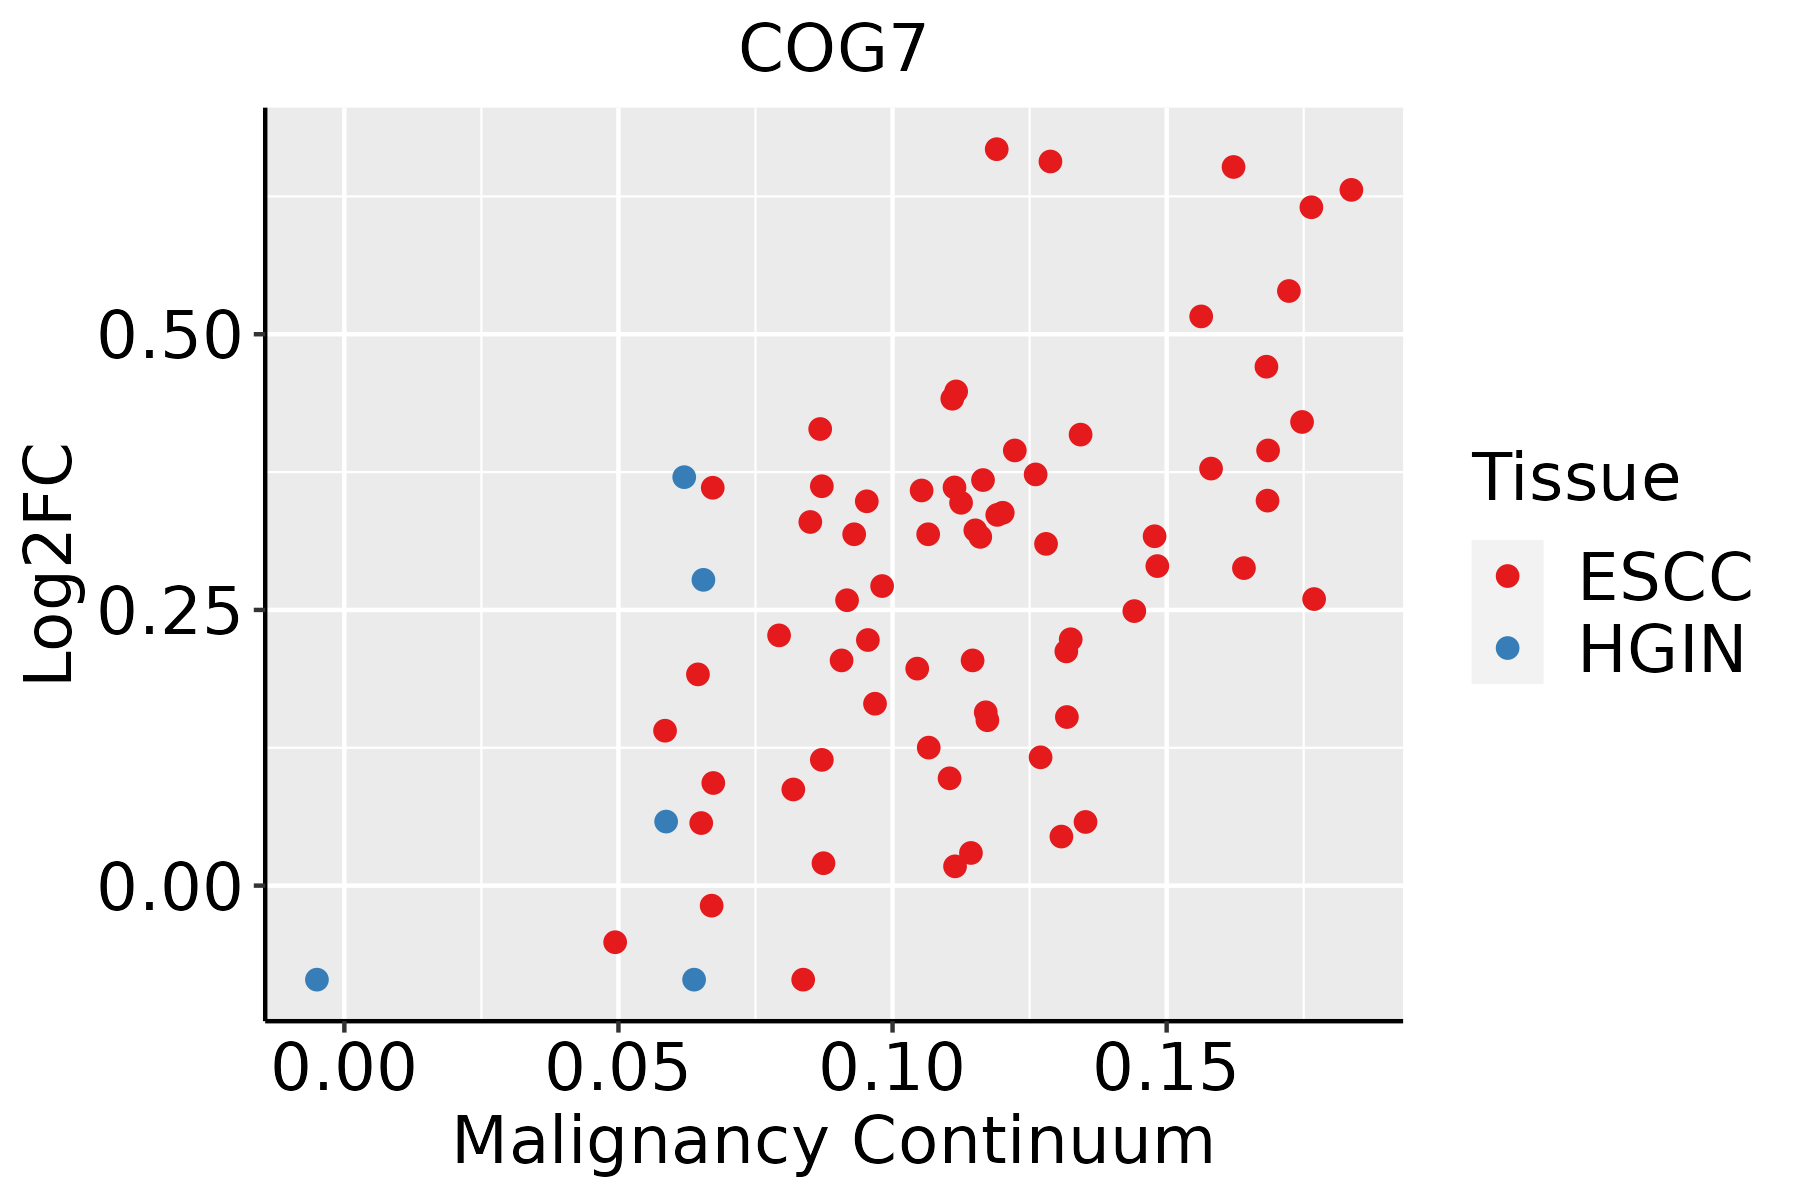 | ESCC: Esophageal squamous cell carcinoma |
| HGIN: High-grade intraepithelial neoplasias | ||
| LGIN: Low-grade intraepithelial neoplasias |
| ∗log2FC in expression of this searched gene in stem-like cells from each diseased tissue sample relative to stem-like cells in normal samples in each tissue plotted against the malignancy continuum. Samples are colored based on if they are from different disease stage. |
Top |
Malignant transformation related pathway analysis |
| Find out the enriched GO biological processes and KEGG pathways involved in transition from healthy to precancer to cancer |
| Tissue | Disease Stage | Enriched GO biological Processes |
| Colorectum | AD |  |
| Colorectum | SER |  |
| Colorectum | MSS |  |
| Colorectum | MSI-H |  |
| Colorectum | FAP |  |
| ∗Top 15 enriched GO BP terms are showed in the bar plot of each disease state in each tissue. Each row represents a significant GO biological process which is colored according to the -log10(p.adjust). |
| Page: 1 2 3 4 5 6 7 8 9 |
| GO ID | Tissue | Disease Stage | Description | Gene Ratio | Bg Ratio | pvalue | p.adjust | Count |
| GO:003164727 | Esophagus | HGIN | regulation of protein stability | 96/2587 | 298/18723 | 2.21e-16 | 5.76e-14 | 96 |
| GO:005082127 | Esophagus | HGIN | protein stabilization | 64/2587 | 191/18723 | 3.11e-12 | 4.24e-10 | 64 |
| GO:004819317 | Esophagus | HGIN | Golgi vesicle transport | 83/2587 | 296/18723 | 8.59e-11 | 8.89e-09 | 83 |
| GO:000689016 | Esophagus | HGIN | retrograde vesicle-mediated transport, Golgi to endoplasmic reticulum | 19/2587 | 52/18723 | 3.44e-05 | 8.67e-04 | 19 |
| GO:004819318 | Esophagus | ESCC | Golgi vesicle transport | 231/8552 | 296/18723 | 1.82e-30 | 9.63e-28 | 231 |
| GO:0031647111 | Esophagus | ESCC | regulation of protein stability | 223/8552 | 298/18723 | 5.76e-25 | 1.52e-22 | 223 |
| GO:0050821111 | Esophagus | ESCC | protein stabilization | 140/8552 | 191/18723 | 6.50e-15 | 3.61e-13 | 140 |
| GO:000689017 | Esophagus | ESCC | retrograde vesicle-mediated transport, Golgi to endoplasmic reticulum | 46/8552 | 52/18723 | 1.23e-10 | 3.66e-09 | 46 |
| GO:00091002 | Esophagus | ESCC | glycoprotein metabolic process | 226/8552 | 387/18723 | 2.64e-07 | 3.94e-06 | 226 |
| GO:00070308 | Esophagus | ESCC | Golgi organization | 101/8552 | 157/18723 | 1.78e-06 | 2.10e-05 | 101 |
| GO:00700854 | Esophagus | ESCC | glycosylation | 144/8552 | 240/18723 | 5.12e-06 | 5.38e-05 | 144 |
| GO:00064865 | Esophagus | ESCC | protein glycosylation | 135/8552 | 226/18723 | 1.36e-05 | 1.24e-04 | 135 |
| GO:00434135 | Esophagus | ESCC | macromolecule glycosylation | 135/8552 | 226/18723 | 1.36e-05 | 1.24e-04 | 135 |
| GO:00091012 | Esophagus | ESCC | glycoprotein biosynthetic process | 181/8552 | 317/18723 | 2.54e-05 | 2.15e-04 | 181 |
| GO:00340676 | Esophagus | ESCC | protein localization to Golgi apparatus | 23/8552 | 29/18723 | 2.25e-04 | 1.40e-03 | 23 |
| Page: 1 |
| Pathway ID | Tissue | Disease Stage | Description | Gene Ratio | Bg Ratio | pvalue | p.adjust | qvalue | Count |
| Page: 1 |
Top |
Cell-cell communication analysis |
| Identification of potential cell-cell interactions between two cell types and their ligand-receptor pairs for different disease states |
| Ligand | Receptor | LRpair | Pathway | Tissue | Disease Stage |
| Page: 1 |
Top |
Single-cell gene regulatory network inference analysis |
| Find out the significant the regulons (TFs) and the target genes of each regulon across cell types for different disease states |
| TF | Cell Type | Tissue | Disease Stage | Target Gene | RSS | Regulon Activity |
| ∗The dot plots of a searched regulon are shown for all cell subpopulations in each disease state of each tissue based on the regulon specific score inferred using pySCENIC and by calculating the average expression. |
| Page: 1 |
Top |
Somatic mutation of malignant transformation related genes |
| Annotation of somatic variants for genes involved in malignant transformation |
| Hugo Symbol | Variant Class | Variant Classification | dbSNP RS | HGVSc | HGVSp | HGVSp Short | SWISSPROT | BIOTYPE | SIFT | PolyPhen | Tumor Sample Barcode | Tissue | Histology | Sex | Age | Stage | Therapy Types | Drugs | Outcome |
| COG7 | SNV | Missense_Mutation | rs757810496 | c.829G>A | p.Glu277Lys | p.E277K | P83436 | protein_coding | tolerated(0.39) | benign(0.033) | TCGA-A2-A0CL-01 | Breast | breast invasive carcinoma | Female | <65 | III/IV | Chemotherapy | cytoxan | SD |
| COG7 | SNV | Missense_Mutation | c.350G>C | p.Arg117Thr | p.R117T | P83436 | protein_coding | deleterious(0) | probably_damaging(0.995) | TCGA-BH-A18G-01 | Breast | breast invasive carcinoma | Female | >=65 | I/II | Unknown | Unknown | SD | |
| COG7 | SNV | Missense_Mutation | novel | c.11N>T | p.Ser4Phe | p.S4F | P83436 | protein_coding | deleterious(0) | probably_damaging(1) | TCGA-E2-A1LE-01 | Breast | breast invasive carcinoma | Female | >=65 | III/IV | Chemotherapy | herceptin | PD |
| COG7 | SNV | Missense_Mutation | c.1703N>A | p.Arg568Gln | p.R568Q | P83436 | protein_coding | tolerated(0.08) | possibly_damaging(0.778) | TCGA-E9-A1R4-01 | Breast | breast invasive carcinoma | Female | >=65 | I/II | Chemotherapy | 5-fluorouracil | SD | |
| COG7 | deletion | Frame_Shift_Del | novel | c.231delA | p.Lys77AsnfsTer7 | p.K77Nfs*7 | P83436 | protein_coding | TCGA-EW-A2FV-01 | Breast | breast invasive carcinoma | Female | <65 | III/IV | Chemotherapy | docetaxel | SD | ||
| COG7 | SNV | Missense_Mutation | c.1127N>T | p.Ala376Val | p.A376V | P83436 | protein_coding | tolerated(0.1) | benign(0.103) | TCGA-A6-6141-01 | Colorectum | colon adenocarcinoma | Male | <65 | I/II | Chemotherapy | 5-fu | SD | |
| COG7 | SNV | Missense_Mutation | rs745329738 | c.212N>A | p.Arg71His | p.R71H | P83436 | protein_coding | deleterious(0) | probably_damaging(0.915) | TCGA-AA-3864-01 | Colorectum | colon adenocarcinoma | Male | >=65 | I/II | Unknown | Unknown | SD |
| COG7 | SNV | Missense_Mutation | novel | c.1760T>C | p.Phe587Ser | p.F587S | P83436 | protein_coding | deleterious(0.02) | possibly_damaging(0.575) | TCGA-AA-3950-01 | Colorectum | colon adenocarcinoma | Female | >=65 | I/II | Unknown | Unknown | SD |
| COG7 | SNV | Missense_Mutation | rs764545607 | c.1090G>A | p.Asp364Asn | p.D364N | P83436 | protein_coding | tolerated(0.4) | benign(0.007) | TCGA-AA-3966-01 | Colorectum | colon adenocarcinoma | Female | >=65 | I/II | Unknown | Unknown | SD |
| COG7 | SNV | Missense_Mutation | c.454G>A | p.Ala152Thr | p.A152T | P83436 | protein_coding | tolerated(0.14) | possibly_damaging(0.597) | TCGA-AZ-6598-01 | Colorectum | colon adenocarcinoma | Female | >=65 | I/II | Unknown | Unknown | SD |
| Page: 1 2 3 4 5 6 |
Top |
Related drugs of malignant transformation related genes |
| Identification of chemicals and drugs interact with genes involved in malignant transfromation |
| (DGIdb 4.0) |
| Entrez ID | Symbol | Category | Interaction Types | Drug Claim Name | Drug Name | PMIDs |
| Page: 1 |

Copyright 2023-Present -The University of Texas Health Science Center at Houston |