
|
|||||
|
 | |
| |
| |
| |
| |
| |
|
Gene: COG6 |
Gene summary for COG6 |
| Gene information | Species | Human | Gene symbol | COG6 | Gene ID | 57511 |
| Gene name | component of oligomeric golgi complex 6 | |
| Gene Alias | CDG2L | |
| Cytomap | 13q14.11 | |
| Gene Type | protein-coding | GO ID | GO:0006810 | UniProtAcc | A0A140VJG7 |
Top |
Malignant transformation analysis |
| Identification of the aberrant gene expression in precancerous and cancerous lesions by comparing the gene expression of stem-like cells in diseased tissues with normal stem cells |
| Entrez ID | Symbol | Replicates | Species | Organ | Tissue | Adj P-value | Log2FC | Malignancy |
| 57511 | COG6 | LZE4T | Human | Esophagus | ESCC | 2.71e-04 | 1.78e-01 | 0.0811 |
| 57511 | COG6 | LZE24T | Human | Esophagus | ESCC | 4.88e-03 | 1.05e-01 | 0.0596 |
| 57511 | COG6 | P2T-E | Human | Esophagus | ESCC | 7.97e-19 | 2.11e-01 | 0.1177 |
| 57511 | COG6 | P4T-E | Human | Esophagus | ESCC | 2.51e-08 | 1.85e-01 | 0.1323 |
| 57511 | COG6 | P8T-E | Human | Esophagus | ESCC | 7.64e-19 | 2.83e-01 | 0.0889 |
| 57511 | COG6 | P9T-E | Human | Esophagus | ESCC | 8.00e-06 | 1.18e-01 | 0.1131 |
| 57511 | COG6 | P10T-E | Human | Esophagus | ESCC | 8.08e-17 | 3.08e-01 | 0.116 |
| 57511 | COG6 | P11T-E | Human | Esophagus | ESCC | 2.36e-11 | 3.32e-01 | 0.1426 |
| 57511 | COG6 | P12T-E | Human | Esophagus | ESCC | 2.06e-04 | 7.06e-02 | 0.1122 |
| 57511 | COG6 | P15T-E | Human | Esophagus | ESCC | 2.88e-05 | 1.75e-01 | 0.1149 |
| 57511 | COG6 | P16T-E | Human | Esophagus | ESCC | 1.51e-14 | 2.08e-01 | 0.1153 |
| 57511 | COG6 | P17T-E | Human | Esophagus | ESCC | 1.63e-03 | 1.46e-01 | 0.1278 |
| 57511 | COG6 | P20T-E | Human | Esophagus | ESCC | 1.85e-04 | 9.59e-02 | 0.1124 |
| 57511 | COG6 | P21T-E | Human | Esophagus | ESCC | 5.30e-07 | 1.46e-01 | 0.1617 |
| 57511 | COG6 | P23T-E | Human | Esophagus | ESCC | 5.38e-09 | 2.46e-01 | 0.108 |
| 57511 | COG6 | P24T-E | Human | Esophagus | ESCC | 5.72e-04 | 1.54e-01 | 0.1287 |
| 57511 | COG6 | P26T-E | Human | Esophagus | ESCC | 1.15e-13 | 2.56e-01 | 0.1276 |
| 57511 | COG6 | P27T-E | Human | Esophagus | ESCC | 4.16e-10 | 2.00e-01 | 0.1055 |
| 57511 | COG6 | P28T-E | Human | Esophagus | ESCC | 7.36e-05 | 1.15e-01 | 0.1149 |
| 57511 | COG6 | P30T-E | Human | Esophagus | ESCC | 8.36e-11 | 3.59e-01 | 0.137 |
| Page: 1 2 3 |
| Tissue | Expression Dynamics | Abbreviation |
| Esophagus | 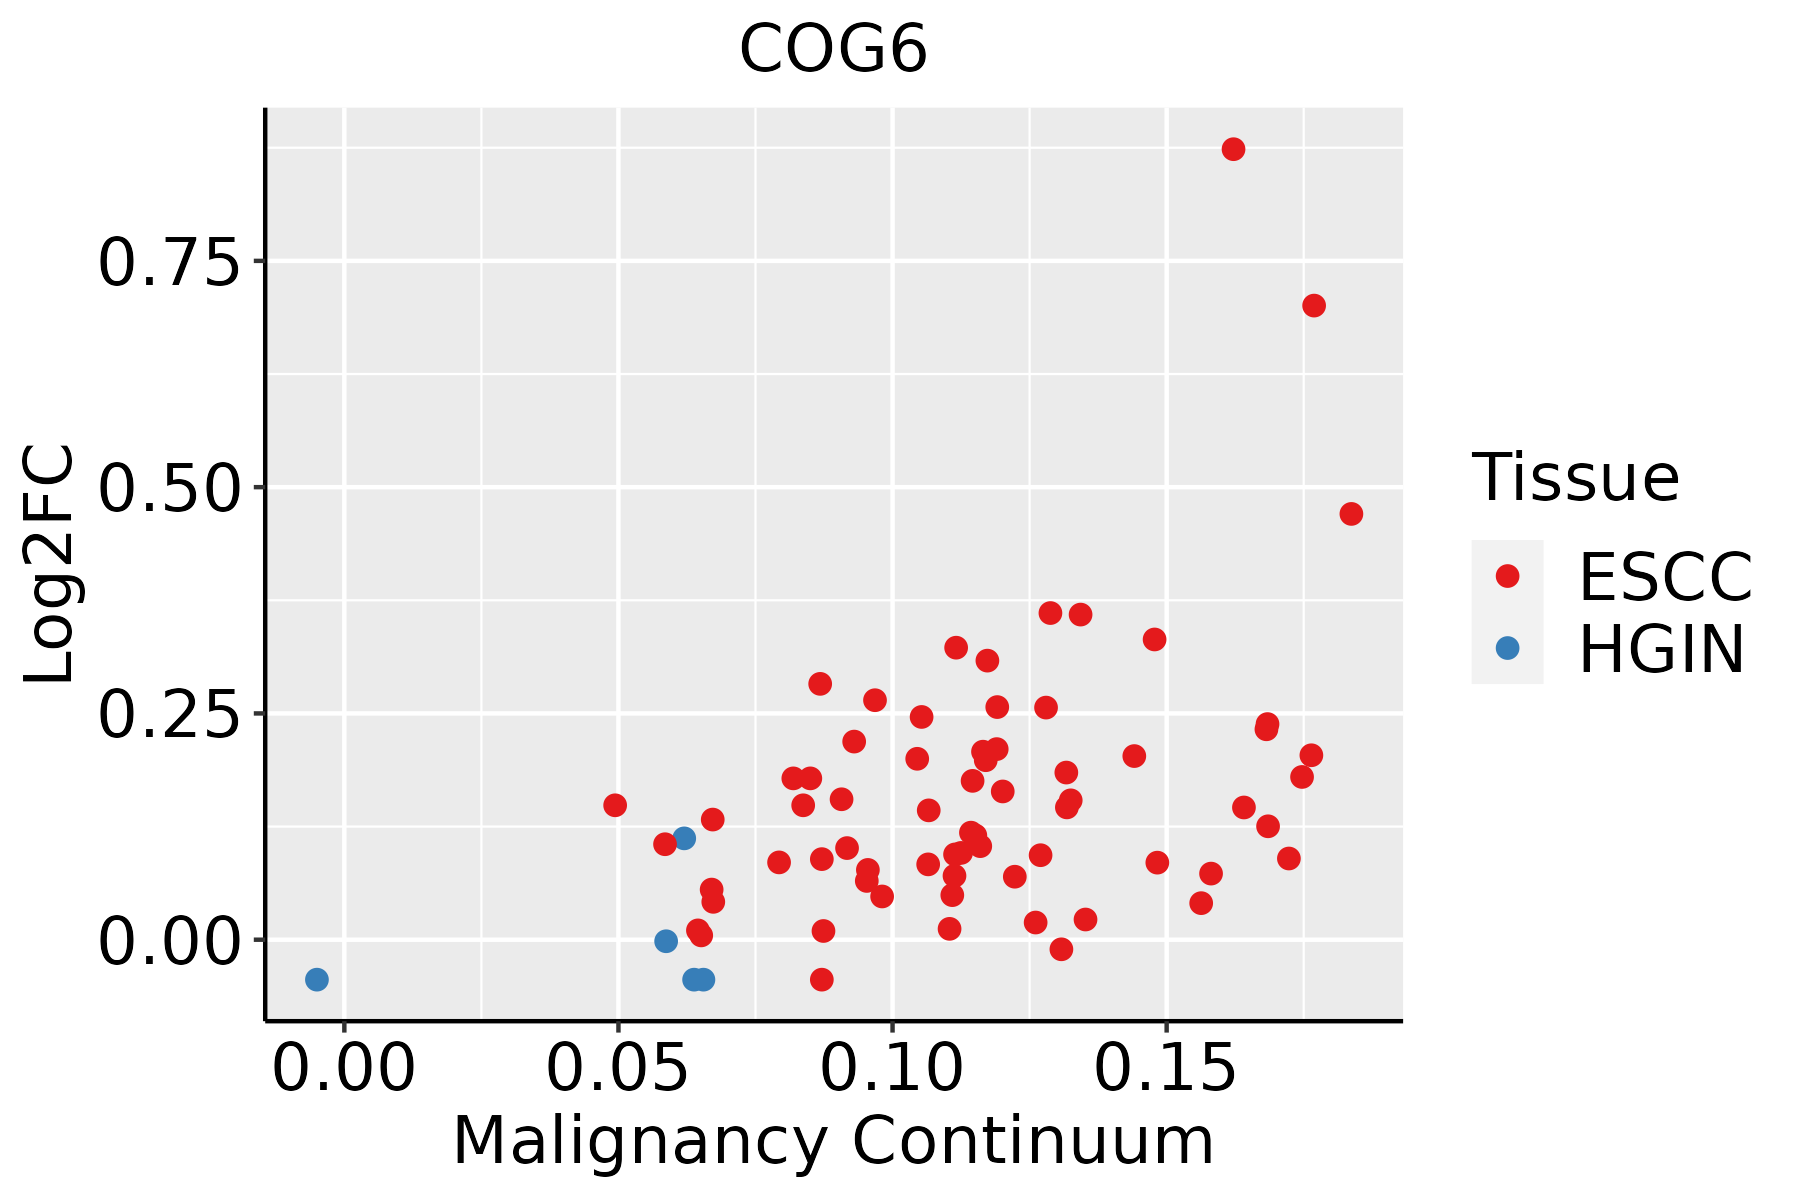 | ESCC: Esophageal squamous cell carcinoma |
| HGIN: High-grade intraepithelial neoplasias | ||
| LGIN: Low-grade intraepithelial neoplasias |
| ∗log2FC in expression of this searched gene in stem-like cells from each diseased tissue sample relative to stem-like cells in normal samples in each tissue plotted against the malignancy continuum. Samples are colored based on if they are from different disease stage. |
Top |
Malignant transformation related pathway analysis |
| Find out the enriched GO biological processes and KEGG pathways involved in transition from healthy to precancer to cancer |
| Tissue | Disease Stage | Enriched GO biological Processes |
| Colorectum | AD |  |
| Colorectum | SER |  |
| Colorectum | MSS |  |
| Colorectum | MSI-H |  |
| Colorectum | FAP |  |
| ∗Top 15 enriched GO BP terms are showed in the bar plot of each disease state in each tissue. Each row represents a significant GO biological process which is colored according to the -log10(p.adjust). |
| Page: 1 2 3 4 5 6 7 8 9 |
| GO ID | Tissue | Disease Stage | Description | Gene Ratio | Bg Ratio | pvalue | p.adjust | Count |
| GO:004819318 | Esophagus | ESCC | Golgi vesicle transport | 231/8552 | 296/18723 | 1.82e-30 | 9.63e-28 | 231 |
| GO:00700854 | Esophagus | ESCC | glycosylation | 144/8552 | 240/18723 | 5.12e-06 | 5.38e-05 | 144 |
| GO:00068914 | Esophagus | ESCC | intra-Golgi vesicle-mediated transport | 26/8552 | 33/18723 | 1.06e-04 | 7.43e-04 | 26 |
| Page: 1 |
| Pathway ID | Tissue | Disease Stage | Description | Gene Ratio | Bg Ratio | pvalue | p.adjust | qvalue | Count |
| Page: 1 |
Top |
Cell-cell communication analysis |
| Identification of potential cell-cell interactions between two cell types and their ligand-receptor pairs for different disease states |
| Ligand | Receptor | LRpair | Pathway | Tissue | Disease Stage |
| Page: 1 |
Top |
Single-cell gene regulatory network inference analysis |
| Find out the significant the regulons (TFs) and the target genes of each regulon across cell types for different disease states |
| TF | Cell Type | Tissue | Disease Stage | Target Gene | RSS | Regulon Activity |
| ∗The dot plots of a searched regulon are shown for all cell subpopulations in each disease state of each tissue based on the regulon specific score inferred using pySCENIC and by calculating the average expression. |
| Page: 1 |
Top |
Somatic mutation of malignant transformation related genes |
| Annotation of somatic variants for genes involved in malignant transformation |
| Hugo Symbol | Variant Class | Variant Classification | dbSNP RS | HGVSc | HGVSp | HGVSp Short | SWISSPROT | BIOTYPE | SIFT | PolyPhen | Tumor Sample Barcode | Tissue | Histology | Sex | Age | Stage | Therapy Types | Drugs | Outcome |
| COG6 | SNV | Missense_Mutation | c.605N>G | p.Thr202Arg | p.T202R | Q9Y2V7 | protein_coding | deleterious(0) | possibly_damaging(0.717) | TCGA-D8-A13Z-01 | Breast | breast invasive carcinoma | Female | <65 | I/II | Chemotherapy | doxorubicine | SD | |
| COG6 | deletion | Frame_Shift_Del | novel | c.1804delN | p.Leu603PhefsTer2 | p.L603Ffs*2 | Q9Y2V7 | protein_coding | TCGA-EW-A2FV-01 | Breast | breast invasive carcinoma | Female | <65 | III/IV | Chemotherapy | docetaxel | SD | ||
| COG6 | SNV | Missense_Mutation | rs775668471 | c.361C>T | p.Arg121Cys | p.R121C | Q9Y2V7 | protein_coding | deleterious(0) | probably_damaging(0.964) | TCGA-2W-A8YY-01 | Cervix | cervical & endocervical cancer | Female | <65 | I/II | Chemotherapy | cisplatin | CR |
| COG6 | SNV | Missense_Mutation | novel | c.373G>A | p.Ala125Thr | p.A125T | Q9Y2V7 | protein_coding | tolerated(0.8) | benign(0.007) | TCGA-2W-A8YY-01 | Cervix | cervical & endocervical cancer | Female | <65 | I/II | Chemotherapy | cisplatin | CR |
| COG6 | SNV | Missense_Mutation | novel | c.911C>T | p.Pro304Leu | p.P304L | Q9Y2V7 | protein_coding | deleterious(0) | probably_damaging(0.999) | TCGA-2W-A8YY-01 | Cervix | cervical & endocervical cancer | Female | <65 | I/II | Chemotherapy | cisplatin | CR |
| COG6 | SNV | Missense_Mutation | novel | c.1726N>C | p.Val576Leu | p.V576L | Q9Y2V7 | protein_coding | tolerated(0.33) | benign(0.001) | TCGA-VS-A8QC-01 | Cervix | cervical & endocervical cancer | Female | <65 | I/II | Chemotherapy | paclitaxel | PD |
| COG6 | SNV | Missense_Mutation | rs780630711 | c.1562N>A | p.Arg521His | p.R521H | Q9Y2V7 | protein_coding | deleterious(0.03) | benign(0.184) | TCGA-5M-AAT6-01 | Colorectum | colon adenocarcinoma | Female | <65 | III/IV | Unknown | Unknown | PD |
| COG6 | SNV | Missense_Mutation | novel | c.1730N>T | p.Thr577Ile | p.T577I | Q9Y2V7 | protein_coding | deleterious(0.03) | benign(0.023) | TCGA-AA-3949-01 | Colorectum | colon adenocarcinoma | Female | >=65 | III/IV | Unknown | Unknown | SD |
| COG6 | SNV | Missense_Mutation | c.803N>C | p.Glu268Ala | p.E268A | Q9Y2V7 | protein_coding | deleterious(0.04) | probably_damaging(0.997) | TCGA-AA-A00N-01 | Colorectum | colon adenocarcinoma | Male | >=65 | I/II | Unknown | Unknown | PD | |
| COG6 | SNV | Missense_Mutation | c.433N>G | p.Lys145Glu | p.K145E | Q9Y2V7 | protein_coding | deleterious(0.04) | benign(0.005) | TCGA-CK-4951-01 | Colorectum | colon adenocarcinoma | Female | >=65 | I/II | Unknown | Unknown | PD |
| Page: 1 2 3 4 5 6 |
Top |
Related drugs of malignant transformation related genes |
| Identification of chemicals and drugs interact with genes involved in malignant transfromation |
| (DGIdb 4.0) |
| Entrez ID | Symbol | Category | Interaction Types | Drug Claim Name | Drug Name | PMIDs |
| Page: 1 |

Copyright 2023-Present -The University of Texas Health Science Center at Houston |