
|
|||||
|
 | |
| |
| |
| |
| |
| |
|
Gene: COG5 |
Gene summary for COG5 |
| Gene information | Species | Human | Gene symbol | COG5 | Gene ID | 10466 |
| Gene name | component of oligomeric golgi complex 5 | |
| Gene Alias | CDG2I | |
| Cytomap | 7q22.3 | |
| Gene Type | protein-coding | GO ID | GO:0006810 | UniProtAcc | Q9UP83 |
Top |
Malignant transformation analysis |
| Identification of the aberrant gene expression in precancerous and cancerous lesions by comparing the gene expression of stem-like cells in diseased tissues with normal stem cells |
| Entrez ID | Symbol | Replicates | Species | Organ | Tissue | Adj P-value | Log2FC | Malignancy |
| 10466 | COG5 | CCI_1 | Human | Cervix | CC | 2.66e-11 | 1.23e+00 | 0.528 |
| 10466 | COG5 | CCI_2 | Human | Cervix | CC | 2.10e-11 | 9.99e-01 | 0.5249 |
| 10466 | COG5 | CCI_3 | Human | Cervix | CC | 6.50e-19 | 1.14e+00 | 0.516 |
| 10466 | COG5 | HTA11_3410_2000001011 | Human | Colorectum | AD | 7.64e-17 | -6.04e-01 | 0.0155 |
| 10466 | COG5 | HTA11_2487_2000001011 | Human | Colorectum | SER | 4.68e-03 | -4.00e-01 | -0.1808 |
| 10466 | COG5 | HTA11_2951_2000001011 | Human | Colorectum | AD | 3.08e-07 | -1.06e+00 | 0.0216 |
| 10466 | COG5 | HTA11_347_2000001011 | Human | Colorectum | AD | 6.52e-04 | 3.95e-01 | -0.1954 |
| 10466 | COG5 | HTA11_3361_2000001011 | Human | Colorectum | AD | 2.63e-09 | -6.48e-01 | -0.1207 |
| 10466 | COG5 | HTA11_866_3004761011 | Human | Colorectum | AD | 5.31e-07 | -5.65e-01 | 0.096 |
| 10466 | COG5 | HTA11_10711_2000001011 | Human | Colorectum | AD | 2.56e-07 | -6.29e-01 | 0.0338 |
| 10466 | COG5 | HTA11_7696_3000711011 | Human | Colorectum | AD | 6.39e-04 | -3.56e-01 | 0.0674 |
| 10466 | COG5 | HTA11_99999970781_79442 | Human | Colorectum | MSS | 4.15e-05 | -3.37e-01 | 0.294 |
| 10466 | COG5 | HTA11_99999965104_69814 | Human | Colorectum | MSS | 2.21e-10 | 8.73e-01 | 0.281 |
| 10466 | COG5 | HTA11_99999974143_84620 | Human | Colorectum | MSS | 7.15e-17 | -5.80e-01 | 0.3005 |
| 10466 | COG5 | F007 | Human | Colorectum | FAP | 7.45e-04 | -3.95e-01 | 0.1176 |
| 10466 | COG5 | A001-C-207 | Human | Colorectum | FAP | 5.89e-04 | -2.53e-01 | 0.1278 |
| 10466 | COG5 | A015-C-203 | Human | Colorectum | FAP | 3.24e-44 | -7.06e-01 | -0.1294 |
| 10466 | COG5 | A015-C-204 | Human | Colorectum | FAP | 7.57e-10 | -4.62e-01 | -0.0228 |
| 10466 | COG5 | A014-C-040 | Human | Colorectum | FAP | 3.42e-07 | -4.59e-01 | -0.1184 |
| 10466 | COG5 | A002-C-201 | Human | Colorectum | FAP | 2.80e-20 | -5.52e-01 | 0.0324 |
| Page: 1 2 3 4 5 6 7 8 9 10 |
| Tissue | Expression Dynamics | Abbreviation |
| Cervix | 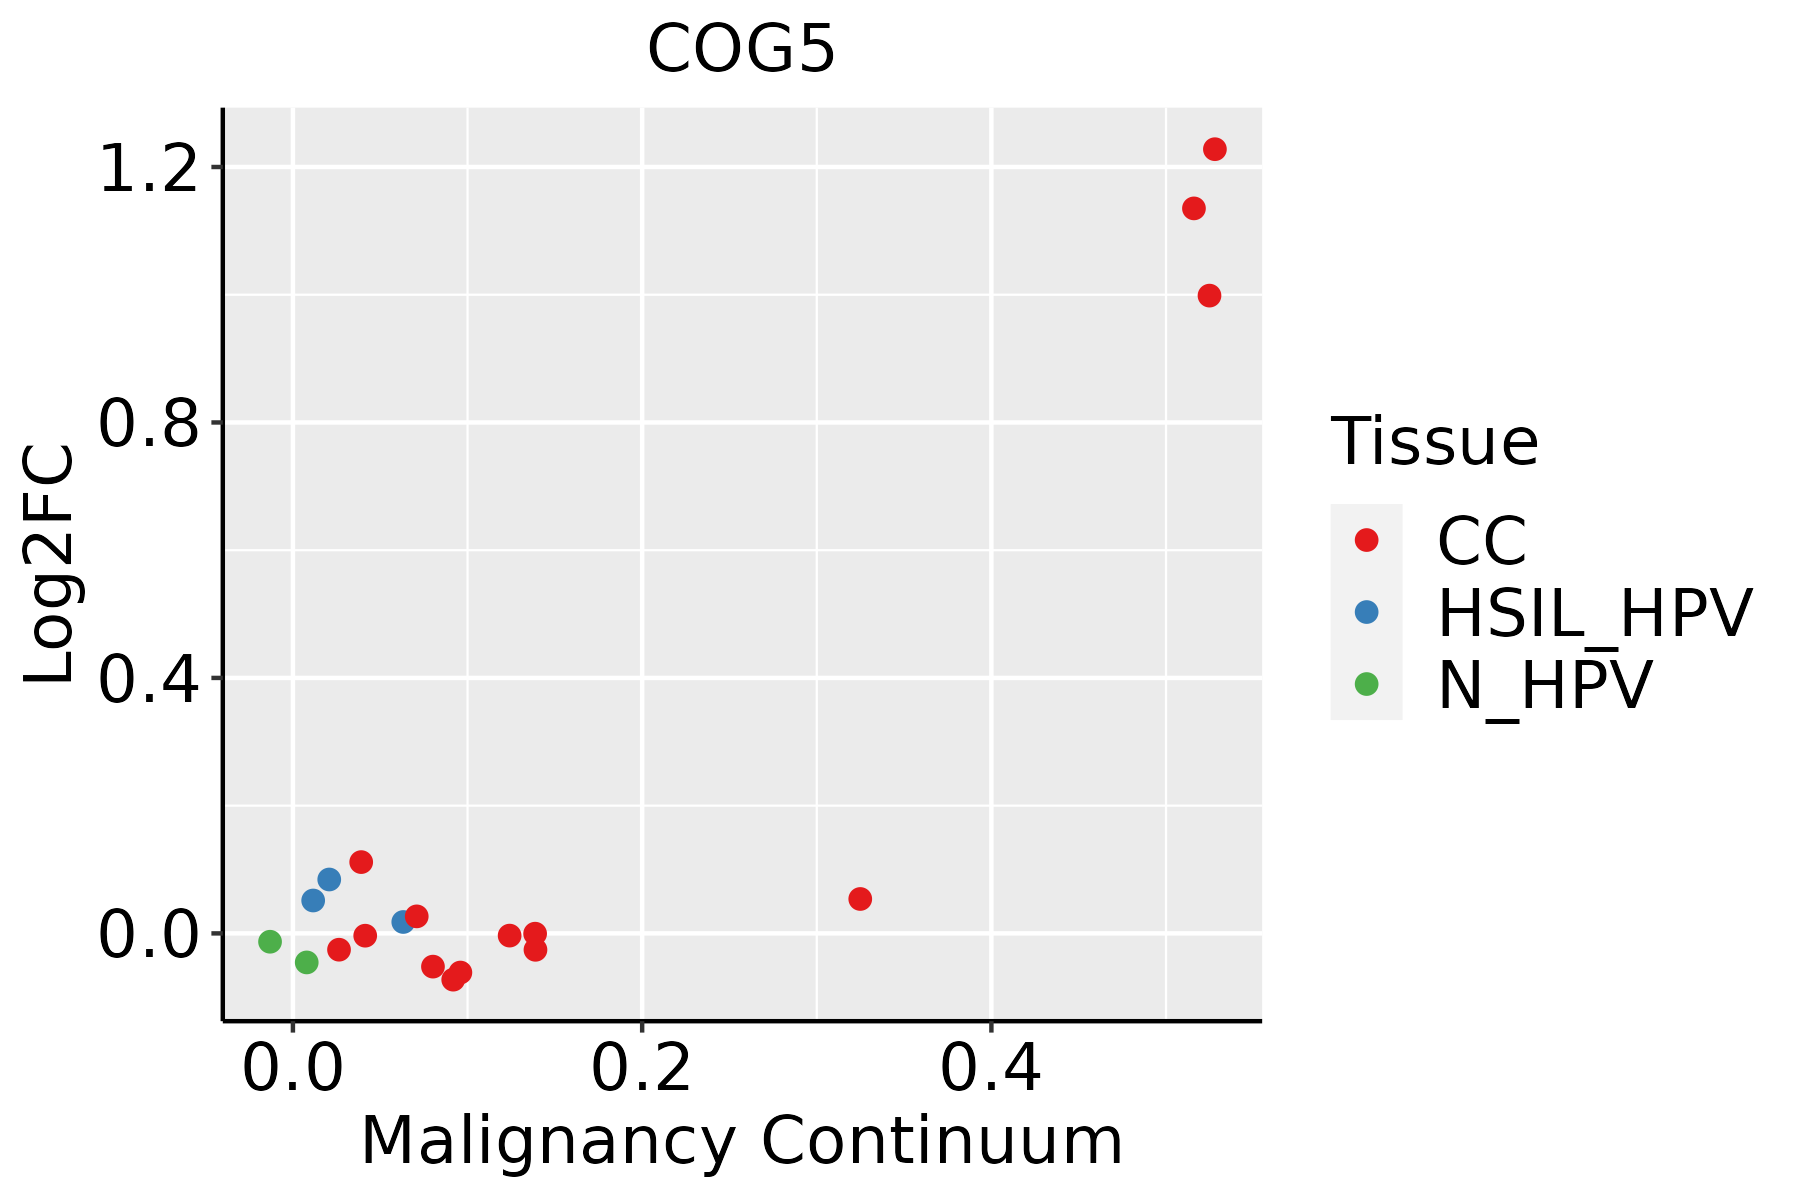 | CC: Cervix cancer |
| HSIL_HPV: HPV-infected high-grade squamous intraepithelial lesions | ||
| N_HPV: HPV-infected normal cervix | ||
| Colorectum (GSE201348) |  | FAP: Familial adenomatous polyposis |
| CRC: Colorectal cancer | ||
| Colorectum (HTA11) |  | AD: Adenomas |
| SER: Sessile serrated lesions | ||
| MSI-H: Microsatellite-high colorectal cancer | ||
| MSS: Microsatellite stable colorectal cancer | ||
| Endometrium | 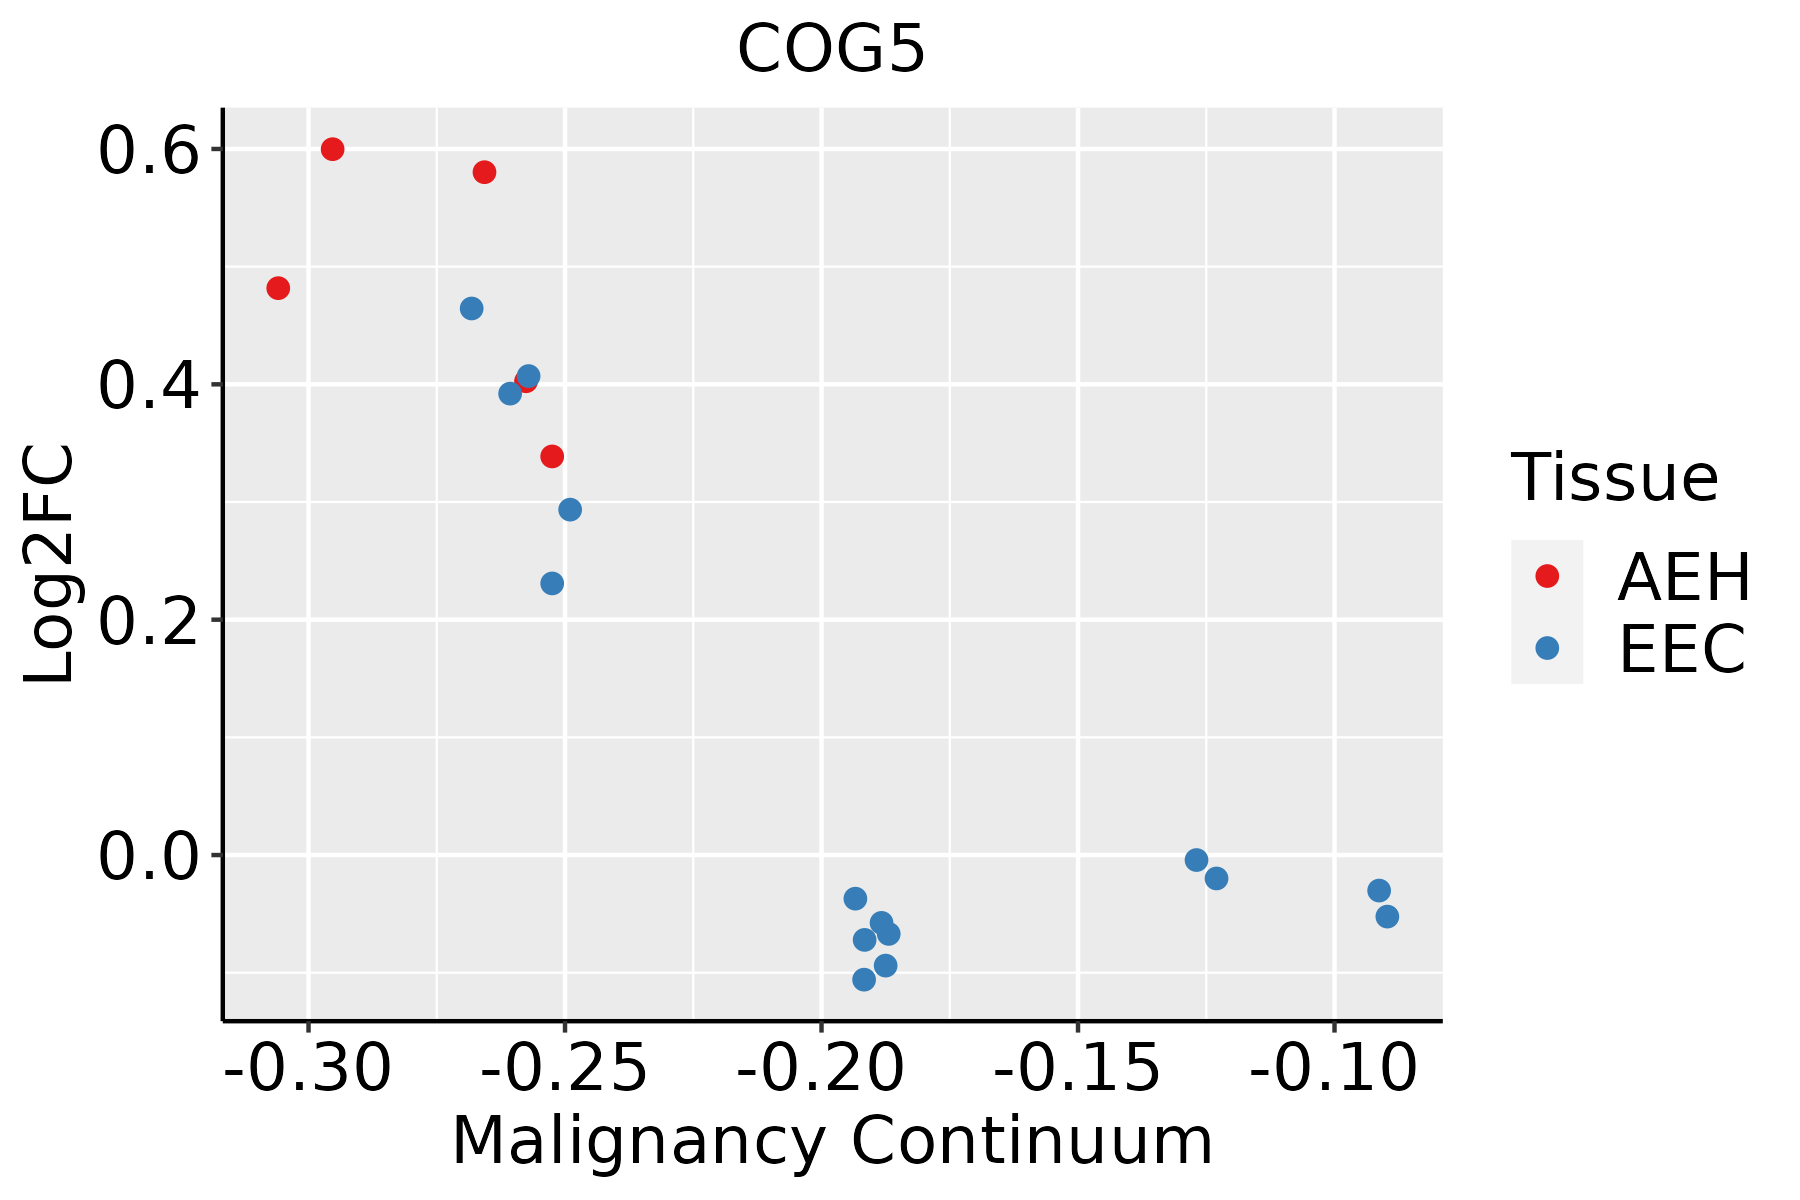 | AEH: Atypical endometrial hyperplasia |
| EEC: Endometrioid Cancer | ||
| Esophagus | 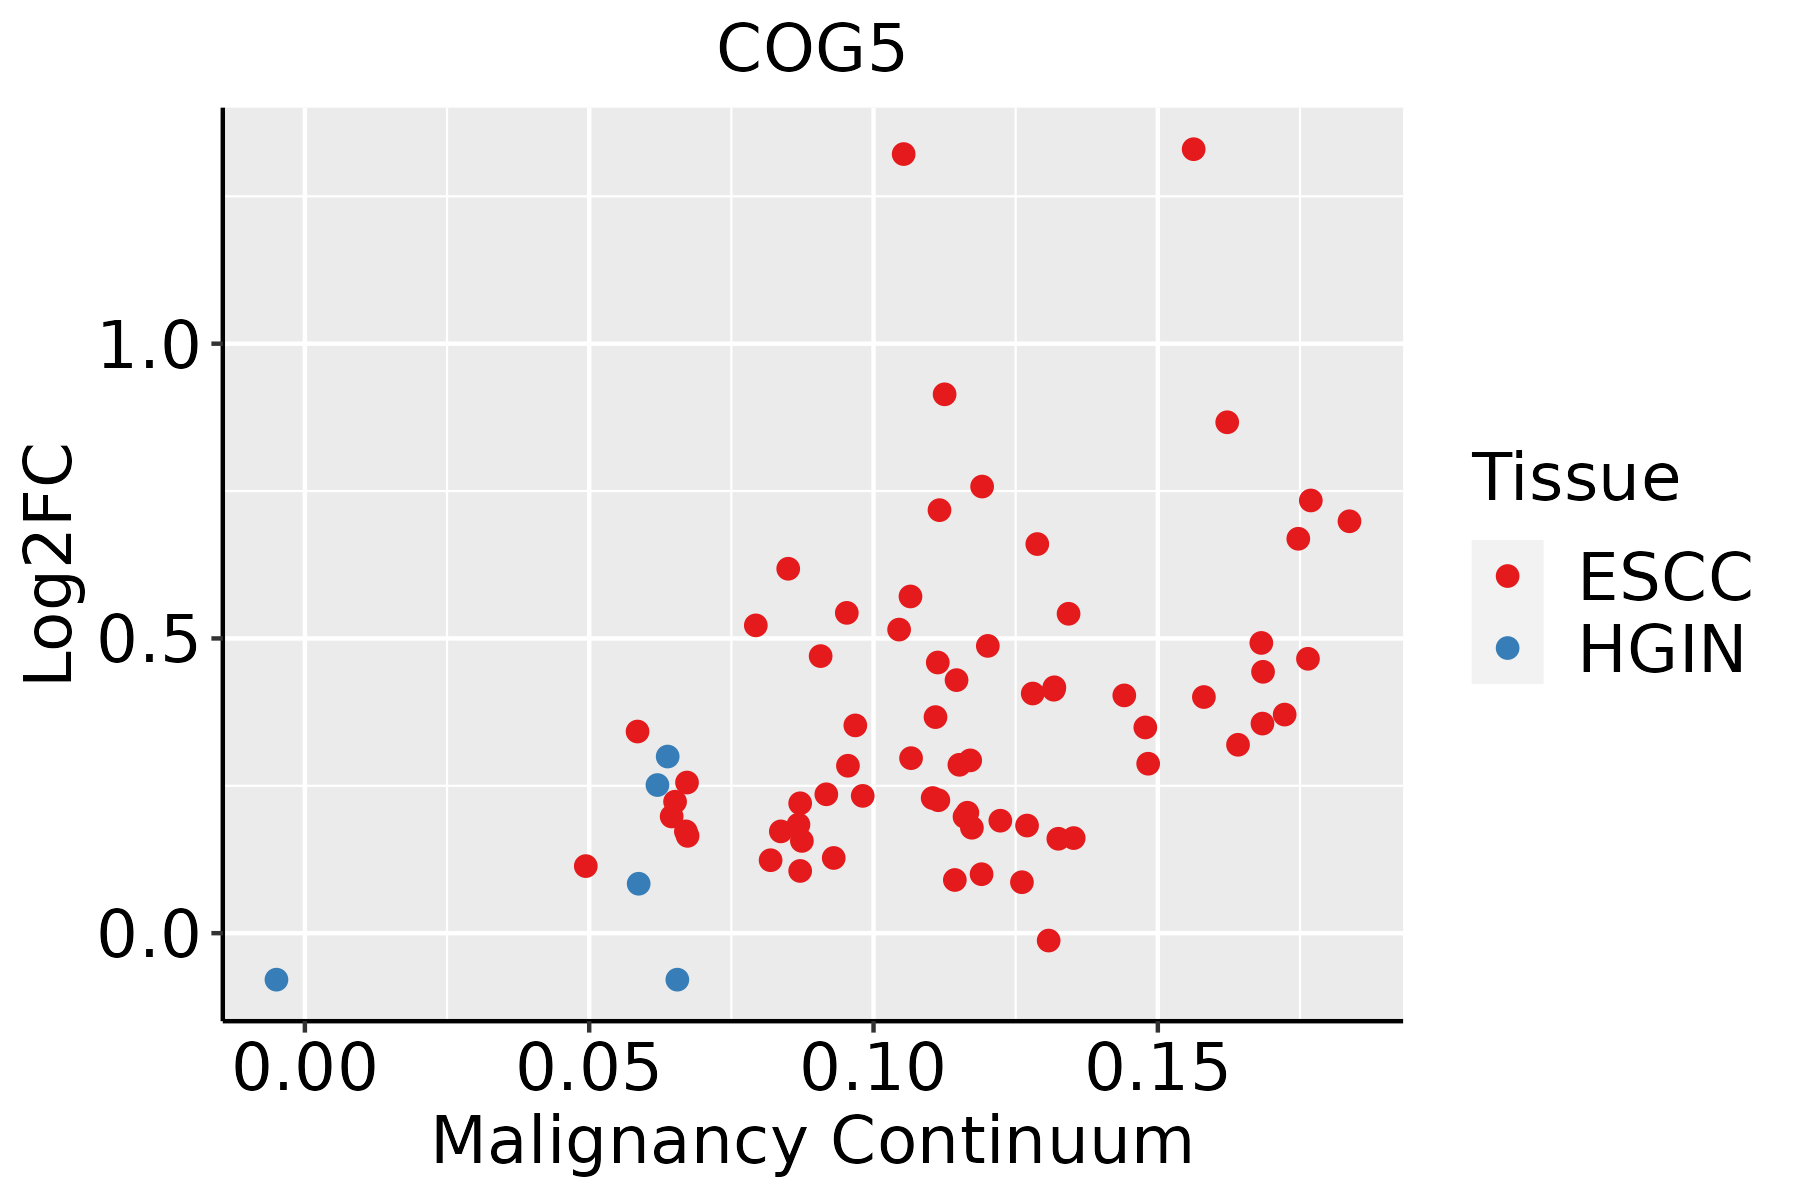 | ESCC: Esophageal squamous cell carcinoma |
| HGIN: High-grade intraepithelial neoplasias | ||
| LGIN: Low-grade intraepithelial neoplasias | ||
| Liver | 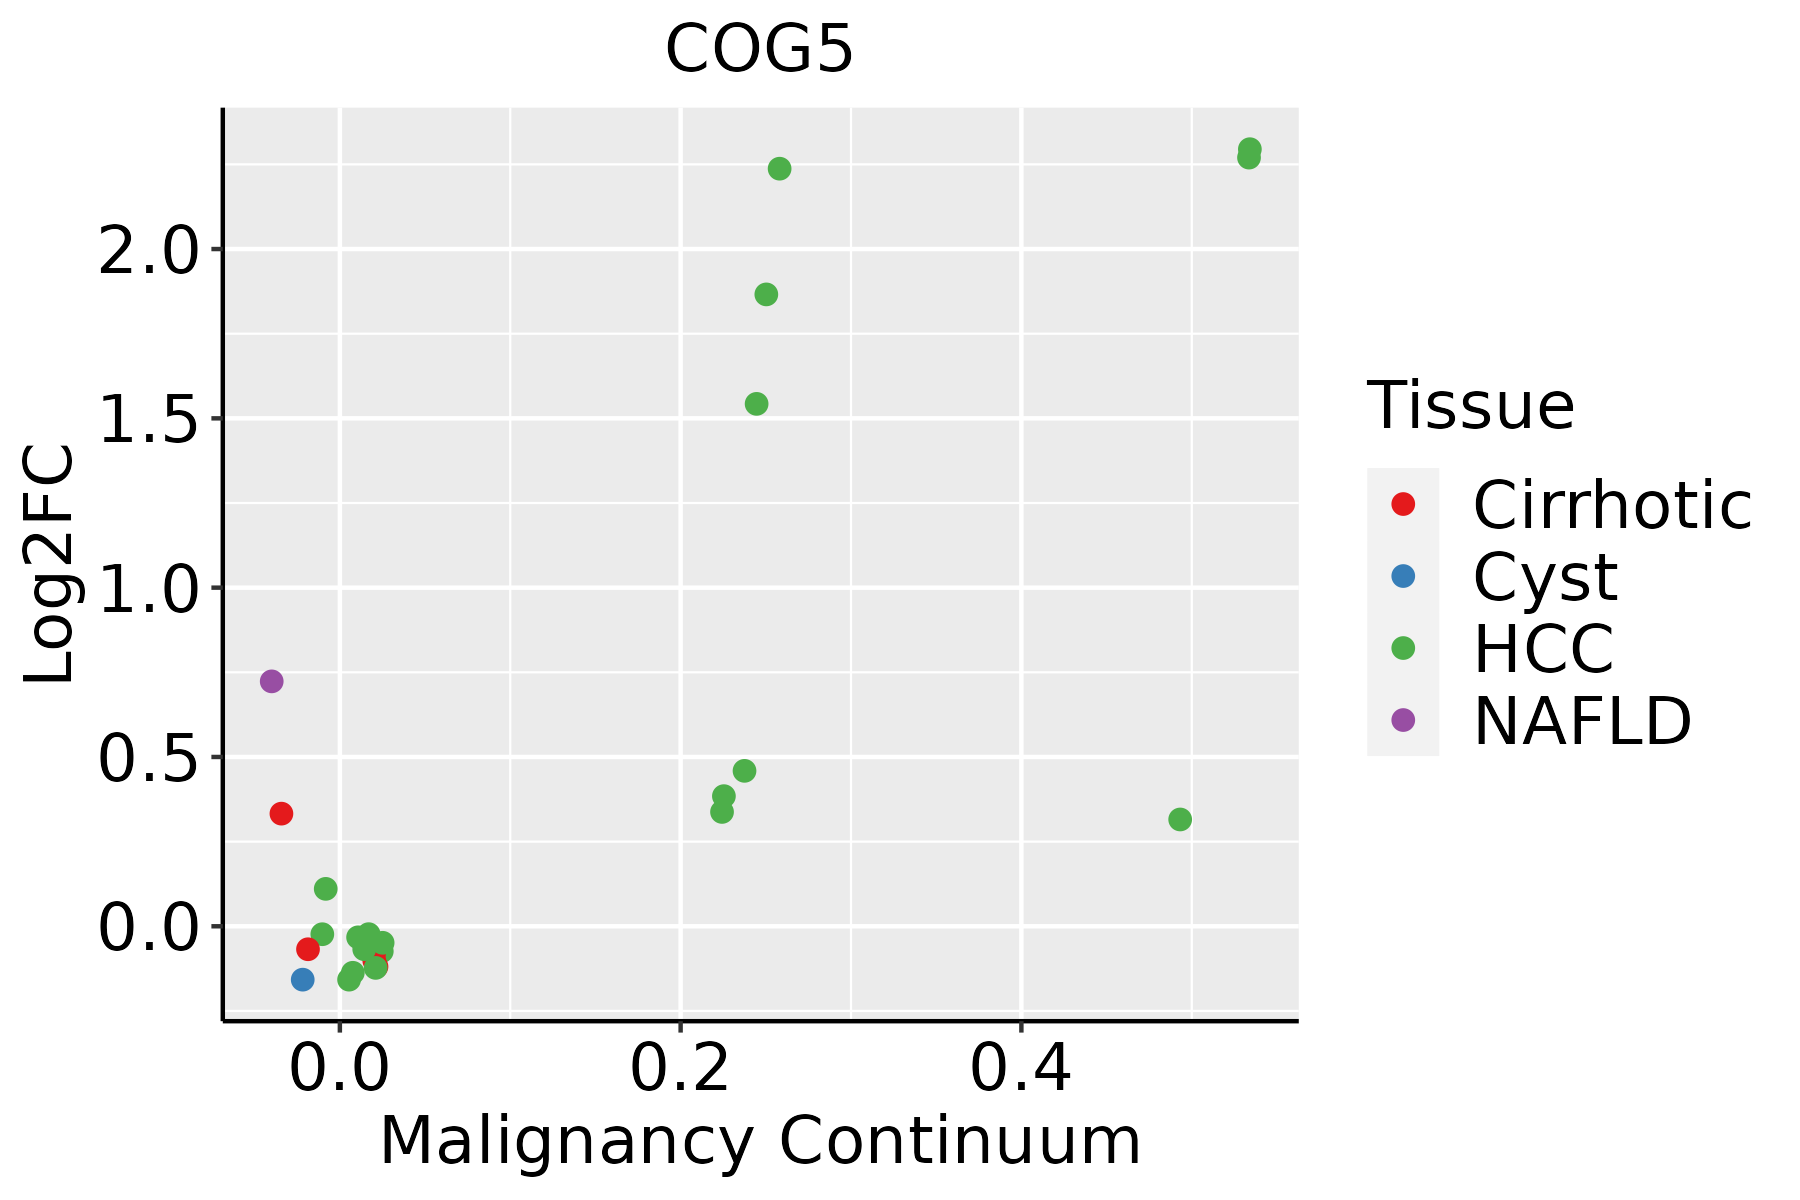 | HCC: Hepatocellular carcinoma |
| NAFLD: Non-alcoholic fatty liver disease | ||
| Lung | 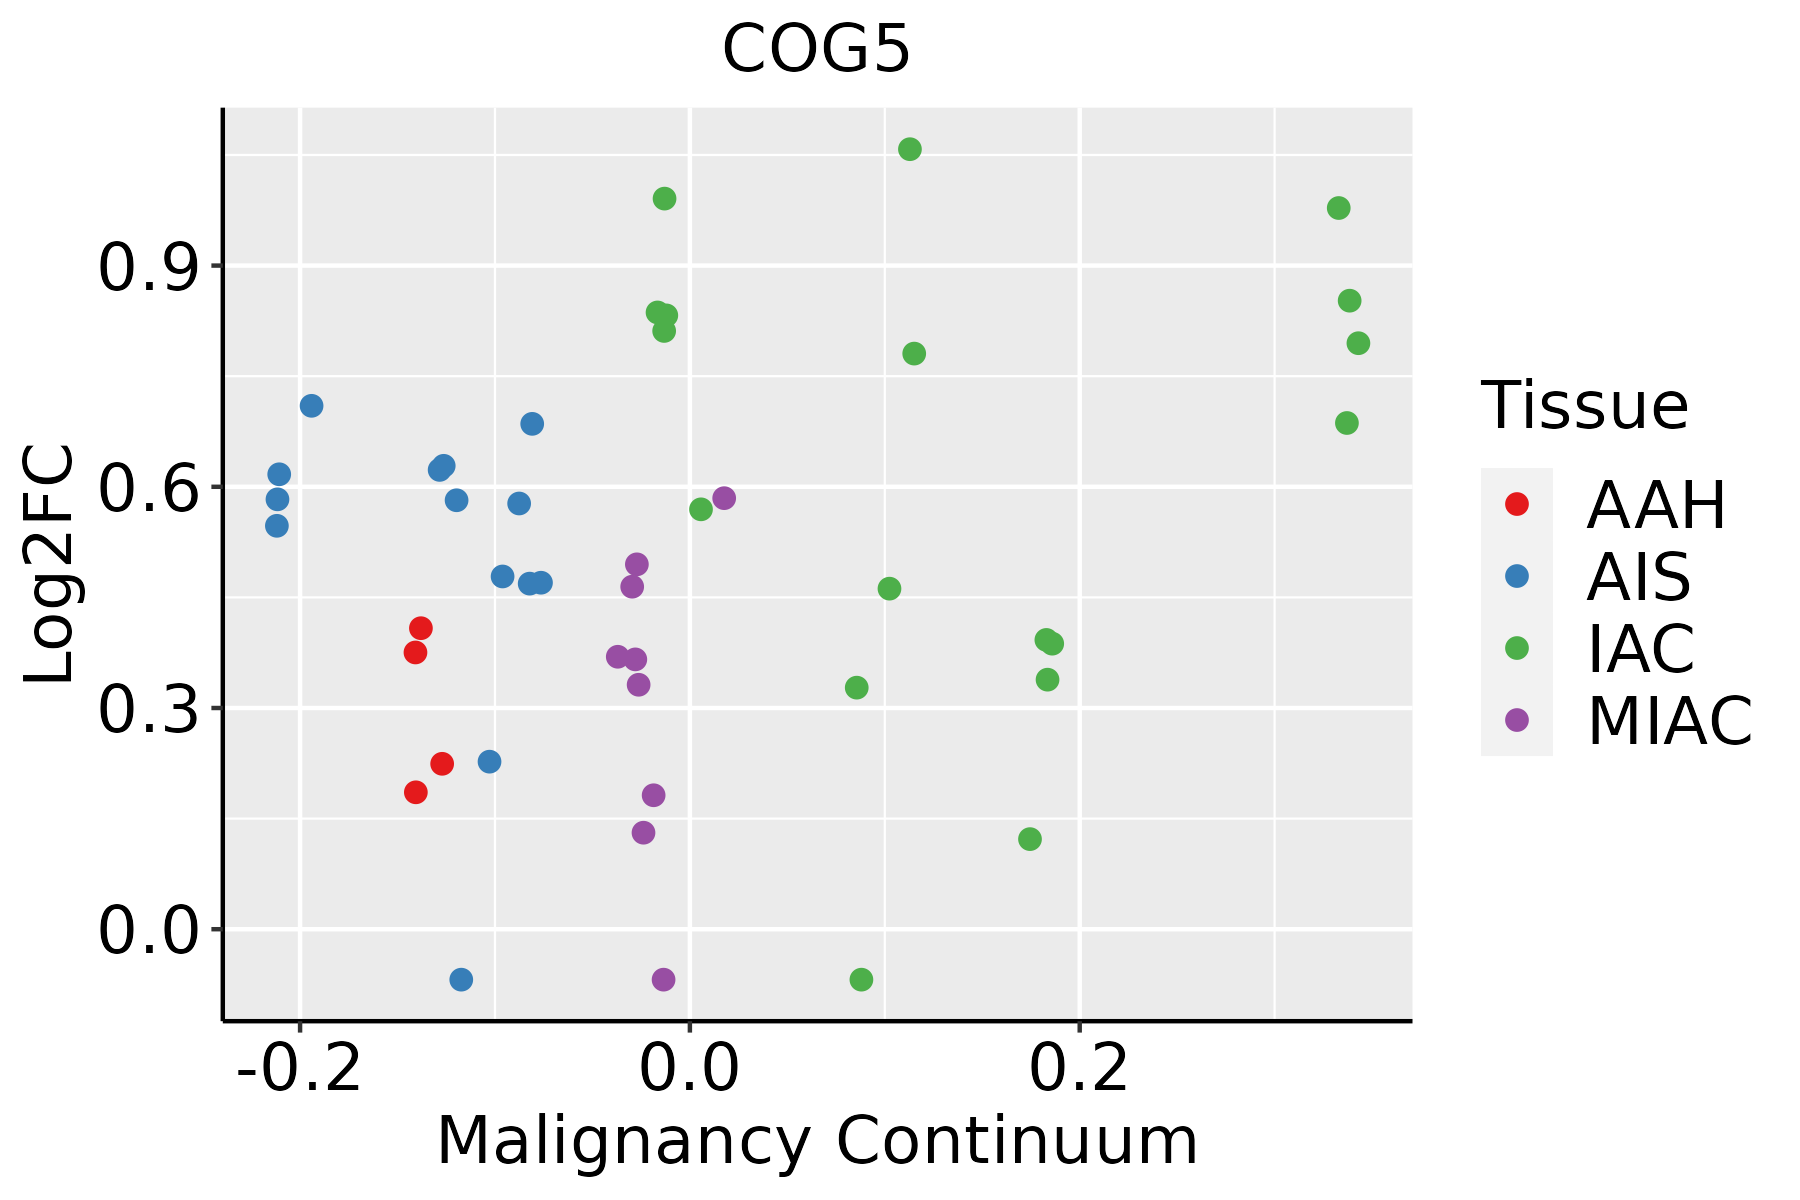 | AAH: Atypical adenomatous hyperplasia |
| AIS: Adenocarcinoma in situ | ||
| IAC: Invasive lung adenocarcinoma | ||
| MIA: Minimally invasive adenocarcinoma | ||
| Oral Cavity | 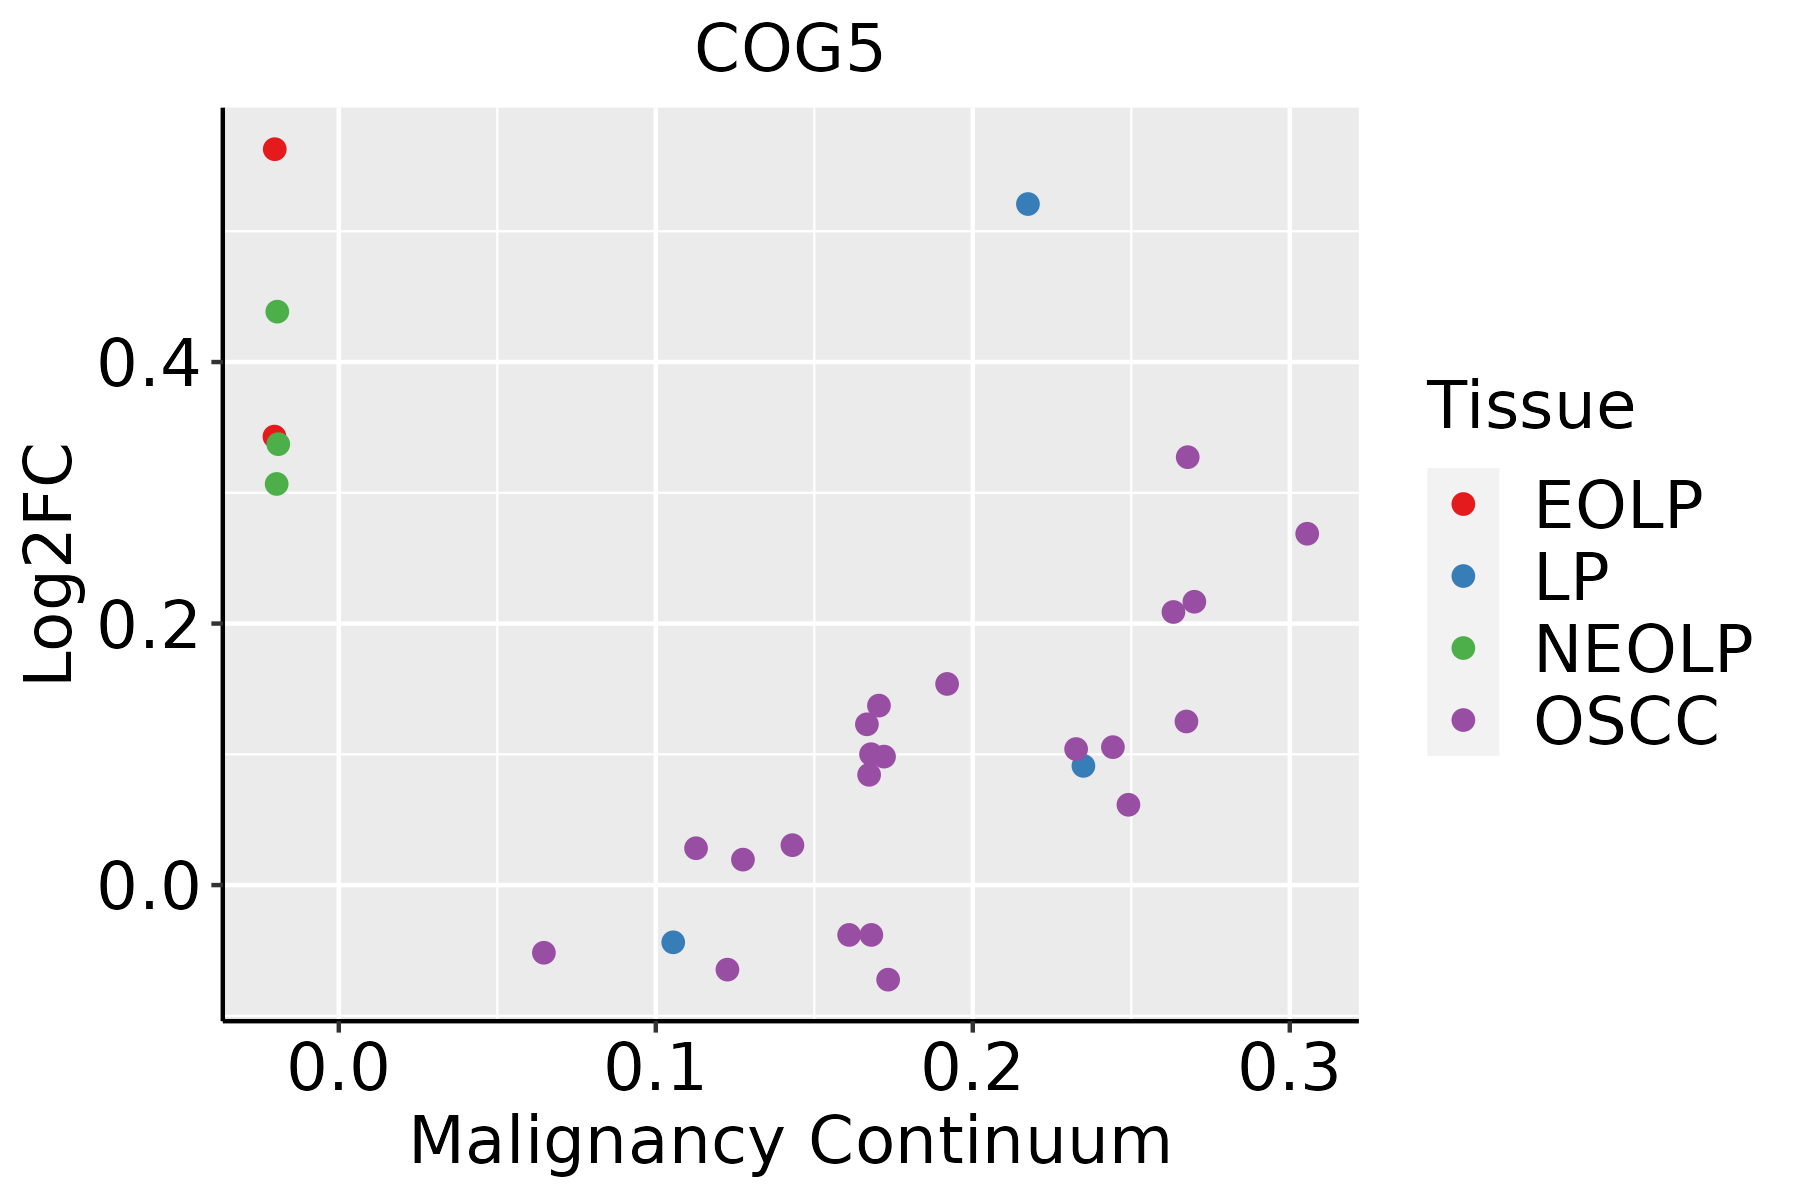 | EOLP: Erosive Oral lichen planus |
| LP: leukoplakia | ||
| NEOLP: Non-erosive oral lichen planus | ||
| OSCC: Oral squamous cell carcinoma | ||
| Prostate | 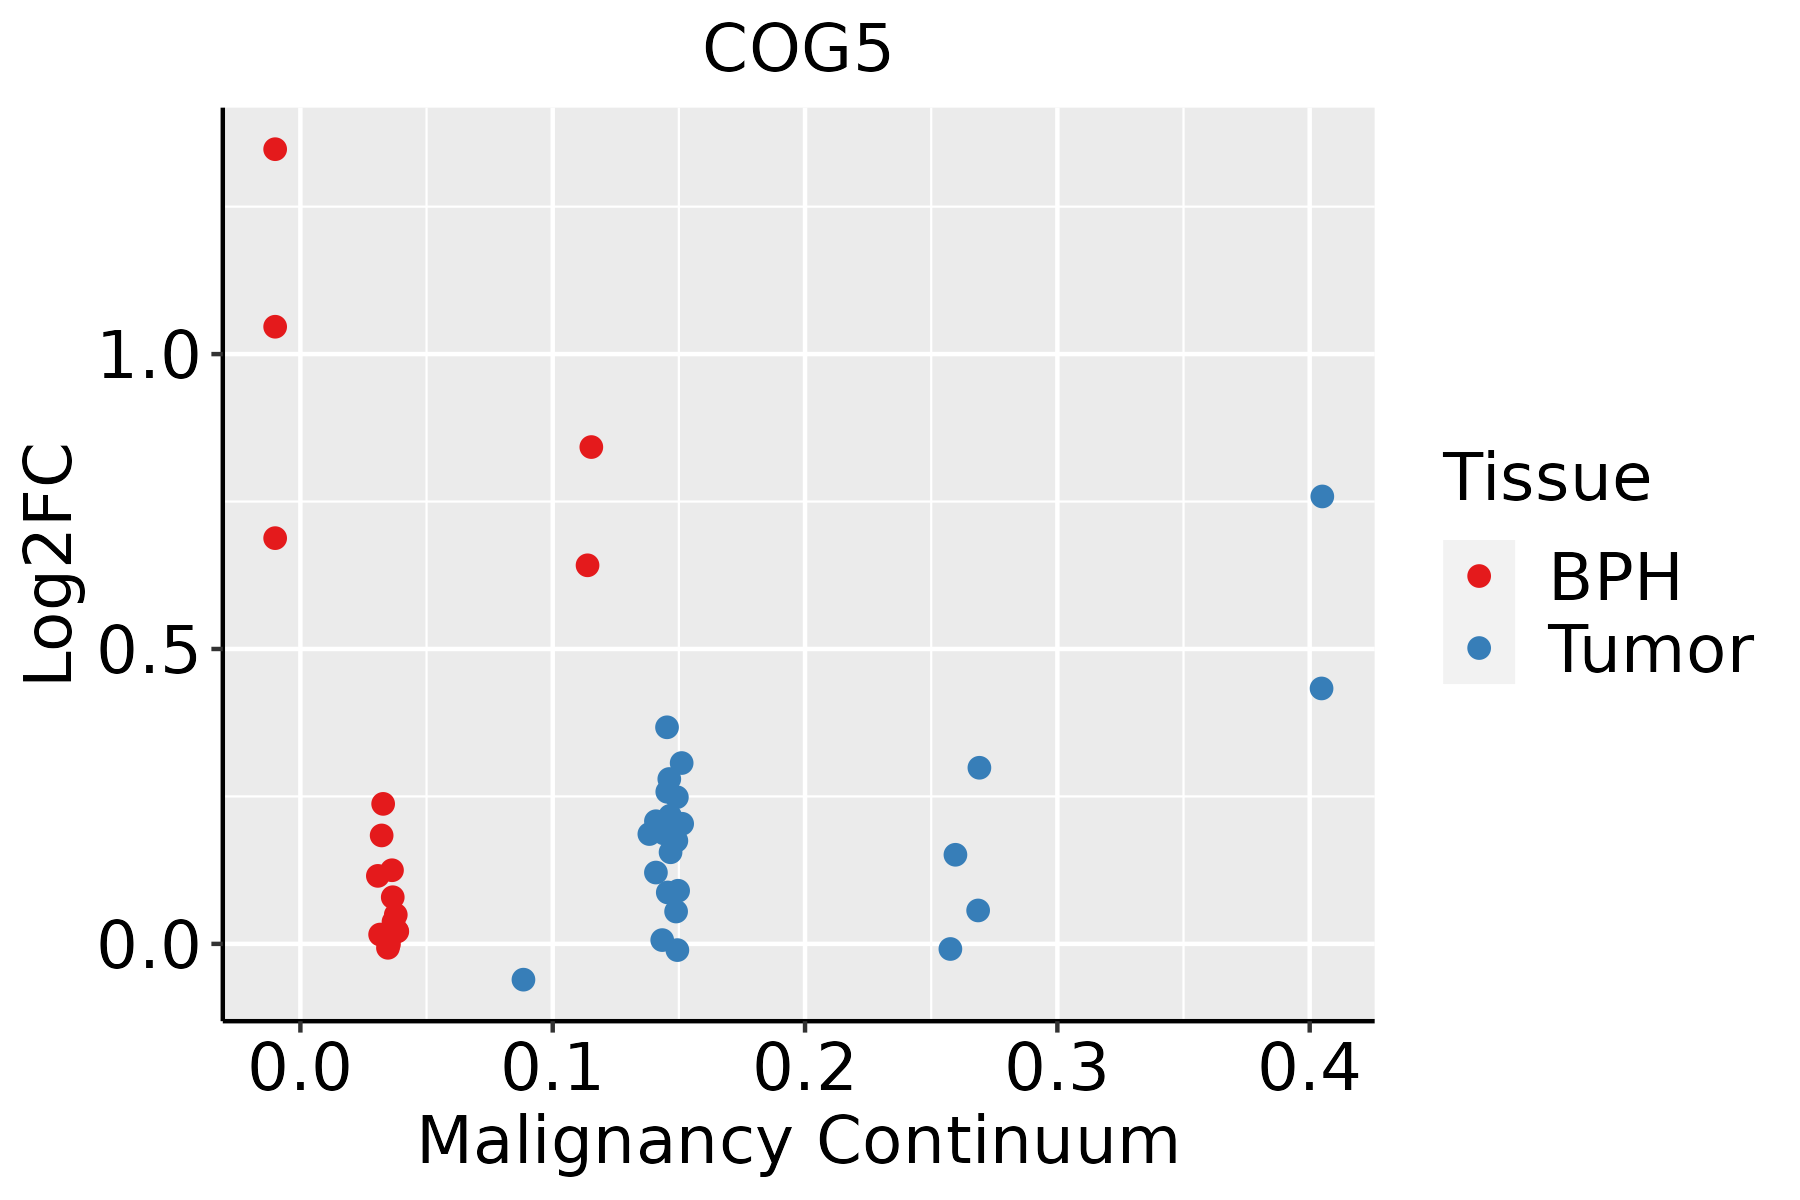 | BPH: Benign Prostatic Hyperplasia |
| Skin |  | AK: Actinic keratosis |
| cSCC: Cutaneous squamous cell carcinoma | ||
| SCCIS:squamous cell carcinoma in situ | ||
| Thyroid | 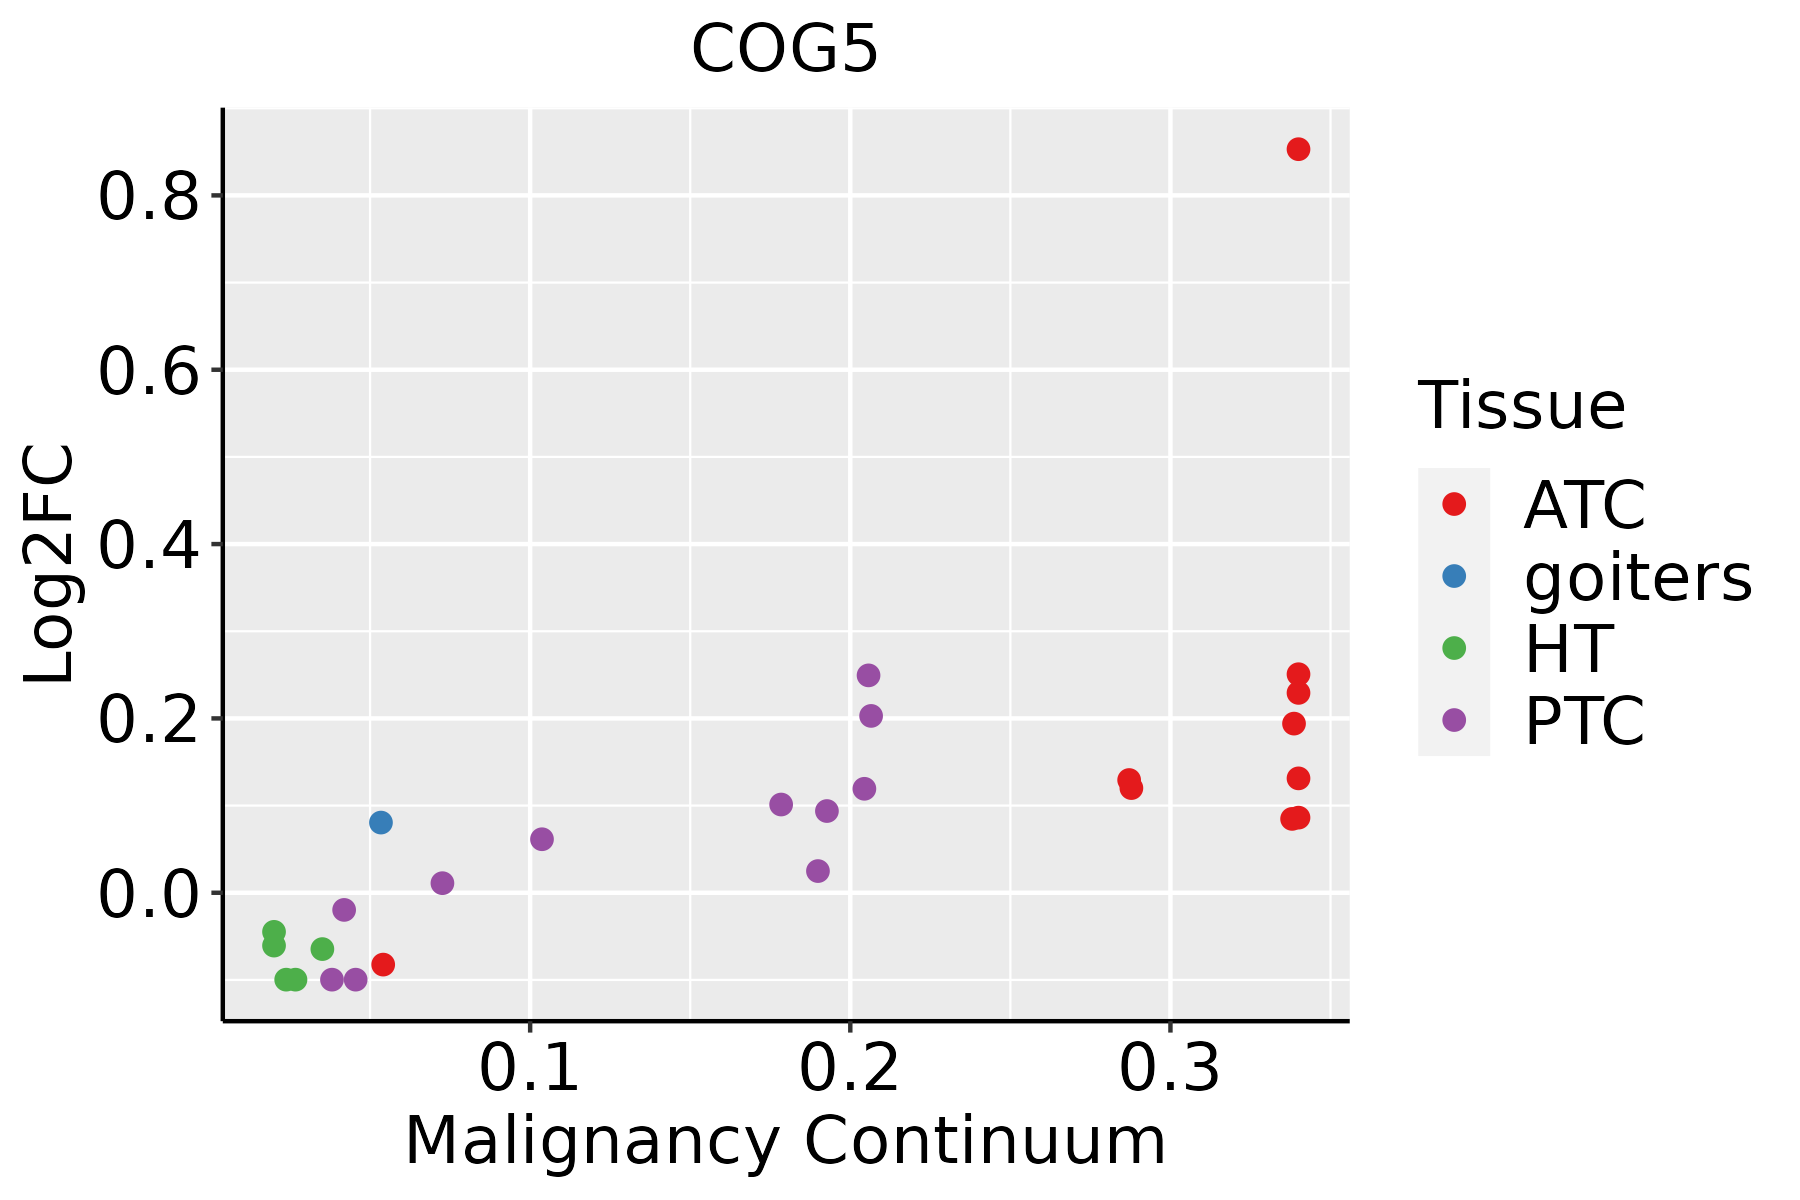 | ATC: Anaplastic thyroid cancer |
| HT: Hashimoto's thyroiditis | ||
| PTC: Papillary thyroid cancer |
| ∗log2FC in expression of this searched gene in stem-like cells from each diseased tissue sample relative to stem-like cells in normal samples in each tissue plotted against the malignancy continuum. Samples are colored based on if they are from different disease stage. |
Top |
Malignant transformation related pathway analysis |
| Find out the enriched GO biological processes and KEGG pathways involved in transition from healthy to precancer to cancer |
| Tissue | Disease Stage | Enriched GO biological Processes |
| Colorectum | AD |  |
| Colorectum | SER |  |
| Colorectum | MSS |  |
| Colorectum | MSI-H |  |
| Colorectum | FAP |  |
| ∗Top 15 enriched GO BP terms are showed in the bar plot of each disease state in each tissue. Each row represents a significant GO biological process which is colored according to the -log10(p.adjust). |
| Page: 1 2 3 4 5 6 7 8 9 |
| GO ID | Tissue | Disease Stage | Description | Gene Ratio | Bg Ratio | pvalue | p.adjust | Count |
| GO:00481938 | Cervix | CC | Golgi vesicle transport | 58/2311 | 296/18723 | 2.24e-04 | 2.54e-03 | 58 |
| GO:0048193 | Colorectum | AD | Golgi vesicle transport | 109/3918 | 296/18723 | 1.80e-10 | 1.68e-08 | 109 |
| GO:00481931 | Colorectum | SER | Golgi vesicle transport | 79/2897 | 296/18723 | 4.20e-07 | 2.15e-05 | 79 |
| GO:00481932 | Colorectum | MSS | Golgi vesicle transport | 101/3467 | 296/18723 | 9.09e-11 | 9.77e-09 | 101 |
| GO:00481934 | Colorectum | FAP | Golgi vesicle transport | 77/2622 | 296/18723 | 2.86e-08 | 2.62e-06 | 77 |
| GO:00481935 | Colorectum | CRC | Golgi vesicle transport | 59/2078 | 296/18723 | 5.47e-06 | 2.17e-04 | 59 |
| GO:00481939 | Endometrium | AEH | Golgi vesicle transport | 60/2100 | 296/18723 | 3.65e-06 | 9.79e-05 | 60 |
| GO:004819313 | Endometrium | EEC | Golgi vesicle transport | 60/2168 | 296/18723 | 9.91e-06 | 2.17e-04 | 60 |
| GO:004819318 | Esophagus | ESCC | Golgi vesicle transport | 231/8552 | 296/18723 | 1.82e-30 | 9.63e-28 | 231 |
| GO:00068914 | Esophagus | ESCC | intra-Golgi vesicle-mediated transport | 26/8552 | 33/18723 | 1.06e-04 | 7.43e-04 | 26 |
| GO:00481936 | Liver | NAFLD | Golgi vesicle transport | 66/1882 | 296/18723 | 3.66e-10 | 9.30e-08 | 66 |
| GO:004819321 | Liver | HCC | Golgi vesicle transport | 217/7958 | 296/18723 | 2.58e-27 | 1.02e-24 | 217 |
| GO:0006891 | Liver | HCC | intra-Golgi vesicle-mediated transport | 22/7958 | 33/18723 | 4.38e-03 | 1.90e-02 | 22 |
| GO:00481937 | Lung | IAC | Golgi vesicle transport | 49/2061 | 296/18723 | 2.35e-03 | 2.28e-02 | 49 |
| GO:004819312 | Lung | AIS | Golgi vesicle transport | 46/1849 | 296/18723 | 1.32e-03 | 1.64e-02 | 46 |
| GO:004819315 | Oral cavity | OSCC | Golgi vesicle transport | 209/7305 | 296/18723 | 1.39e-28 | 6.30e-26 | 209 |
| GO:00068913 | Oral cavity | OSCC | intra-Golgi vesicle-mediated transport | 23/7305 | 33/18723 | 3.47e-04 | 2.12e-03 | 23 |
| GO:004819316 | Oral cavity | LP | Golgi vesicle transport | 141/4623 | 296/18723 | 6.11e-18 | 1.06e-15 | 141 |
| GO:000689111 | Oral cavity | LP | intra-Golgi vesicle-mediated transport | 16/4623 | 33/18723 | 2.59e-03 | 1.83e-02 | 16 |
| GO:004819322 | Oral cavity | EOLP | Golgi vesicle transport | 72/2218 | 296/18723 | 1.43e-09 | 9.55e-08 | 72 |
| Page: 1 2 |
| Pathway ID | Tissue | Disease Stage | Description | Gene Ratio | Bg Ratio | pvalue | p.adjust | qvalue | Count |
| Page: 1 |
Top |
Cell-cell communication analysis |
| Identification of potential cell-cell interactions between two cell types and their ligand-receptor pairs for different disease states |
| Ligand | Receptor | LRpair | Pathway | Tissue | Disease Stage |
| Page: 1 |
Top |
Single-cell gene regulatory network inference analysis |
| Find out the significant the regulons (TFs) and the target genes of each regulon across cell types for different disease states |
| TF | Cell Type | Tissue | Disease Stage | Target Gene | RSS | Regulon Activity |
| ∗The dot plots of a searched regulon are shown for all cell subpopulations in each disease state of each tissue based on the regulon specific score inferred using pySCENIC and by calculating the average expression. |
| Page: 1 |
Top |
Somatic mutation of malignant transformation related genes |
| Annotation of somatic variants for genes involved in malignant transformation |
| Hugo Symbol | Variant Class | Variant Classification | dbSNP RS | HGVSc | HGVSp | HGVSp Short | SWISSPROT | BIOTYPE | SIFT | PolyPhen | Tumor Sample Barcode | Tissue | Histology | Sex | Age | Stage | Therapy Types | Drugs | Outcome |
| COG5 | SNV | Missense_Mutation | c.2443N>C | p.Glu815Gln | p.E815Q | Q9UP83 | protein_coding | deleterious(0) | possibly_damaging(0.903) | TCGA-AC-A23H-01 | Breast | breast invasive carcinoma | Female | >=65 | I/II | Unknown | Unknown | PD | |
| COG5 | SNV | Missense_Mutation | novel | c.1494N>G | p.Asn498Lys | p.N498K | Q9UP83 | protein_coding | deleterious(0.03) | probably_damaging(0.984) | TCGA-AC-A5XS-01 | Breast | breast invasive carcinoma | Female | >=65 | I/II | Hormone Therapy | femara | SD |
| COG5 | SNV | Missense_Mutation | novel | c.1889C>A | p.Ser630Tyr | p.S630Y | Q9UP83 | protein_coding | deleterious(0) | probably_damaging(0.986) | TCGA-AN-A046-01 | Breast | breast invasive carcinoma | Female | >=65 | I/II | Unknown | Unknown | SD |
| COG5 | SNV | Missense_Mutation | novel | c.647G>T | p.Gly216Val | p.G216V | Q9UP83 | protein_coding | deleterious(0) | probably_damaging(0.982) | TCGA-AN-A046-01 | Breast | breast invasive carcinoma | Female | >=65 | I/II | Unknown | Unknown | SD |
| COG5 | SNV | Missense_Mutation | c.1685A>G | p.Asp562Gly | p.D562G | Q9UP83 | protein_coding | deleterious(0) | benign(0.349) | TCGA-AN-A0FZ-01 | Breast | breast invasive carcinoma | Female | <65 | III/IV | Unknown | Unknown | SD | |
| COG5 | SNV | Missense_Mutation | c.1953A>T | p.Leu651Phe | p.L651F | Q9UP83 | protein_coding | tolerated(0.27) | benign(0.281) | TCGA-B6-A0RU-01 | Breast | breast invasive carcinoma | Female | <65 | I/II | Unknown | Unknown | PD | |
| COG5 | SNV | Missense_Mutation | rs370066143 | c.2365G>A | p.Ala789Thr | p.A789T | Q9UP83 | protein_coding | tolerated(0.1) | benign(0.052) | TCGA-2W-A8YY-01 | Cervix | cervical & endocervical cancer | Female | <65 | I/II | Chemotherapy | cisplatin | CR |
| COG5 | SNV | Missense_Mutation | novel | c.2189A>T | p.Glu730Val | p.E730V | Q9UP83 | protein_coding | deleterious(0) | probably_damaging(0.967) | TCGA-DS-A1OB-01 | Cervix | cervical & endocervical cancer | Female | <65 | I/II | Chemotherapy | carboplatin | PD |
| COG5 | SNV | Missense_Mutation | novel | c.2188G>A | p.Glu730Lys | p.E730K | Q9UP83 | protein_coding | deleterious(0) | probably_damaging(0.909) | TCGA-DS-A1OB-01 | Cervix | cervical & endocervical cancer | Female | <65 | I/II | Chemotherapy | carboplatin | PD |
| COG5 | SNV | Missense_Mutation | c.530N>A | p.Arg177Gln | p.R177Q | Q9UP83 | protein_coding | deleterious(0.01) | probably_damaging(0.999) | TCGA-EA-A410-01 | Cervix | cervical & endocervical cancer | Female | <65 | I/II | Unknown | Unknown | SD |
| Page: 1 2 3 4 5 6 7 8 9 |
Top |
Related drugs of malignant transformation related genes |
| Identification of chemicals and drugs interact with genes involved in malignant transfromation |
| (DGIdb 4.0) |
| Entrez ID | Symbol | Category | Interaction Types | Drug Claim Name | Drug Name | PMIDs |
| Page: 1 |

Copyright 2023-Present -The University of Texas Health Science Center at Houston |