
|
|||||
|
 | |
| |
| |
| |
| |
| |
|
Gene: COG4 |
Gene summary for COG4 |
| Gene information | Species | Human | Gene symbol | COG4 | Gene ID | 25839 |
| Gene name | component of oligomeric golgi complex 4 | |
| Gene Alias | CDG2J | |
| Cytomap | 16q22.1 | |
| Gene Type | protein-coding | GO ID | GO:0006810 | UniProtAcc | A0A0A0MS45 |
Top |
Malignant transformation analysis |
| Identification of the aberrant gene expression in precancerous and cancerous lesions by comparing the gene expression of stem-like cells in diseased tissues with normal stem cells |
| Entrez ID | Symbol | Replicates | Species | Organ | Tissue | Adj P-value | Log2FC | Malignancy |
| 25839 | COG4 | LZE4T | Human | Esophagus | ESCC | 1.93e-13 | 3.29e-01 | 0.0811 |
| 25839 | COG4 | LZE7T | Human | Esophagus | ESCC | 3.65e-02 | 2.24e-01 | 0.0667 |
| 25839 | COG4 | LZE8T | Human | Esophagus | ESCC | 6.00e-05 | 2.02e-01 | 0.067 |
| 25839 | COG4 | LZE20T | Human | Esophagus | ESCC | 2.69e-04 | 1.98e-01 | 0.0662 |
| 25839 | COG4 | LZE21D1 | Human | Esophagus | HGIN | 3.76e-06 | 3.52e-01 | 0.0632 |
| 25839 | COG4 | LZE24T | Human | Esophagus | ESCC | 1.65e-14 | 3.25e-01 | 0.0596 |
| 25839 | COG4 | LZE21T | Human | Esophagus | ESCC | 1.50e-05 | 2.58e-01 | 0.0655 |
| 25839 | COG4 | P1T-E | Human | Esophagus | ESCC | 2.78e-12 | 5.13e-01 | 0.0875 |
| 25839 | COG4 | P2T-E | Human | Esophagus | ESCC | 5.60e-15 | 3.21e-01 | 0.1177 |
| 25839 | COG4 | P4T-E | Human | Esophagus | ESCC | 2.04e-24 | 4.28e-01 | 0.1323 |
| 25839 | COG4 | P5T-E | Human | Esophagus | ESCC | 1.40e-08 | 2.25e-01 | 0.1327 |
| 25839 | COG4 | P8T-E | Human | Esophagus | ESCC | 3.01e-21 | 3.75e-01 | 0.0889 |
| 25839 | COG4 | P9T-E | Human | Esophagus | ESCC | 4.17e-04 | 1.07e-01 | 0.1131 |
| 25839 | COG4 | P10T-E | Human | Esophagus | ESCC | 1.94e-10 | 2.62e-01 | 0.116 |
| 25839 | COG4 | P11T-E | Human | Esophagus | ESCC | 8.97e-13 | 4.73e-01 | 0.1426 |
| 25839 | COG4 | P12T-E | Human | Esophagus | ESCC | 3.70e-19 | 3.72e-01 | 0.1122 |
| 25839 | COG4 | P15T-E | Human | Esophagus | ESCC | 7.40e-16 | 3.97e-01 | 0.1149 |
| 25839 | COG4 | P16T-E | Human | Esophagus | ESCC | 1.59e-20 | 3.09e-01 | 0.1153 |
| 25839 | COG4 | P17T-E | Human | Esophagus | ESCC | 4.25e-14 | 4.93e-01 | 0.1278 |
| 25839 | COG4 | P19T-E | Human | Esophagus | ESCC | 9.14e-08 | 4.21e-01 | 0.1662 |
| Page: 1 2 3 4 5 |
| Tissue | Expression Dynamics | Abbreviation |
| Esophagus | 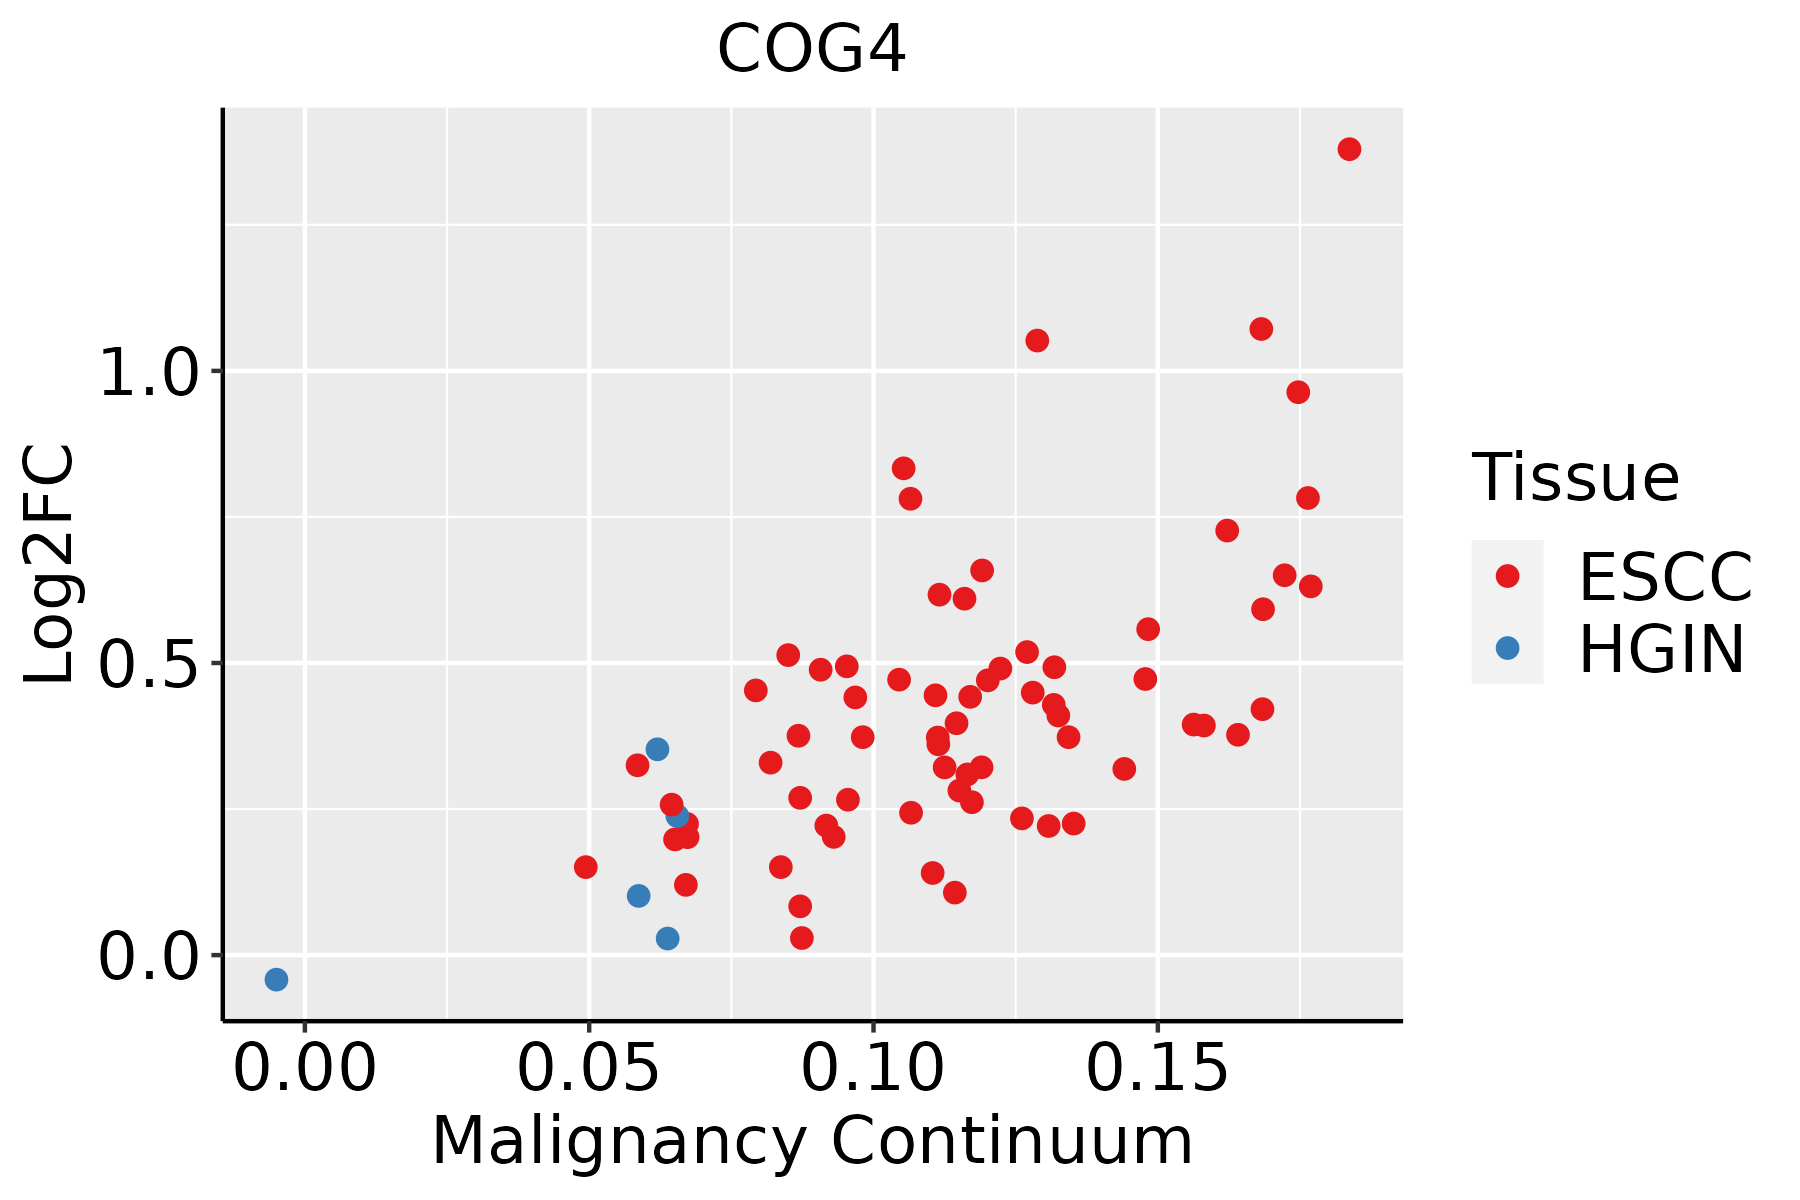 | ESCC: Esophageal squamous cell carcinoma |
| HGIN: High-grade intraepithelial neoplasias | ||
| LGIN: Low-grade intraepithelial neoplasias | ||
| Liver | 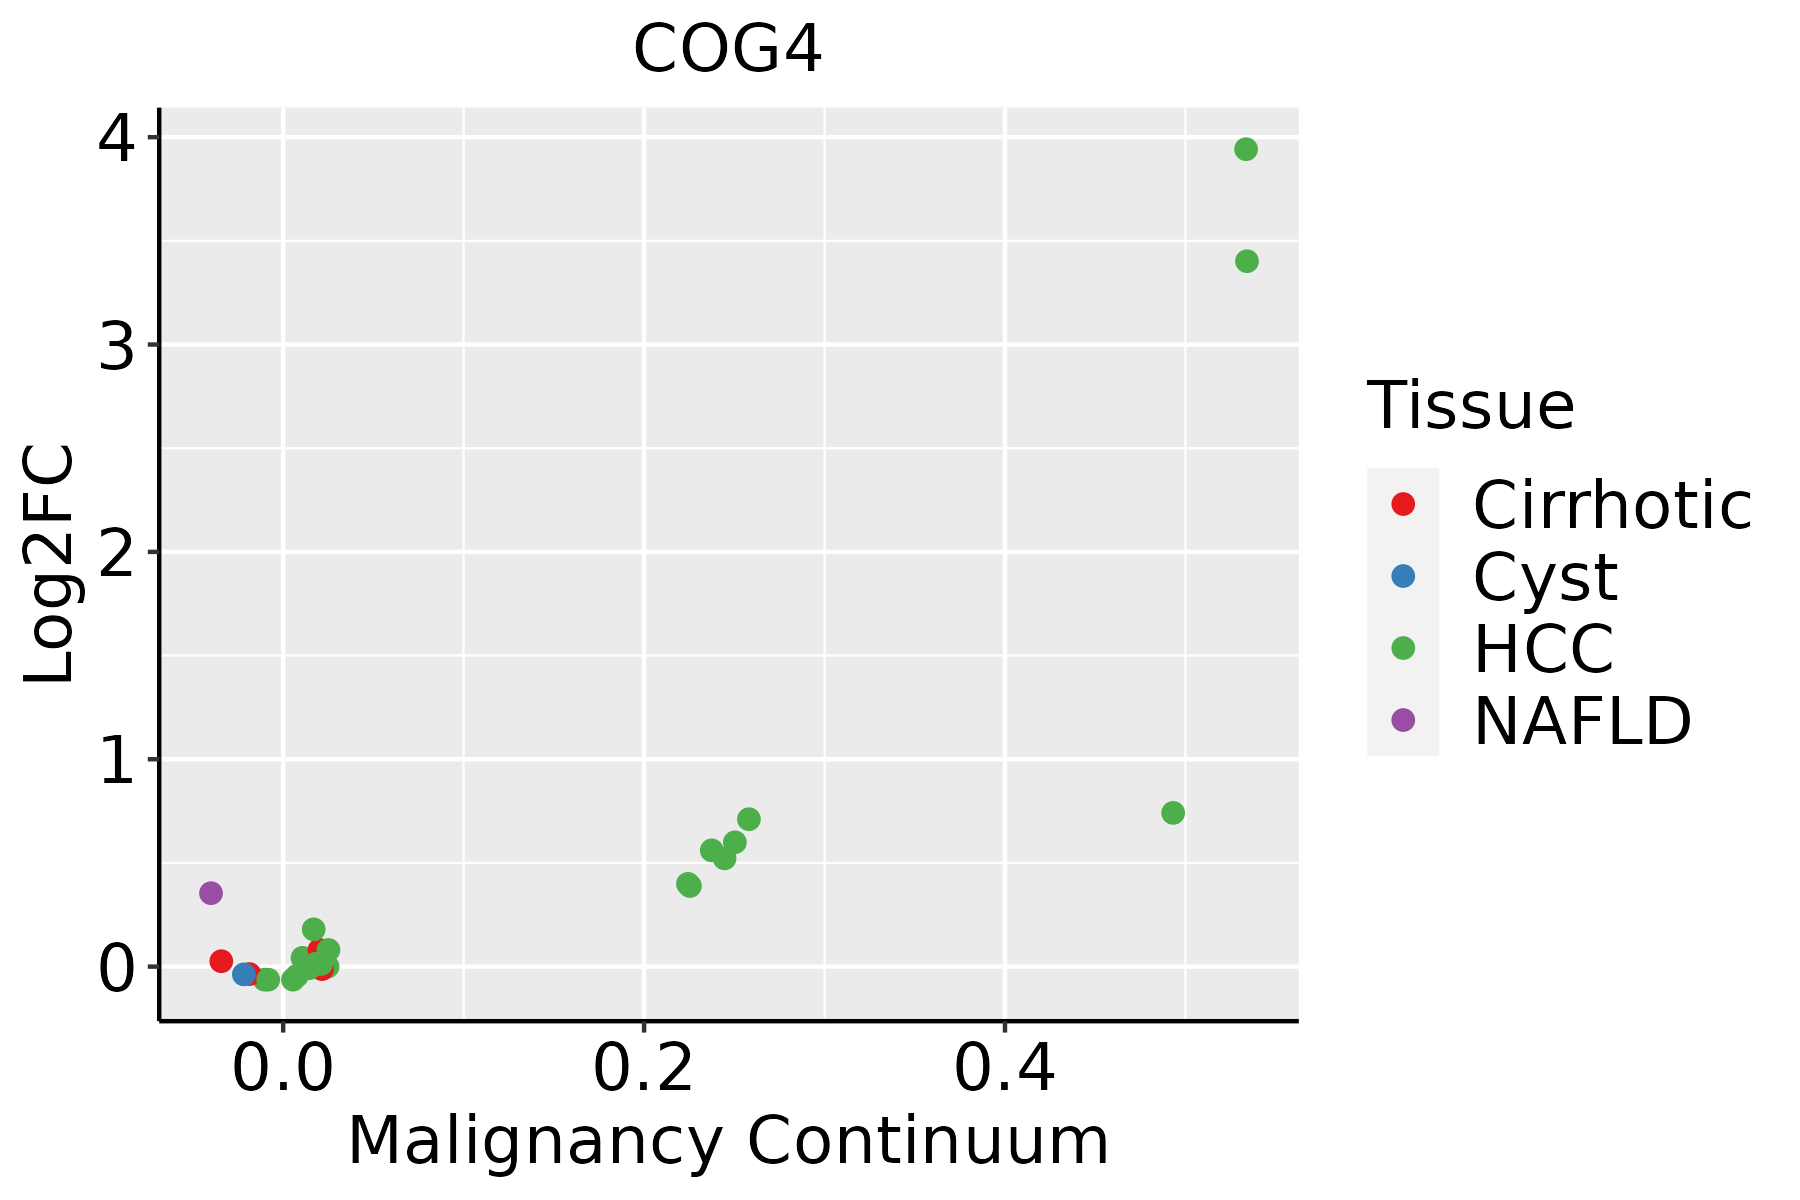 | HCC: Hepatocellular carcinoma |
| NAFLD: Non-alcoholic fatty liver disease | ||
| Oral Cavity | 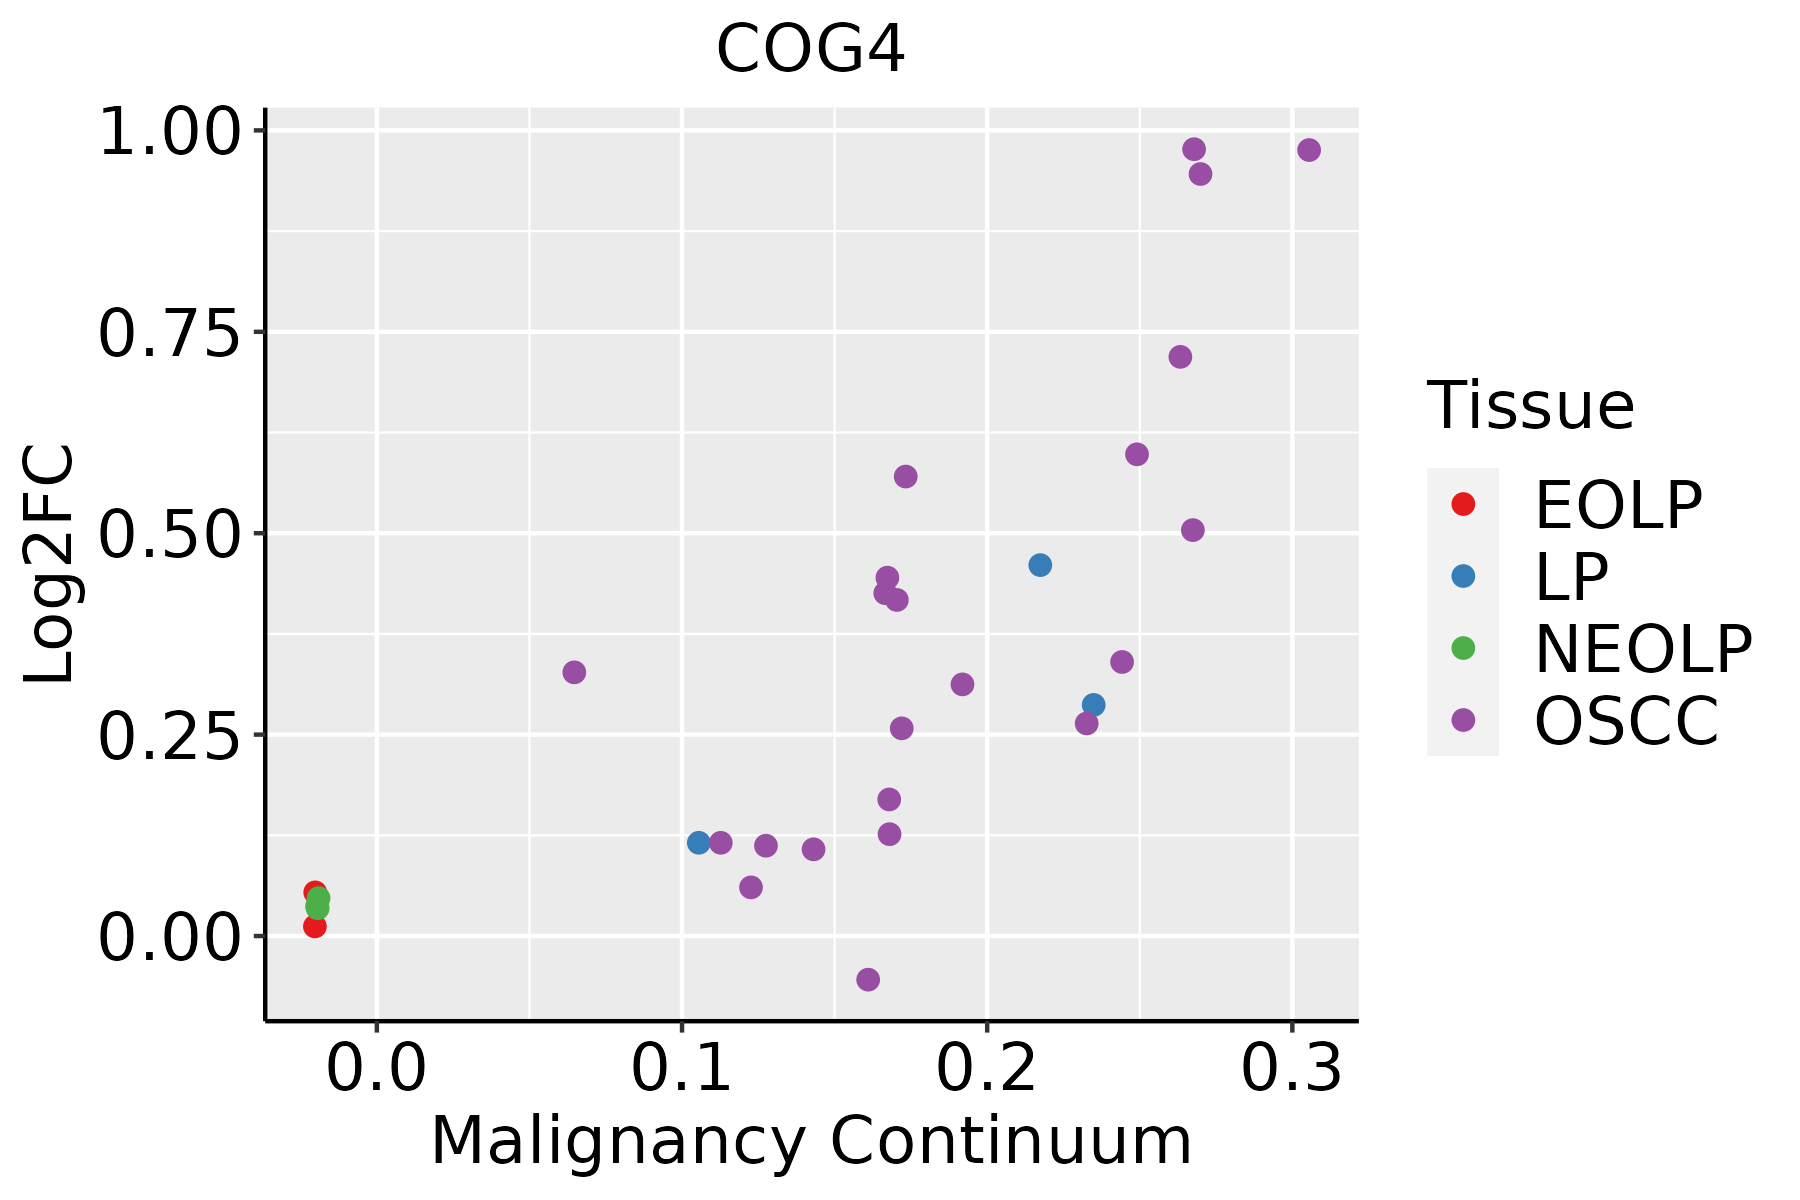 | EOLP: Erosive Oral lichen planus |
| LP: leukoplakia | ||
| NEOLP: Non-erosive oral lichen planus | ||
| OSCC: Oral squamous cell carcinoma |
| ∗log2FC in expression of this searched gene in stem-like cells from each diseased tissue sample relative to stem-like cells in normal samples in each tissue plotted against the malignancy continuum. Samples are colored based on if they are from different disease stage. |
Top |
Malignant transformation related pathway analysis |
| Find out the enriched GO biological processes and KEGG pathways involved in transition from healthy to precancer to cancer |
| Tissue | Disease Stage | Enriched GO biological Processes |
| Colorectum | AD |  |
| Colorectum | SER |  |
| Colorectum | MSS |  |
| Colorectum | MSI-H |  |
| Colorectum | FAP |  |
| ∗Top 15 enriched GO BP terms are showed in the bar plot of each disease state in each tissue. Each row represents a significant GO biological process which is colored according to the -log10(p.adjust). |
| Page: 1 2 3 4 5 6 7 8 9 |
| GO ID | Tissue | Disease Stage | Description | Gene Ratio | Bg Ratio | pvalue | p.adjust | Count |
| GO:004819317 | Esophagus | HGIN | Golgi vesicle transport | 83/2587 | 296/18723 | 8.59e-11 | 8.89e-09 | 83 |
| GO:000689016 | Esophagus | HGIN | retrograde vesicle-mediated transport, Golgi to endoplasmic reticulum | 19/2587 | 52/18723 | 3.44e-05 | 8.67e-04 | 19 |
| GO:004819318 | Esophagus | ESCC | Golgi vesicle transport | 231/8552 | 296/18723 | 1.82e-30 | 9.63e-28 | 231 |
| GO:000689017 | Esophagus | ESCC | retrograde vesicle-mediated transport, Golgi to endoplasmic reticulum | 46/8552 | 52/18723 | 1.23e-10 | 3.66e-09 | 46 |
| GO:00070308 | Esophagus | ESCC | Golgi organization | 101/8552 | 157/18723 | 1.78e-06 | 2.10e-05 | 101 |
| GO:004819311 | Liver | Cirrhotic | Golgi vesicle transport | 153/4634 | 296/18723 | 1.02e-23 | 6.43e-21 | 153 |
| GO:00070301 | Liver | Cirrhotic | Golgi organization | 68/4634 | 157/18723 | 2.57e-07 | 6.41e-06 | 68 |
| GO:00068905 | Liver | Cirrhotic | retrograde vesicle-mediated transport, Golgi to endoplasmic reticulum | 29/4634 | 52/18723 | 1.69e-06 | 3.22e-05 | 29 |
| GO:004819321 | Liver | HCC | Golgi vesicle transport | 217/7958 | 296/18723 | 2.58e-27 | 1.02e-24 | 217 |
| GO:00070302 | Liver | HCC | Golgi organization | 99/7958 | 157/18723 | 1.54e-07 | 2.85e-06 | 99 |
| GO:000689011 | Liver | HCC | retrograde vesicle-mediated transport, Golgi to endoplasmic reticulum | 36/7958 | 52/18723 | 8.79e-05 | 7.66e-04 | 36 |
| GO:004819315 | Oral cavity | OSCC | Golgi vesicle transport | 209/7305 | 296/18723 | 1.39e-28 | 6.30e-26 | 209 |
| GO:000689010 | Oral cavity | OSCC | retrograde vesicle-mediated transport, Golgi to endoplasmic reticulum | 40/7305 | 52/18723 | 2.86e-08 | 5.50e-07 | 40 |
| GO:00070307 | Oral cavity | OSCC | Golgi organization | 92/7305 | 157/18723 | 4.96e-07 | 7.27e-06 | 92 |
| Page: 1 |
| Pathway ID | Tissue | Disease Stage | Description | Gene Ratio | Bg Ratio | pvalue | p.adjust | qvalue | Count |
| Page: 1 |
Top |
Cell-cell communication analysis |
| Identification of potential cell-cell interactions between two cell types and their ligand-receptor pairs for different disease states |
| Ligand | Receptor | LRpair | Pathway | Tissue | Disease Stage |
| Page: 1 |
Top |
Single-cell gene regulatory network inference analysis |
| Find out the significant the regulons (TFs) and the target genes of each regulon across cell types for different disease states |
| TF | Cell Type | Tissue | Disease Stage | Target Gene | RSS | Regulon Activity |
| ∗The dot plots of a searched regulon are shown for all cell subpopulations in each disease state of each tissue based on the regulon specific score inferred using pySCENIC and by calculating the average expression. |
| Page: 1 |
Top |
Somatic mutation of malignant transformation related genes |
| Annotation of somatic variants for genes involved in malignant transformation |
| Hugo Symbol | Variant Class | Variant Classification | dbSNP RS | HGVSc | HGVSp | HGVSp Short | SWISSPROT | BIOTYPE | SIFT | PolyPhen | Tumor Sample Barcode | Tissue | Histology | Sex | Age | Stage | Therapy Types | Drugs | Outcome |
| COG4 | SNV | Missense_Mutation | rs772560552 | c.1900G>A | p.Val634Ile | p.V634I | protein_coding | tolerated(0.53) | benign(0.003) | TCGA-B6-A0IJ-01 | Breast | breast invasive carcinoma | Female | <65 | I/II | Unknown | Unknown | SD | |
| COG4 | SNV | Missense_Mutation | c.1061G>A | p.Arg354Lys | p.R354K | protein_coding | tolerated(0.81) | probably_damaging(0.97) | TCGA-BH-A0BP-01 | Breast | breast invasive carcinoma | Female | >=65 | I/II | Unknown | Unknown | SD | ||
| COG4 | insertion | Nonsense_Mutation | novel | c.584_585insATGTGAAATTAAAATGCAAGTTCTCTGACAAGTTGAATCACTCT | p.Glu196CysfsTer9 | p.E196Cfs*9 | protein_coding | TCGA-A8-A08F-01 | Breast | breast invasive carcinoma | Female | <65 | III/IV | Chemotherapy | 5-fluorouracil | CR | |||
| COG4 | insertion | Frame_Shift_Ins | novel | c.580_581insTCTCGAACTCCTGGCCTCAAGCAGTCCTCCCACCTCAGCCTCC | p.Glu194ValfsTer17 | p.E194Vfs*17 | protein_coding | TCGA-B6-A0IB-01 | Breast | breast invasive carcinoma | Female | <65 | III/IV | Unknown | Unknown | PD | |||
| COG4 | deletion | Frame_Shift_Del | c.546delG | p.Ser183AlafsTer2 | p.S183Afs*2 | protein_coding | TCGA-EW-A2FV-01 | Breast | breast invasive carcinoma | Female | <65 | III/IV | Chemotherapy | docetaxel | SD | ||||
| COG4 | SNV | Missense_Mutation | novel | c.1355N>T | p.Ser452Phe | p.S452F | protein_coding | deleterious(0) | probably_damaging(0.996) | TCGA-4J-AA1J-01 | Cervix | cervical & endocervical cancer | Female | <65 | I/II | Unknown | Unknown | SD | |
| COG4 | SNV | Missense_Mutation | c.1517N>T | p.Pro506Leu | p.P506L | protein_coding | deleterious(0) | probably_damaging(0.998) | TCGA-EK-A2RA-01 | Cervix | cervical & endocervical cancer | Female | >=65 | I/II | Unknown | Unknown | SD | ||
| COG4 | SNV | Missense_Mutation | c.112N>T | p.Arg38Cys | p.R38C | protein_coding | tolerated(0.1) | probably_damaging(0.999) | TCGA-IR-A3LA-01 | Cervix | cervical & endocervical cancer | Female | <65 | I/II | Chemotherapy | cisplatin | CR | ||
| COG4 | SNV | Missense_Mutation | c.799A>G | p.Arg267Gly | p.R267G | protein_coding | deleterious(0) | probably_damaging(0.995) | TCGA-A6-6780-01 | Colorectum | colon adenocarcinoma | Male | >=65 | I/II | Unknown | Unknown | SD | ||
| COG4 | SNV | Missense_Mutation | c.334G>A | p.Val112Met | p.V112M | protein_coding | deleterious(0) | possibly_damaging(0.453) | TCGA-A6-6781-01 | Colorectum | colon adenocarcinoma | Male | <65 | III/IV | Chemotherapy | oxaliplatin | SD |
| Page: 1 2 3 4 5 6 7 |
Top |
Related drugs of malignant transformation related genes |
| Identification of chemicals and drugs interact with genes involved in malignant transfromation |
| (DGIdb 4.0) |
| Entrez ID | Symbol | Category | Interaction Types | Drug Claim Name | Drug Name | PMIDs |
| Page: 1 |

Copyright 2023-Present -The University of Texas Health Science Center at Houston |