
|
|||||
|
 | |
| |
| |
| |
| |
| |
|
Gene: COG3 |
Gene summary for COG3 |
| Gene information | Species | Human | Gene symbol | COG3 | Gene ID | 83548 |
| Gene name | component of oligomeric golgi complex 3 | |
| Gene Alias | SEC34 | |
| Cytomap | 13q14.13 | |
| Gene Type | protein-coding | GO ID | GO:0006464 | UniProtAcc | Q96JB2 |
Top |
Malignant transformation analysis |
| Identification of the aberrant gene expression in precancerous and cancerous lesions by comparing the gene expression of stem-like cells in diseased tissues with normal stem cells |
| Entrez ID | Symbol | Replicates | Species | Organ | Tissue | Adj P-value | Log2FC | Malignancy |
| 83548 | COG3 | LZE4T | Human | Esophagus | ESCC | 1.73e-05 | 1.45e-01 | 0.0811 |
| 83548 | COG3 | LZE5T | Human | Esophagus | ESCC | 6.44e-04 | 3.59e-01 | 0.0514 |
| 83548 | COG3 | LZE8T | Human | Esophagus | ESCC | 1.07e-02 | 6.04e-02 | 0.067 |
| 83548 | COG3 | LZE24T | Human | Esophagus | ESCC | 1.23e-03 | 1.78e-01 | 0.0596 |
| 83548 | COG3 | P1T-E | Human | Esophagus | ESCC | 3.60e-08 | 3.72e-01 | 0.0875 |
| 83548 | COG3 | P2T-E | Human | Esophagus | ESCC | 4.59e-13 | 1.05e-01 | 0.1177 |
| 83548 | COG3 | P4T-E | Human | Esophagus | ESCC | 4.84e-03 | 4.98e-02 | 0.1323 |
| 83548 | COG3 | P5T-E | Human | Esophagus | ESCC | 7.03e-16 | 6.84e-02 | 0.1327 |
| 83548 | COG3 | P8T-E | Human | Esophagus | ESCC | 1.41e-18 | 2.85e-01 | 0.0889 |
| 83548 | COG3 | P9T-E | Human | Esophagus | ESCC | 2.73e-08 | 1.53e-01 | 0.1131 |
| 83548 | COG3 | P10T-E | Human | Esophagus | ESCC | 3.84e-08 | 2.87e-01 | 0.116 |
| 83548 | COG3 | P11T-E | Human | Esophagus | ESCC | 8.19e-03 | 2.29e-01 | 0.1426 |
| 83548 | COG3 | P12T-E | Human | Esophagus | ESCC | 5.55e-05 | 1.46e-02 | 0.1122 |
| 83548 | COG3 | P15T-E | Human | Esophagus | ESCC | 4.61e-20 | 2.99e-01 | 0.1149 |
| 83548 | COG3 | P16T-E | Human | Esophagus | ESCC | 2.06e-12 | 2.13e-01 | 0.1153 |
| 83548 | COG3 | P17T-E | Human | Esophagus | ESCC | 1.30e-02 | 1.62e-01 | 0.1278 |
| 83548 | COG3 | P20T-E | Human | Esophagus | ESCC | 7.42e-06 | 1.84e-01 | 0.1124 |
| 83548 | COG3 | P21T-E | Human | Esophagus | ESCC | 8.59e-09 | 2.01e-01 | 0.1617 |
| 83548 | COG3 | P22T-E | Human | Esophagus | ESCC | 1.74e-06 | 1.15e-01 | 0.1236 |
| 83548 | COG3 | P23T-E | Human | Esophagus | ESCC | 2.81e-11 | 2.43e-01 | 0.108 |
| Page: 1 2 3 4 |
| Tissue | Expression Dynamics | Abbreviation |
| Esophagus | 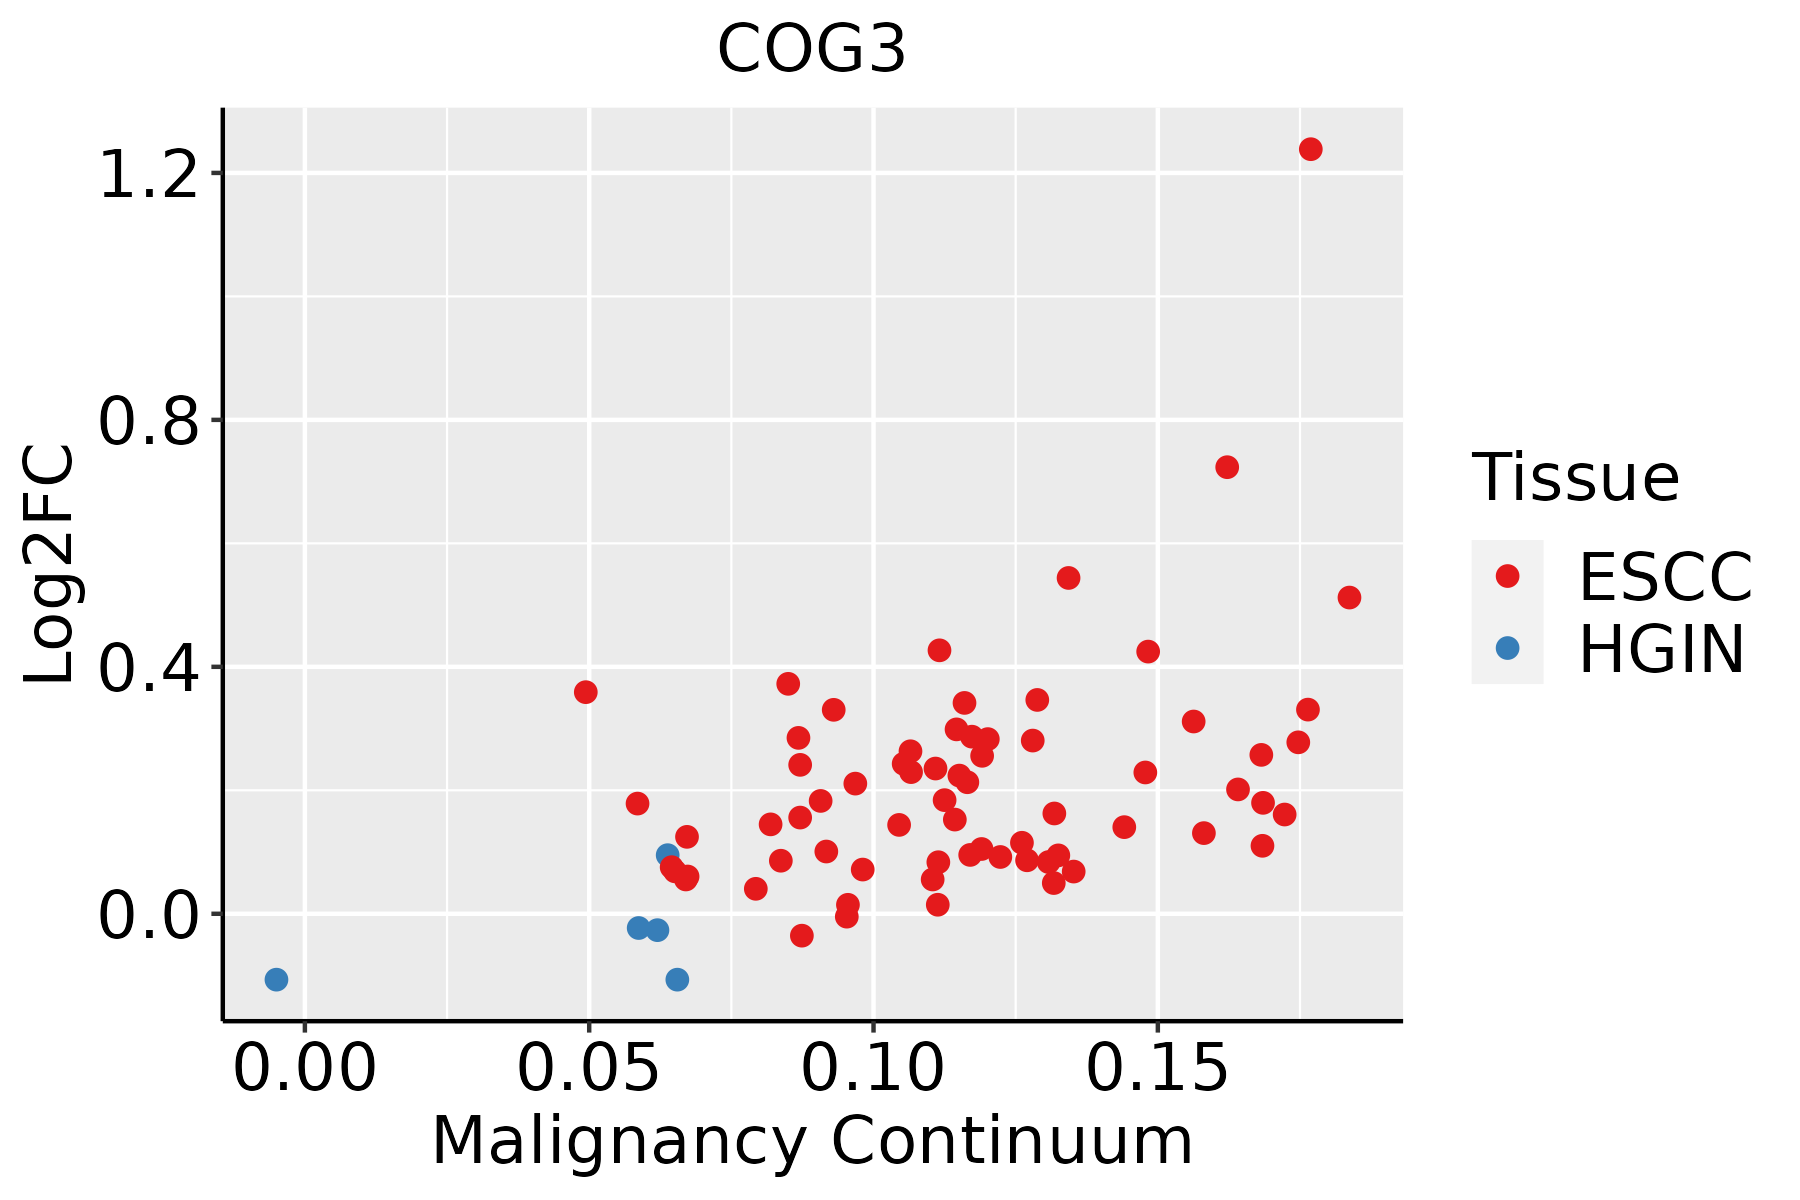 | ESCC: Esophageal squamous cell carcinoma |
| HGIN: High-grade intraepithelial neoplasias | ||
| LGIN: Low-grade intraepithelial neoplasias | ||
| Liver |  | HCC: Hepatocellular carcinoma |
| NAFLD: Non-alcoholic fatty liver disease | ||
| Oral Cavity | 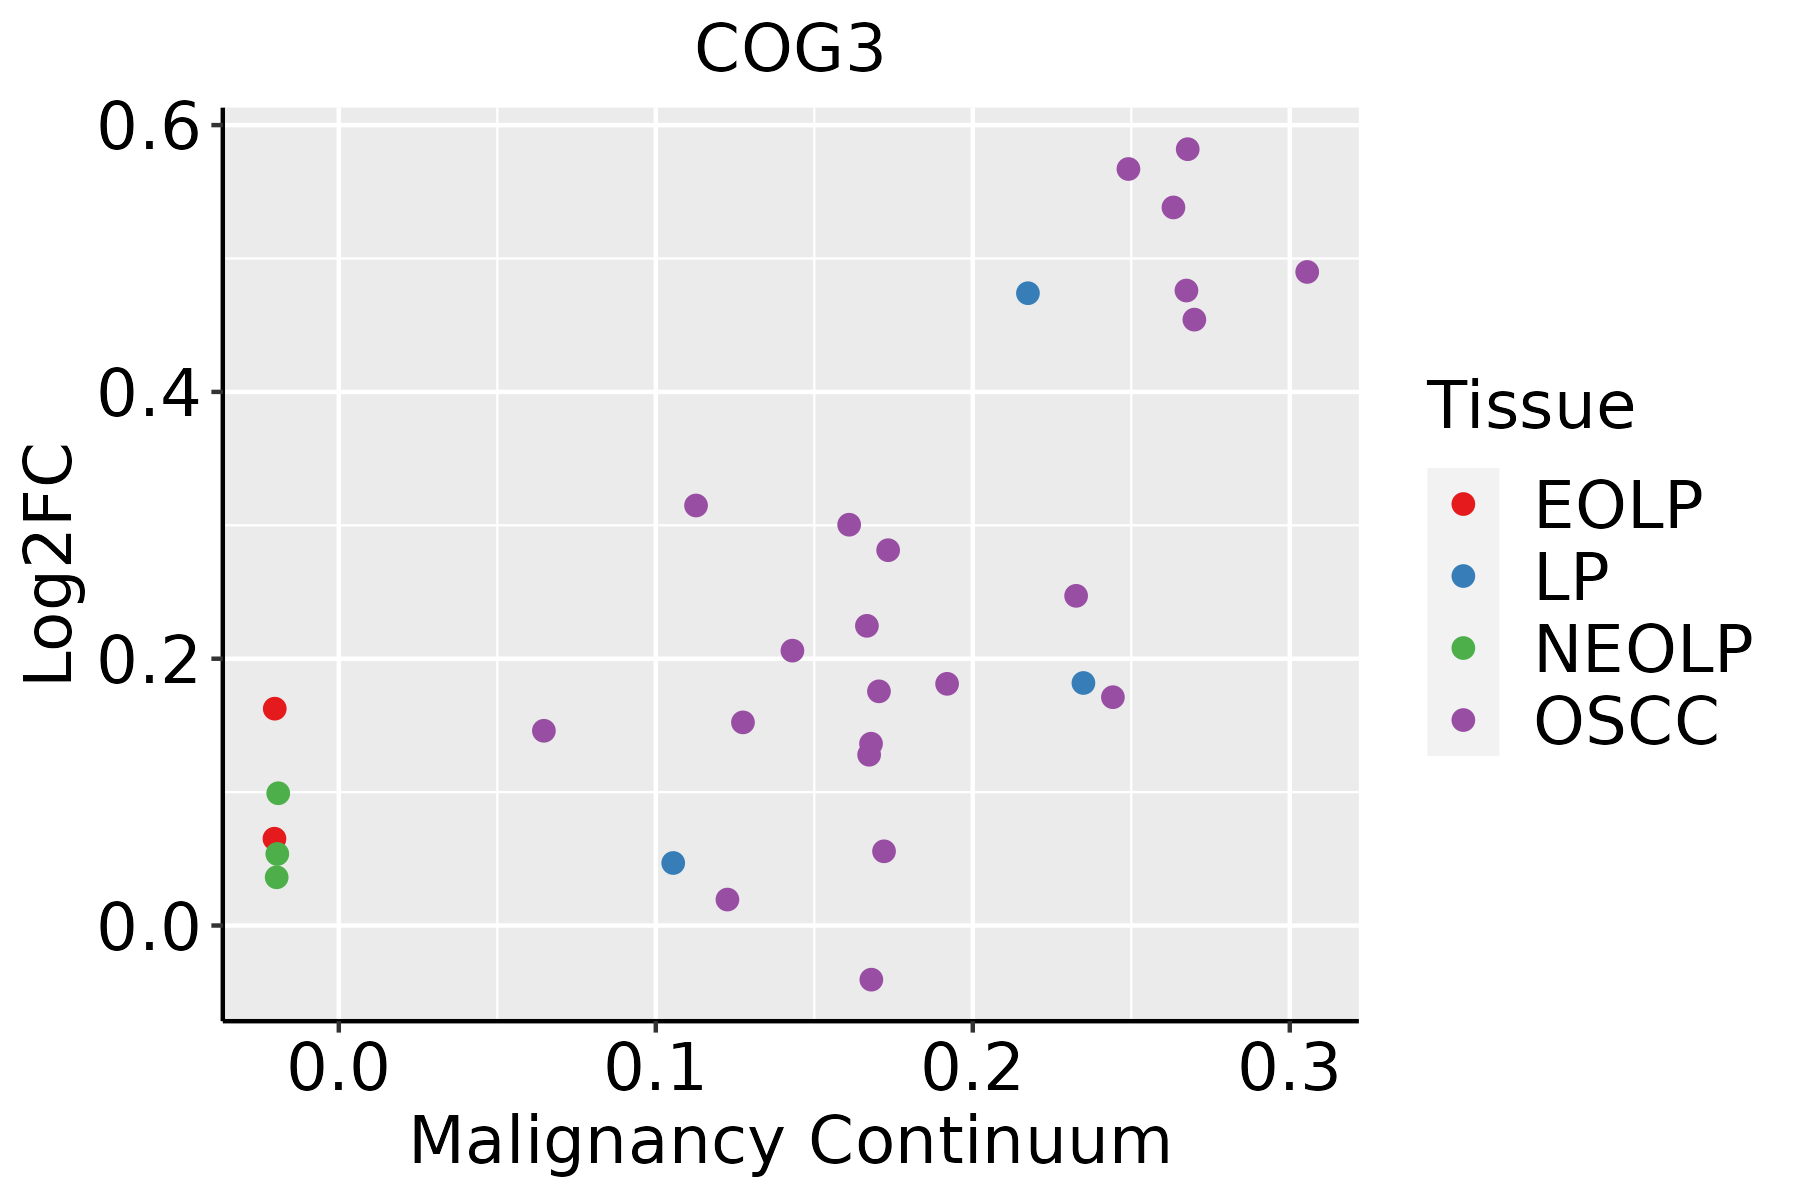 | EOLP: Erosive Oral lichen planus |
| LP: leukoplakia | ||
| NEOLP: Non-erosive oral lichen planus | ||
| OSCC: Oral squamous cell carcinoma |
| ∗log2FC in expression of this searched gene in stem-like cells from each diseased tissue sample relative to stem-like cells in normal samples in each tissue plotted against the malignancy continuum. Samples are colored based on if they are from different disease stage. |
Top |
Malignant transformation related pathway analysis |
| Find out the enriched GO biological processes and KEGG pathways involved in transition from healthy to precancer to cancer |
| Tissue | Disease Stage | Enriched GO biological Processes |
| Colorectum | AD |  |
| Colorectum | SER |  |
| Colorectum | MSS |  |
| Colorectum | MSI-H |  |
| Colorectum | FAP |  |
| ∗Top 15 enriched GO BP terms are showed in the bar plot of each disease state in each tissue. Each row represents a significant GO biological process which is colored according to the -log10(p.adjust). |
| Page: 1 2 3 4 5 6 7 8 9 |
| GO ID | Tissue | Disease Stage | Description | Gene Ratio | Bg Ratio | pvalue | p.adjust | Count |
| GO:004819318 | Esophagus | ESCC | Golgi vesicle transport | 231/8552 | 296/18723 | 1.82e-30 | 9.63e-28 | 231 |
| GO:0031647111 | Esophagus | ESCC | regulation of protein stability | 223/8552 | 298/18723 | 5.76e-25 | 1.52e-22 | 223 |
| GO:0050821111 | Esophagus | ESCC | protein stabilization | 140/8552 | 191/18723 | 6.50e-15 | 3.61e-13 | 140 |
| GO:000688815 | Esophagus | ESCC | endoplasmic reticulum to Golgi vesicle-mediated transport | 102/8552 | 130/18723 | 1.73e-14 | 9.22e-13 | 102 |
| GO:000689017 | Esophagus | ESCC | retrograde vesicle-mediated transport, Golgi to endoplasmic reticulum | 46/8552 | 52/18723 | 1.23e-10 | 3.66e-09 | 46 |
| GO:00091002 | Esophagus | ESCC | glycoprotein metabolic process | 226/8552 | 387/18723 | 2.64e-07 | 3.94e-06 | 226 |
| GO:00070308 | Esophagus | ESCC | Golgi organization | 101/8552 | 157/18723 | 1.78e-06 | 2.10e-05 | 101 |
| GO:00700854 | Esophagus | ESCC | glycosylation | 144/8552 | 240/18723 | 5.12e-06 | 5.38e-05 | 144 |
| GO:00064865 | Esophagus | ESCC | protein glycosylation | 135/8552 | 226/18723 | 1.36e-05 | 1.24e-04 | 135 |
| GO:00434135 | Esophagus | ESCC | macromolecule glycosylation | 135/8552 | 226/18723 | 1.36e-05 | 1.24e-04 | 135 |
| GO:00091012 | Esophagus | ESCC | glycoprotein biosynthetic process | 181/8552 | 317/18723 | 2.54e-05 | 2.15e-04 | 181 |
| GO:00068914 | Esophagus | ESCC | intra-Golgi vesicle-mediated transport | 26/8552 | 33/18723 | 1.06e-04 | 7.43e-04 | 26 |
| GO:00481936 | Liver | NAFLD | Golgi vesicle transport | 66/1882 | 296/18723 | 3.66e-10 | 9.30e-08 | 66 |
| GO:00316477 | Liver | NAFLD | regulation of protein stability | 61/1882 | 298/18723 | 5.00e-08 | 4.71e-06 | 61 |
| GO:0007030 | Liver | NAFLD | Golgi organization | 36/1882 | 157/18723 | 1.76e-06 | 7.68e-05 | 36 |
| GO:00508217 | Liver | NAFLD | protein stabilization | 40/1882 | 191/18723 | 5.38e-06 | 1.95e-04 | 40 |
| GO:00068885 | Liver | NAFLD | endoplasmic reticulum to Golgi vesicle-mediated transport | 26/1882 | 130/18723 | 4.78e-04 | 6.78e-03 | 26 |
| GO:004819321 | Liver | HCC | Golgi vesicle transport | 217/7958 | 296/18723 | 2.58e-27 | 1.02e-24 | 217 |
| GO:003164722 | Liver | HCC | regulation of protein stability | 211/7958 | 298/18723 | 2.29e-23 | 5.01e-21 | 211 |
| GO:005082122 | Liver | HCC | protein stabilization | 139/7958 | 191/18723 | 1.61e-17 | 1.71e-15 | 139 |
| Page: 1 2 |
| Pathway ID | Tissue | Disease Stage | Description | Gene Ratio | Bg Ratio | pvalue | p.adjust | qvalue | Count |
| Page: 1 |
Top |
Cell-cell communication analysis |
| Identification of potential cell-cell interactions between two cell types and their ligand-receptor pairs for different disease states |
| Ligand | Receptor | LRpair | Pathway | Tissue | Disease Stage |
| Page: 1 |
Top |
Single-cell gene regulatory network inference analysis |
| Find out the significant the regulons (TFs) and the target genes of each regulon across cell types for different disease states |
| TF | Cell Type | Tissue | Disease Stage | Target Gene | RSS | Regulon Activity |
| ∗The dot plots of a searched regulon are shown for all cell subpopulations in each disease state of each tissue based on the regulon specific score inferred using pySCENIC and by calculating the average expression. |
| Page: 1 |
Top |
Somatic mutation of malignant transformation related genes |
| Annotation of somatic variants for genes involved in malignant transformation |
| Hugo Symbol | Variant Class | Variant Classification | dbSNP RS | HGVSc | HGVSp | HGVSp Short | SWISSPROT | BIOTYPE | SIFT | PolyPhen | Tumor Sample Barcode | Tissue | Histology | Sex | Age | Stage | Therapy Types | Drugs | Outcome |
| COG3 | SNV | Missense_Mutation | novel | c.1676N>A | p.Arg559Gln | p.R559Q | Q96JB2 | protein_coding | deleterious(0) | possibly_damaging(0.494) | TCGA-AN-A046-01 | Breast | breast invasive carcinoma | Female | >=65 | I/II | Unknown | Unknown | SD |
| COG3 | SNV | Missense_Mutation | c.179N>T | p.Pro60Leu | p.P60L | Q96JB2 | protein_coding | deleterious(0.01) | probably_damaging(0.997) | TCGA-BH-A18J-01 | Breast | breast invasive carcinoma | Female | <65 | III/IV | Unknown | Unknown | PD | |
| COG3 | SNV | Missense_Mutation | c.545N>G | p.Glu182Gly | p.E182G | Q96JB2 | protein_coding | deleterious(0.01) | probably_damaging(0.946) | TCGA-D8-A146-01 | Breast | breast invasive carcinoma | Female | <65 | I/II | Unknown | Unknown | SD | |
| COG3 | SNV | Missense_Mutation | novel | c.691N>A | p.Asp231Asn | p.D231N | Q96JB2 | protein_coding | deleterious(0.02) | possibly_damaging(0.596) | TCGA-D8-A73U-01 | Breast | breast invasive carcinoma | Female | >=65 | I/II | Hormone Therapy | tamoxiphen | SD |
| COG3 | SNV | Missense_Mutation | novel | c.967G>A | p.Glu323Lys | p.E323K | Q96JB2 | protein_coding | deleterious(0.01) | benign(0.196) | TCGA-4J-AA1J-01 | Cervix | cervical & endocervical cancer | Female | <65 | I/II | Unknown | Unknown | SD |
| COG3 | SNV | Missense_Mutation | c.1448C>T | p.Pro483Leu | p.P483L | Q96JB2 | protein_coding | deleterious(0.01) | probably_damaging(0.996) | TCGA-C5-A1M8-01 | Cervix | cervical & endocervical cancer | Female | <65 | I/II | Unknown | Unknown | SD | |
| COG3 | SNV | Missense_Mutation | novel | c.1372N>A | p.Glu458Lys | p.E458K | Q96JB2 | protein_coding | deleterious(0.02) | probably_damaging(0.994) | TCGA-MY-A5BD-01 | Cervix | cervical & endocervical cancer | Female | <65 | I/II | Chemotherapy | cisplatin | CR |
| COG3 | SNV | Missense_Mutation | c.2464C>A | p.Leu822Ile | p.L822I | Q96JB2 | protein_coding | tolerated(0.64) | benign(0.129) | TCGA-AA-3710-01 | Colorectum | colon adenocarcinoma | Female | >=65 | I/II | Unknown | Unknown | SD | |
| COG3 | SNV | Missense_Mutation | novel | c.1085N>G | p.His362Arg | p.H362R | Q96JB2 | protein_coding | deleterious(0.01) | possibly_damaging(0.878) | TCGA-AA-3877-01 | Colorectum | colon adenocarcinoma | Female | >=65 | I/II | Unknown | Unknown | SD |
| COG3 | SNV | Missense_Mutation | novel | c.140N>G | p.Lys47Arg | p.K47R | Q96JB2 | protein_coding | tolerated(0.63) | benign(0) | TCGA-CA-6717-01 | Colorectum | colon adenocarcinoma | Male | <65 | I/II | Chemotherapy | oxaliplatin | CR |
| Page: 1 2 3 4 5 6 7 |
Top |
Related drugs of malignant transformation related genes |
| Identification of chemicals and drugs interact with genes involved in malignant transfromation |
| (DGIdb 4.0) |
| Entrez ID | Symbol | Category | Interaction Types | Drug Claim Name | Drug Name | PMIDs |
| Page: 1 |

Copyright 2023-Present -The University of Texas Health Science Center at Houston |