
|
|||||
|
 | |
| |
| |
| |
| |
| |
|
Gene: COG2 |
Gene summary for COG2 |
| Gene information | Species | Human | Gene symbol | COG2 | Gene ID | 22796 |
| Gene name | component of oligomeric golgi complex 2 | |
| Gene Alias | CDG2Q | |
| Cytomap | 1q42.2 | |
| Gene Type | protein-coding | GO ID | GO:0006810 | UniProtAcc | Q14746 |
Top |
Malignant transformation analysis |
| Identification of the aberrant gene expression in precancerous and cancerous lesions by comparing the gene expression of stem-like cells in diseased tissues with normal stem cells |
| Entrez ID | Symbol | Replicates | Species | Organ | Tissue | Adj P-value | Log2FC | Malignancy |
| 22796 | COG2 | LZE4T | Human | Esophagus | ESCC | 9.55e-07 | 2.21e-01 | 0.0811 |
| 22796 | COG2 | LZE7T | Human | Esophagus | ESCC | 4.68e-07 | 3.36e-01 | 0.0667 |
| 22796 | COG2 | LZE24T | Human | Esophagus | ESCC | 3.90e-10 | 2.15e-01 | 0.0596 |
| 22796 | COG2 | P1T-E | Human | Esophagus | ESCC | 1.68e-08 | 2.82e-01 | 0.0875 |
| 22796 | COG2 | P2T-E | Human | Esophagus | ESCC | 1.06e-19 | 3.40e-01 | 0.1177 |
| 22796 | COG2 | P4T-E | Human | Esophagus | ESCC | 2.96e-09 | 1.85e-01 | 0.1323 |
| 22796 | COG2 | P5T-E | Human | Esophagus | ESCC | 8.26e-11 | 1.94e-01 | 0.1327 |
| 22796 | COG2 | P8T-E | Human | Esophagus | ESCC | 3.47e-12 | 1.99e-01 | 0.0889 |
| 22796 | COG2 | P9T-E | Human | Esophagus | ESCC | 7.53e-09 | 2.03e-01 | 0.1131 |
| 22796 | COG2 | P10T-E | Human | Esophagus | ESCC | 4.05e-26 | 4.03e-01 | 0.116 |
| 22796 | COG2 | P11T-E | Human | Esophagus | ESCC | 6.17e-08 | 2.77e-01 | 0.1426 |
| 22796 | COG2 | P12T-E | Human | Esophagus | ESCC | 8.82e-17 | 3.36e-01 | 0.1122 |
| 22796 | COG2 | P15T-E | Human | Esophagus | ESCC | 4.57e-15 | 3.94e-01 | 0.1149 |
| 22796 | COG2 | P16T-E | Human | Esophagus | ESCC | 1.02e-15 | 2.85e-01 | 0.1153 |
| 22796 | COG2 | P17T-E | Human | Esophagus | ESCC | 2.01e-09 | 2.38e-01 | 0.1278 |
| 22796 | COG2 | P19T-E | Human | Esophagus | ESCC | 1.94e-03 | 2.19e-01 | 0.1662 |
| 22796 | COG2 | P20T-E | Human | Esophagus | ESCC | 3.73e-11 | 2.13e-01 | 0.1124 |
| 22796 | COG2 | P21T-E | Human | Esophagus | ESCC | 1.88e-16 | 3.10e-01 | 0.1617 |
| 22796 | COG2 | P22T-E | Human | Esophagus | ESCC | 1.02e-09 | 1.75e-01 | 0.1236 |
| 22796 | COG2 | P23T-E | Human | Esophagus | ESCC | 1.15e-18 | 3.82e-01 | 0.108 |
| Page: 1 2 3 4 5 |
| Tissue | Expression Dynamics | Abbreviation |
| Esophagus | 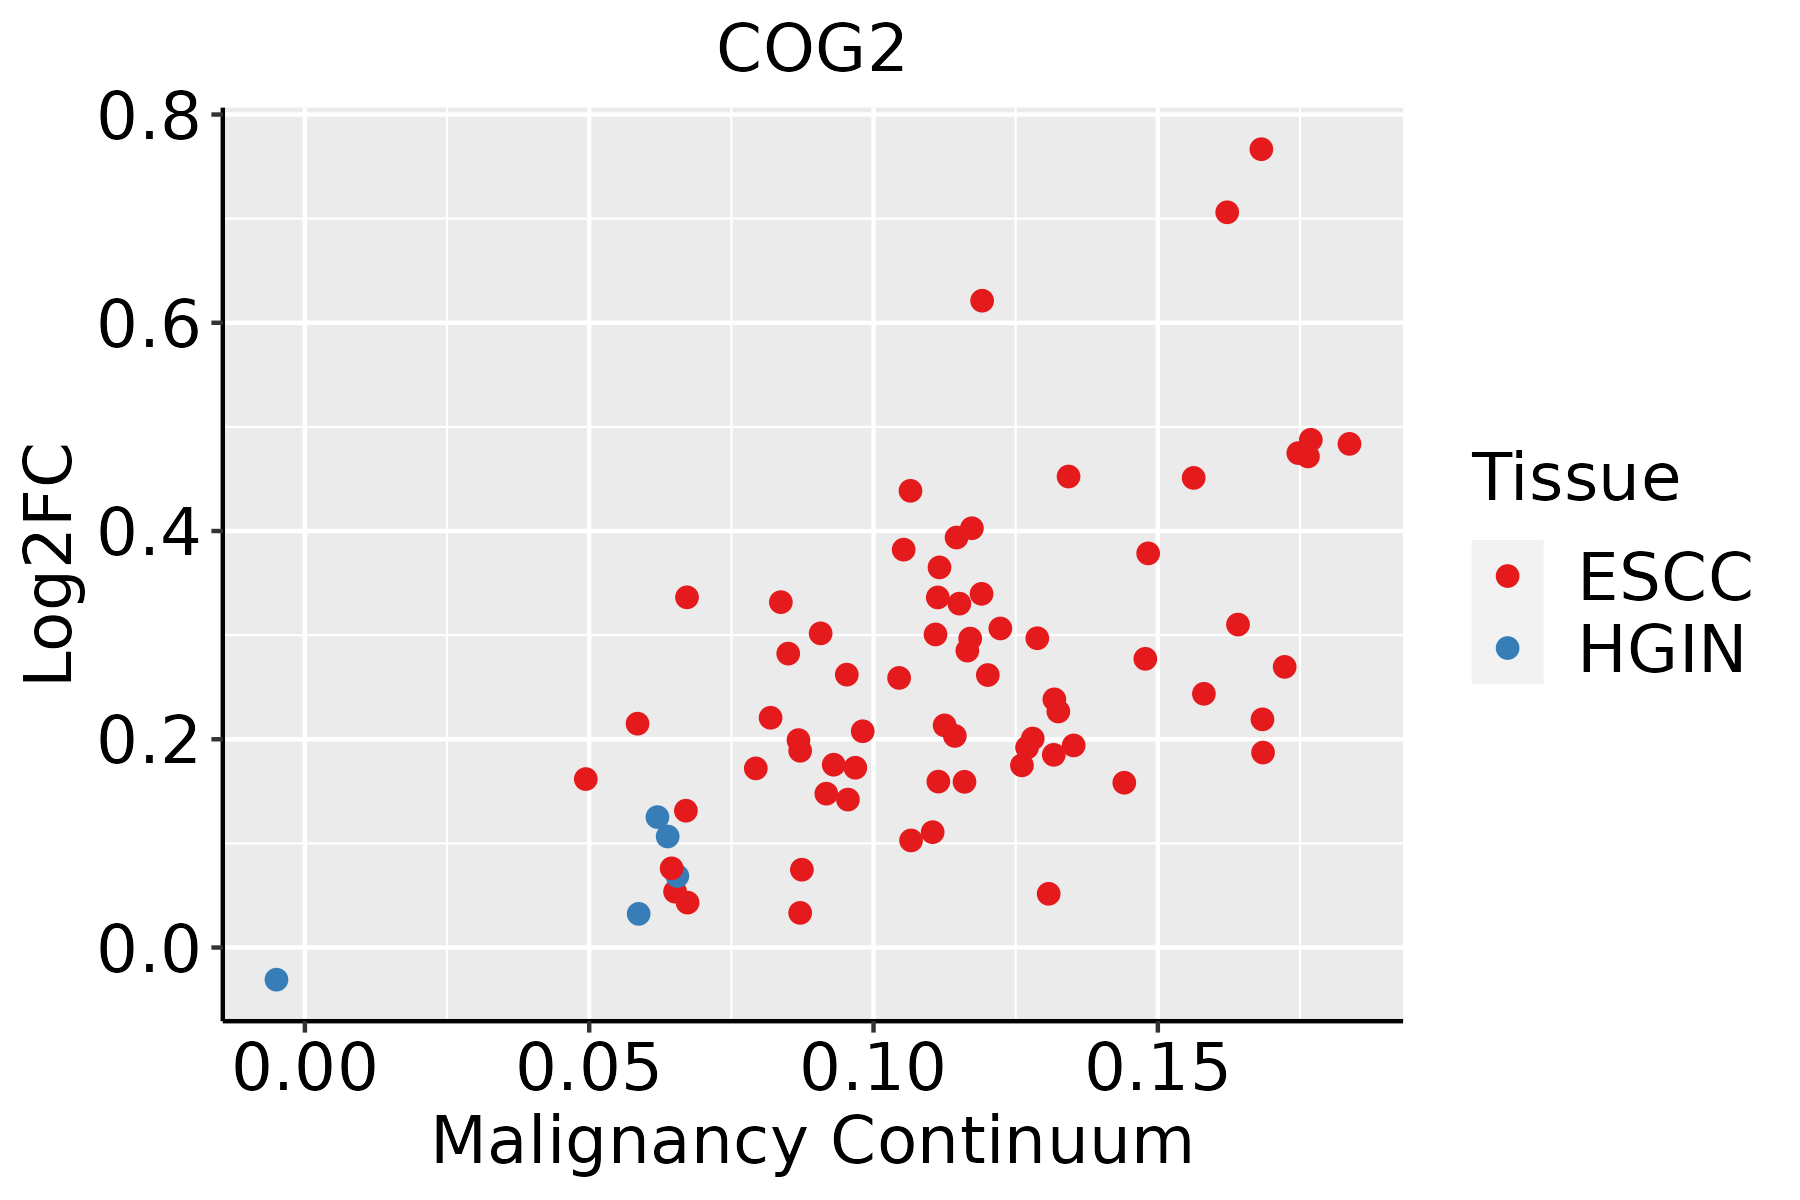 | ESCC: Esophageal squamous cell carcinoma |
| HGIN: High-grade intraepithelial neoplasias | ||
| LGIN: Low-grade intraepithelial neoplasias | ||
| Liver | 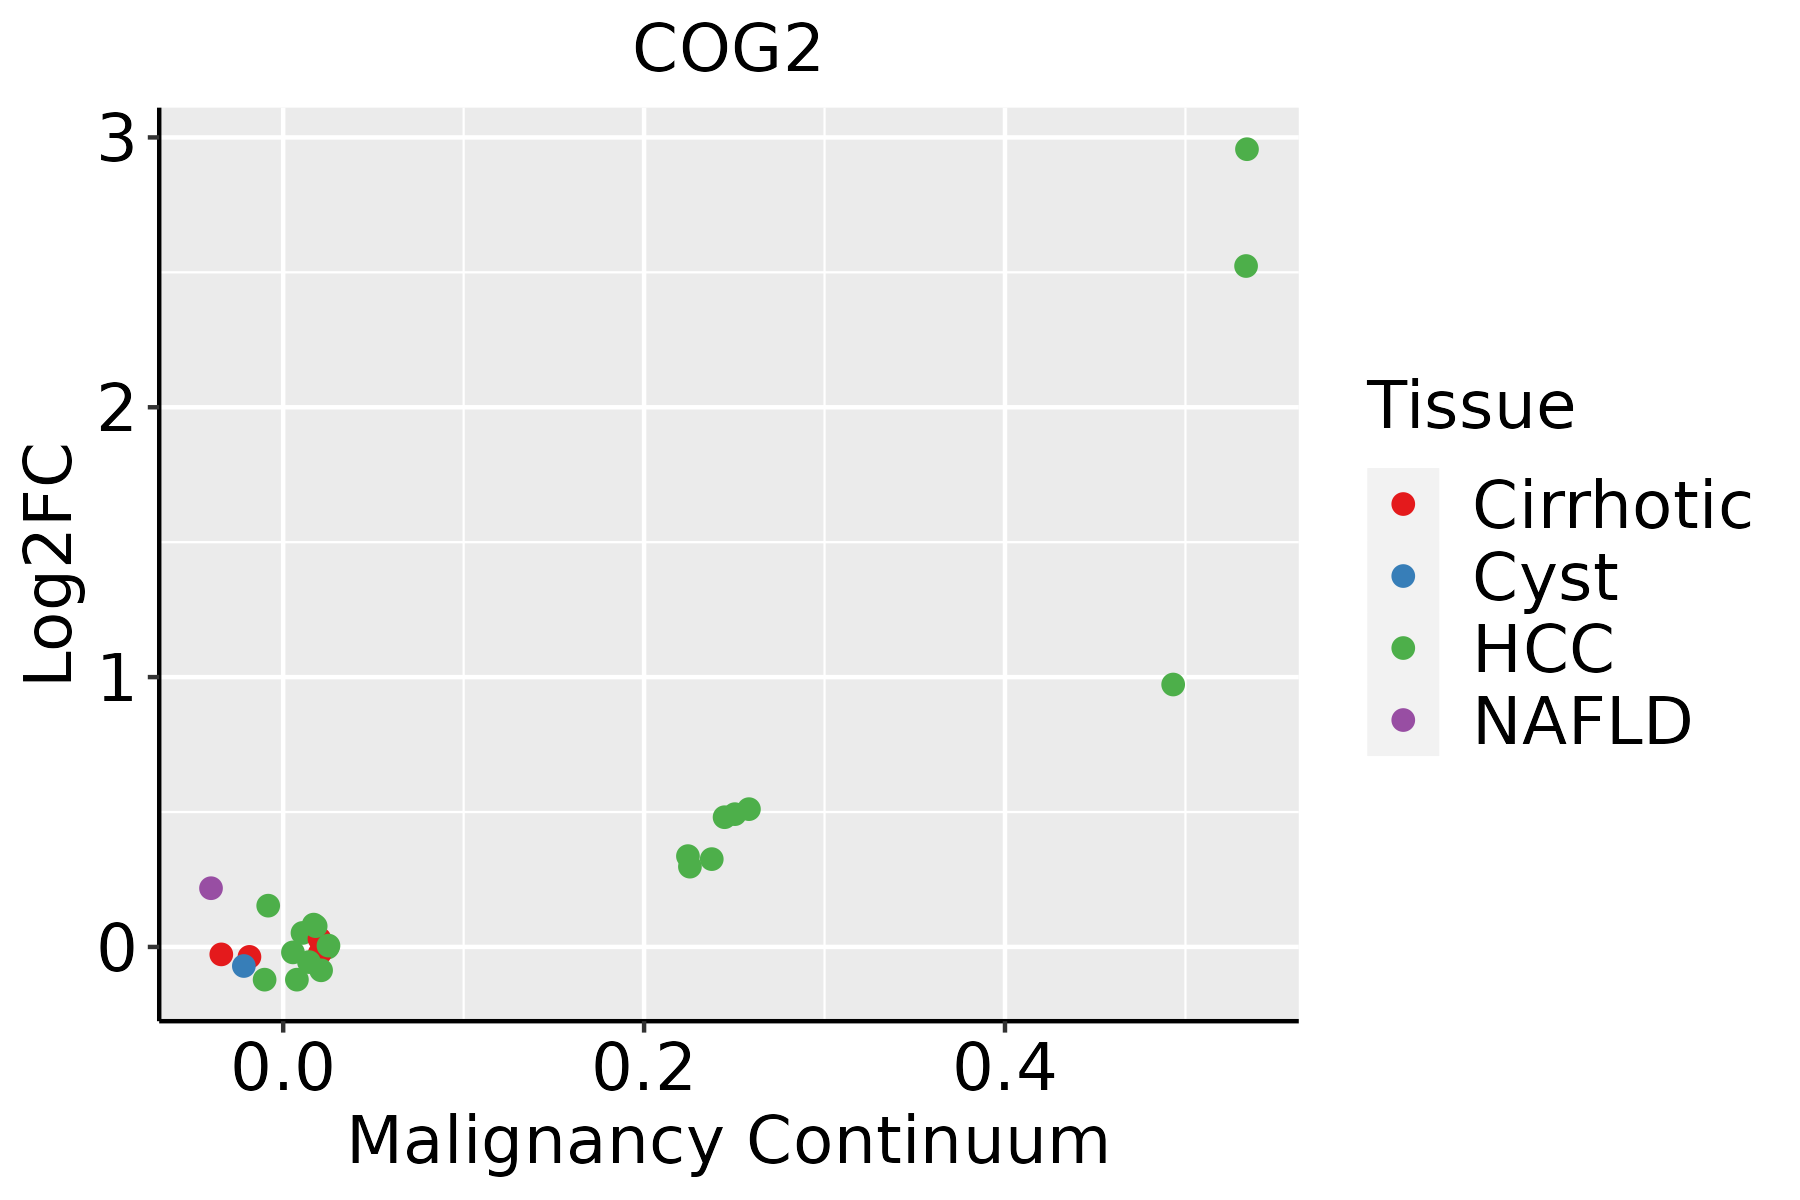 | HCC: Hepatocellular carcinoma |
| NAFLD: Non-alcoholic fatty liver disease | ||
| Oral Cavity | 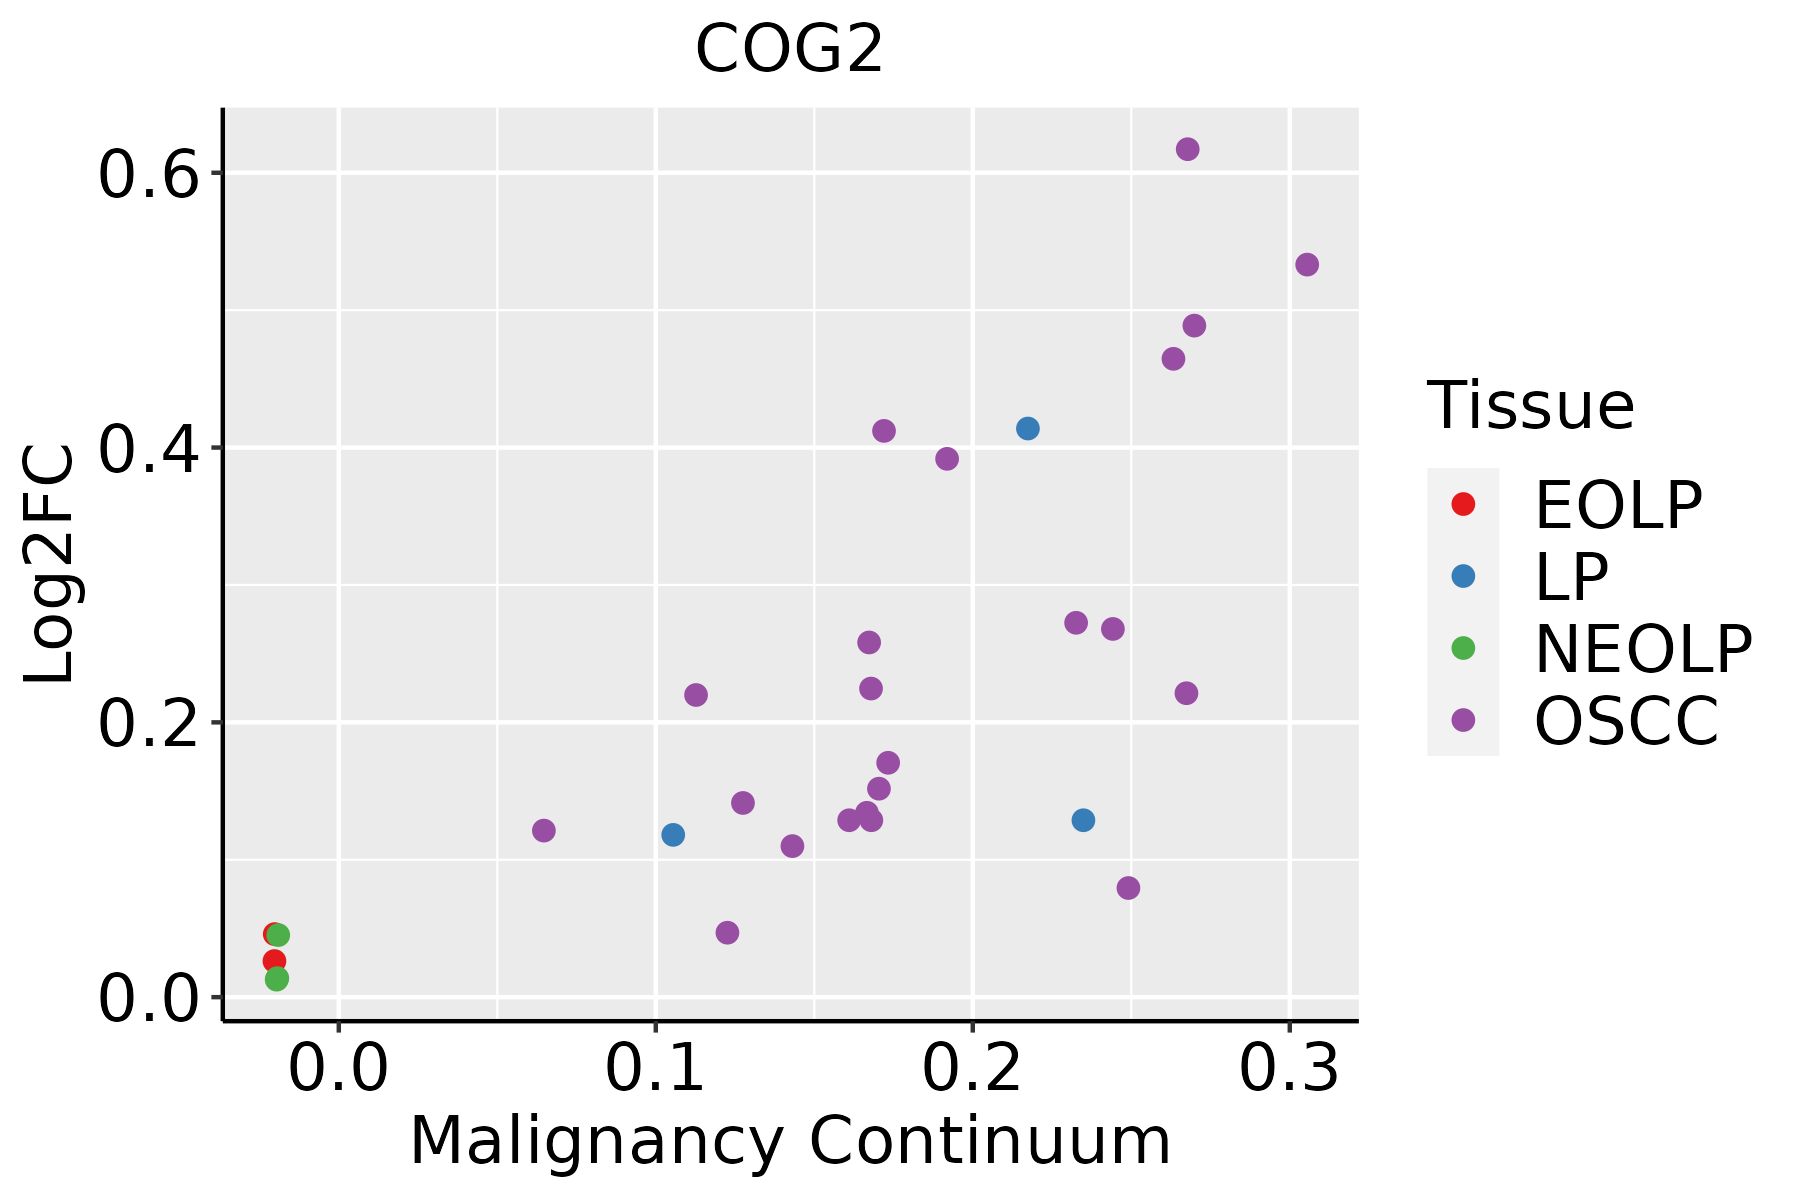 | EOLP: Erosive Oral lichen planus |
| LP: leukoplakia | ||
| NEOLP: Non-erosive oral lichen planus | ||
| OSCC: Oral squamous cell carcinoma |
| ∗log2FC in expression of this searched gene in stem-like cells from each diseased tissue sample relative to stem-like cells in normal samples in each tissue plotted against the malignancy continuum. Samples are colored based on if they are from different disease stage. |
Top |
Malignant transformation related pathway analysis |
| Find out the enriched GO biological processes and KEGG pathways involved in transition from healthy to precancer to cancer |
| Tissue | Disease Stage | Enriched GO biological Processes |
| Colorectum | AD |  |
| Colorectum | SER |  |
| Colorectum | MSS |  |
| Colorectum | MSI-H |  |
| Colorectum | FAP |  |
| ∗Top 15 enriched GO BP terms are showed in the bar plot of each disease state in each tissue. Each row represents a significant GO biological process which is colored according to the -log10(p.adjust). |
| Page: 1 2 3 4 5 6 7 8 9 |
| GO ID | Tissue | Disease Stage | Description | Gene Ratio | Bg Ratio | pvalue | p.adjust | Count |
| GO:004819318 | Esophagus | ESCC | Golgi vesicle transport | 231/8552 | 296/18723 | 1.82e-30 | 9.63e-28 | 231 |
| GO:00070308 | Esophagus | ESCC | Golgi organization | 101/8552 | 157/18723 | 1.78e-06 | 2.10e-05 | 101 |
| GO:00068914 | Esophagus | ESCC | intra-Golgi vesicle-mediated transport | 26/8552 | 33/18723 | 1.06e-04 | 7.43e-04 | 26 |
| GO:004819321 | Liver | HCC | Golgi vesicle transport | 217/7958 | 296/18723 | 2.58e-27 | 1.02e-24 | 217 |
| GO:00070302 | Liver | HCC | Golgi organization | 99/7958 | 157/18723 | 1.54e-07 | 2.85e-06 | 99 |
| GO:0006891 | Liver | HCC | intra-Golgi vesicle-mediated transport | 22/7958 | 33/18723 | 4.38e-03 | 1.90e-02 | 22 |
| GO:004819315 | Oral cavity | OSCC | Golgi vesicle transport | 209/7305 | 296/18723 | 1.39e-28 | 6.30e-26 | 209 |
| GO:00070307 | Oral cavity | OSCC | Golgi organization | 92/7305 | 157/18723 | 4.96e-07 | 7.27e-06 | 92 |
| GO:00068913 | Oral cavity | OSCC | intra-Golgi vesicle-mediated transport | 23/7305 | 33/18723 | 3.47e-04 | 2.12e-03 | 23 |
| Page: 1 |
| Pathway ID | Tissue | Disease Stage | Description | Gene Ratio | Bg Ratio | pvalue | p.adjust | qvalue | Count |
| Page: 1 |
Top |
Cell-cell communication analysis |
| Identification of potential cell-cell interactions between two cell types and their ligand-receptor pairs for different disease states |
| Ligand | Receptor | LRpair | Pathway | Tissue | Disease Stage |
| Page: 1 |
Top |
Single-cell gene regulatory network inference analysis |
| Find out the significant the regulons (TFs) and the target genes of each regulon across cell types for different disease states |
| TF | Cell Type | Tissue | Disease Stage | Target Gene | RSS | Regulon Activity |
| ∗The dot plots of a searched regulon are shown for all cell subpopulations in each disease state of each tissue based on the regulon specific score inferred using pySCENIC and by calculating the average expression. |
| Page: 1 |
Top |
Somatic mutation of malignant transformation related genes |
| Annotation of somatic variants for genes involved in malignant transformation |
| Hugo Symbol | Variant Class | Variant Classification | dbSNP RS | HGVSc | HGVSp | HGVSp Short | SWISSPROT | BIOTYPE | SIFT | PolyPhen | Tumor Sample Barcode | Tissue | Histology | Sex | Age | Stage | Therapy Types | Drugs | Outcome |
| COG2 | SNV | Missense_Mutation | c.1505N>T | p.Thr502Ile | p.T502I | Q14746 | protein_coding | tolerated(0.11) | benign(0.003) | TCGA-A7-A0DA-01 | Breast | breast invasive carcinoma | Female | <65 | I/II | Chemotherapy | adriamycin | SD | |
| COG2 | SNV | Missense_Mutation | novel | c.701A>G | p.Tyr234Cys | p.Y234C | Q14746 | protein_coding | deleterious(0) | probably_damaging(0.999) | TCGA-AN-A046-01 | Breast | breast invasive carcinoma | Female | >=65 | I/II | Unknown | Unknown | SD |
| COG2 | SNV | Missense_Mutation | novel | c.1161A>C | p.Gln387His | p.Q387H | Q14746 | protein_coding | deleterious(0) | probably_damaging(0.962) | TCGA-AN-A046-01 | Breast | breast invasive carcinoma | Female | >=65 | I/II | Unknown | Unknown | SD |
| COG2 | SNV | Missense_Mutation | novel | c.1510C>T | p.Pro504Ser | p.P504S | Q14746 | protein_coding | tolerated(0.35) | benign(0) | TCGA-AN-A046-01 | Breast | breast invasive carcinoma | Female | >=65 | I/II | Unknown | Unknown | SD |
| COG2 | SNV | Missense_Mutation | c.1660G>A | p.Glu554Lys | p.E554K | Q14746 | protein_coding | tolerated(0.42) | benign(0.045) | TCGA-BH-A0HQ-01 | Breast | breast invasive carcinoma | Female | <65 | I/II | Hormone Therapy | arimidex | SD | |
| COG2 | SNV | Missense_Mutation | c.2092N>C | p.Asp698His | p.D698H | Q14746 | protein_coding | deleterious(0) | probably_damaging(1) | TCGA-EW-A1PB-01 | Breast | breast invasive carcinoma | Female | >=65 | III/IV | Unknown | Unknown | SD | |
| COG2 | insertion | In_Frame_Ins | novel | c.1319_1320insACA | p.Val440_His441insGln | p.V440_H441insQ | Q14746 | protein_coding | TCGA-AO-A03R-01 | Breast | breast invasive carcinoma | Female | <65 | I/II | Chemotherapy | doxorubicin | SD | ||
| COG2 | insertion | Frame_Shift_Ins | novel | c.1321_1322insTGGTTTTTTTTAGCAAATTGGCTGTG | p.His441LeufsTer48 | p.H441Lfs*48 | Q14746 | protein_coding | TCGA-AO-A03R-01 | Breast | breast invasive carcinoma | Female | <65 | I/II | Chemotherapy | doxorubicin | SD | ||
| COG2 | SNV | Missense_Mutation | novel | c.97G>C | p.Val33Leu | p.V33L | Q14746 | protein_coding | deleterious(0.01) | possibly_damaging(0.841) | TCGA-2W-A8YY-01 | Cervix | cervical & endocervical cancer | Female | <65 | I/II | Chemotherapy | cisplatin | CR |
| COG2 | SNV | Missense_Mutation | c.559N>G | p.Ser187Gly | p.S187G | Q14746 | protein_coding | deleterious(0) | benign(0.031) | TCGA-DS-A0VN-01 | Cervix | cervical & endocervical cancer | Female | <65 | I/II | Chemotherapy | cisplatin | SD |
| Page: 1 2 3 4 5 6 7 8 |
Top |
Related drugs of malignant transformation related genes |
| Identification of chemicals and drugs interact with genes involved in malignant transfromation |
| (DGIdb 4.0) |
| Entrez ID | Symbol | Category | Interaction Types | Drug Claim Name | Drug Name | PMIDs |
| Page: 1 |

Copyright 2023-Present -The University of Texas Health Science Center at Houston |