
|
|||||
|
 | |
| |
| |
| |
| |
| |
|
Gene: COBLL1 |
Gene summary for COBLL1 |
| Gene information | Species | Human | Gene symbol | COBLL1 | Gene ID | 22837 |
| Gene name | cordon-bleu WH2 repeat protein like 1 | |
| Gene Alias | COBLR1 | |
| Cytomap | 2q24.3 | |
| Gene Type | protein-coding | GO ID | GO:0005575 | UniProtAcc | A0A0D9SG04 |
Top |
Malignant transformation analysis |
| Identification of the aberrant gene expression in precancerous and cancerous lesions by comparing the gene expression of stem-like cells in diseased tissues with normal stem cells |
| Entrez ID | Symbol | Replicates | Species | Organ | Tissue | Adj P-value | Log2FC | Malignancy |
| 22837 | COBLL1 | CCI_1 | Human | Cervix | CC | 8.98e-09 | 1.24e+00 | 0.528 |
| 22837 | COBLL1 | CCI_2 | Human | Cervix | CC | 9.69e-10 | 1.56e+00 | 0.5249 |
| 22837 | COBLL1 | CCI_3 | Human | Cervix | CC | 1.31e-21 | 1.61e+00 | 0.516 |
| 22837 | COBLL1 | HTA11_3410_2000001011 | Human | Colorectum | AD | 5.35e-09 | -4.43e-01 | 0.0155 |
| 22837 | COBLL1 | HTA11_696_2000001011 | Human | Colorectum | AD | 1.21e-07 | -3.72e-01 | -0.1464 |
| 22837 | COBLL1 | HTA11_866_2000001011 | Human | Colorectum | AD | 1.50e-04 | -3.21e-01 | -0.1001 |
| 22837 | COBLL1 | HTA11_866_3004761011 | Human | Colorectum | AD | 2.06e-07 | -4.38e-01 | 0.096 |
| 22837 | COBLL1 | HTA11_10711_2000001011 | Human | Colorectum | AD | 1.65e-04 | -4.67e-01 | 0.0338 |
| 22837 | COBLL1 | HTA11_7696_3000711011 | Human | Colorectum | AD | 3.90e-06 | -3.17e-01 | 0.0674 |
| 22837 | COBLL1 | HTA11_99999970781_79442 | Human | Colorectum | MSS | 8.98e-12 | -3.94e-01 | 0.294 |
| 22837 | COBLL1 | HTA11_99999973899_84307 | Human | Colorectum | MSS | 3.24e-03 | -4.97e-01 | 0.2585 |
| 22837 | COBLL1 | HTA11_99999974143_84620 | Human | Colorectum | MSS | 6.92e-06 | -3.03e-01 | 0.3005 |
| 22837 | COBLL1 | F007 | Human | Colorectum | FAP | 5.74e-05 | -3.90e-01 | 0.1176 |
| 22837 | COBLL1 | A002-C-010 | Human | Colorectum | FAP | 1.72e-02 | -1.59e-01 | 0.242 |
| 22837 | COBLL1 | A001-C-207 | Human | Colorectum | FAP | 8.57e-05 | -3.35e-01 | 0.1278 |
| 22837 | COBLL1 | A015-C-203 | Human | Colorectum | FAP | 8.02e-28 | -4.12e-01 | -0.1294 |
| 22837 | COBLL1 | A015-C-204 | Human | Colorectum | FAP | 2.23e-09 | -4.39e-01 | -0.0228 |
| 22837 | COBLL1 | A014-C-040 | Human | Colorectum | FAP | 1.91e-02 | -2.59e-01 | -0.1184 |
| 22837 | COBLL1 | A002-C-201 | Human | Colorectum | FAP | 2.30e-14 | -4.18e-01 | 0.0324 |
| 22837 | COBLL1 | A002-C-203 | Human | Colorectum | FAP | 7.26e-05 | -1.83e-01 | 0.2786 |
| Page: 1 2 3 4 5 6 7 8 9 |
| Tissue | Expression Dynamics | Abbreviation |
| Cervix | 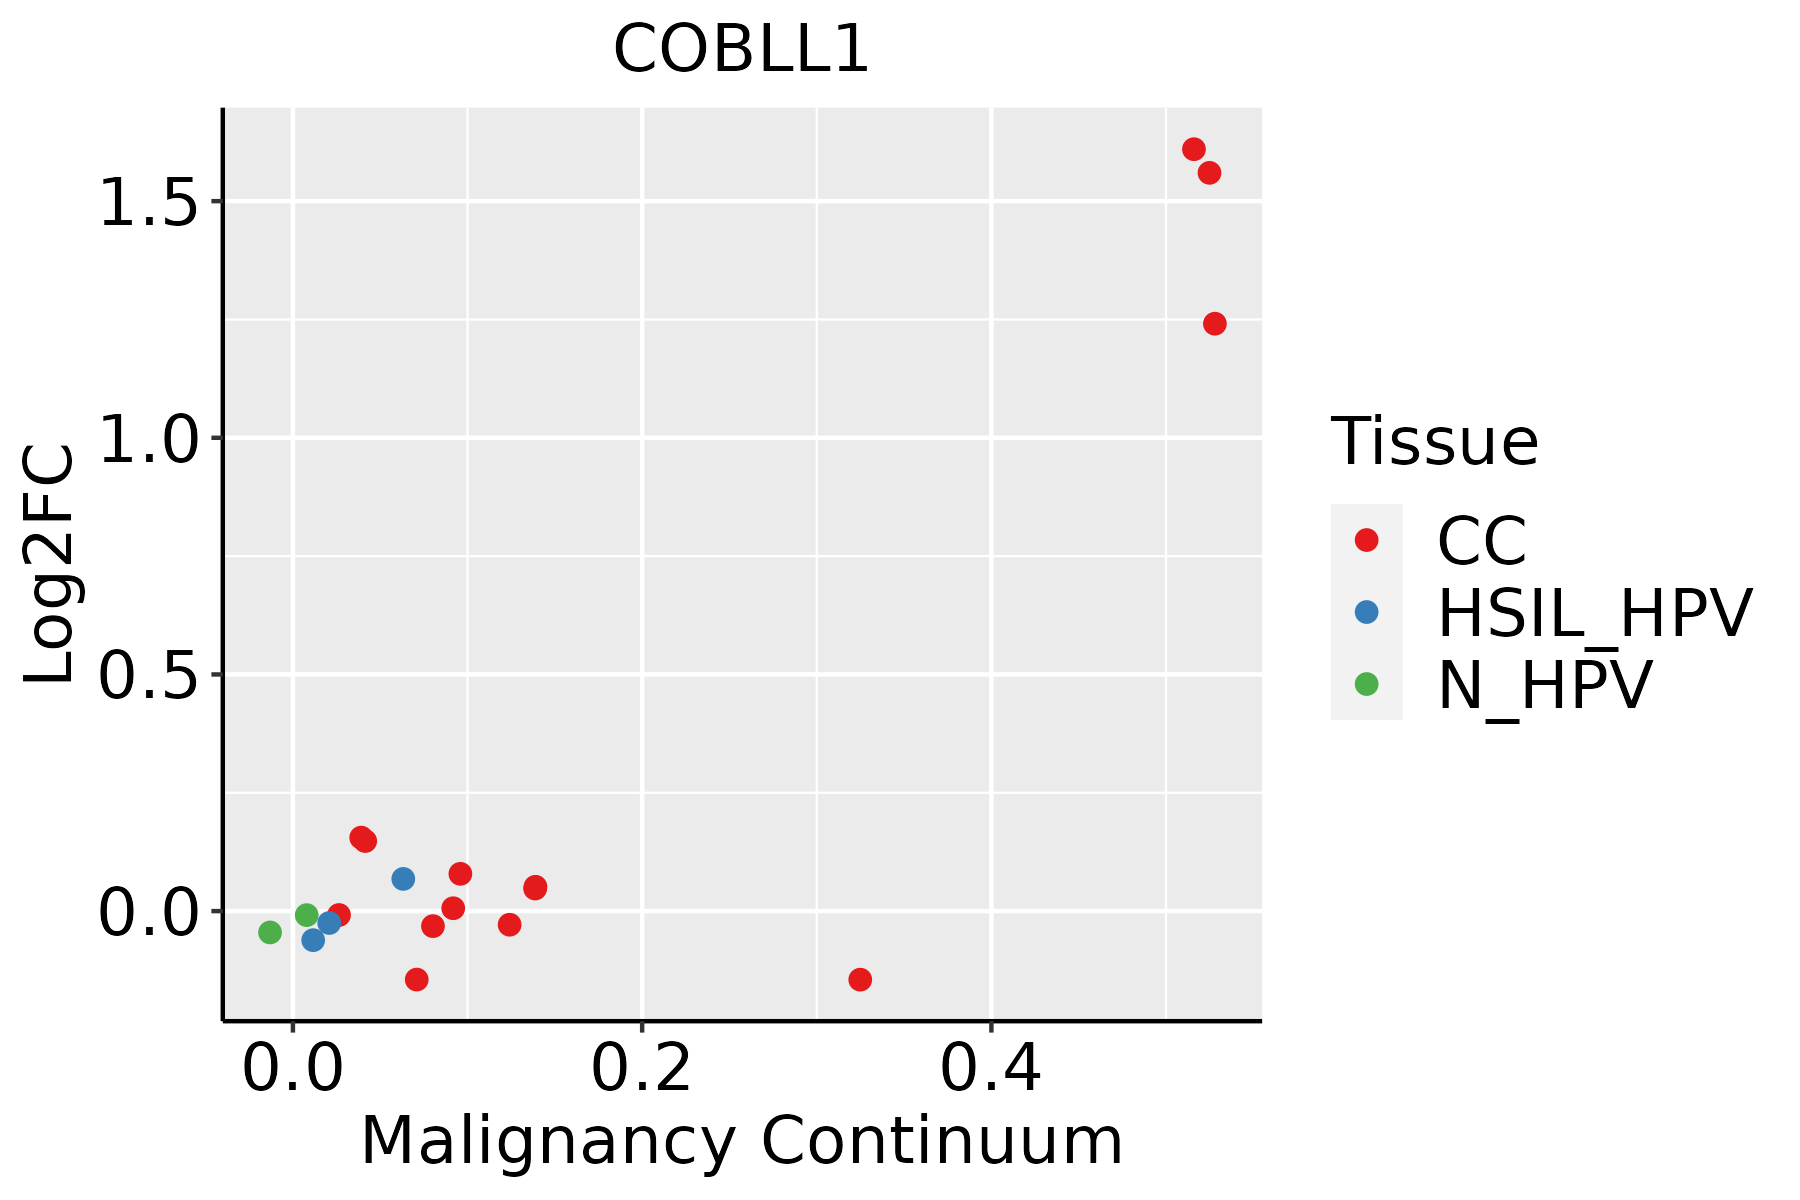 | CC: Cervix cancer |
| HSIL_HPV: HPV-infected high-grade squamous intraepithelial lesions | ||
| N_HPV: HPV-infected normal cervix | ||
| Colorectum (GSE201348) |  | FAP: Familial adenomatous polyposis |
| CRC: Colorectal cancer | ||
| Colorectum (HTA11) |  | AD: Adenomas |
| SER: Sessile serrated lesions | ||
| MSI-H: Microsatellite-high colorectal cancer | ||
| MSS: Microsatellite stable colorectal cancer | ||
| Esophagus | 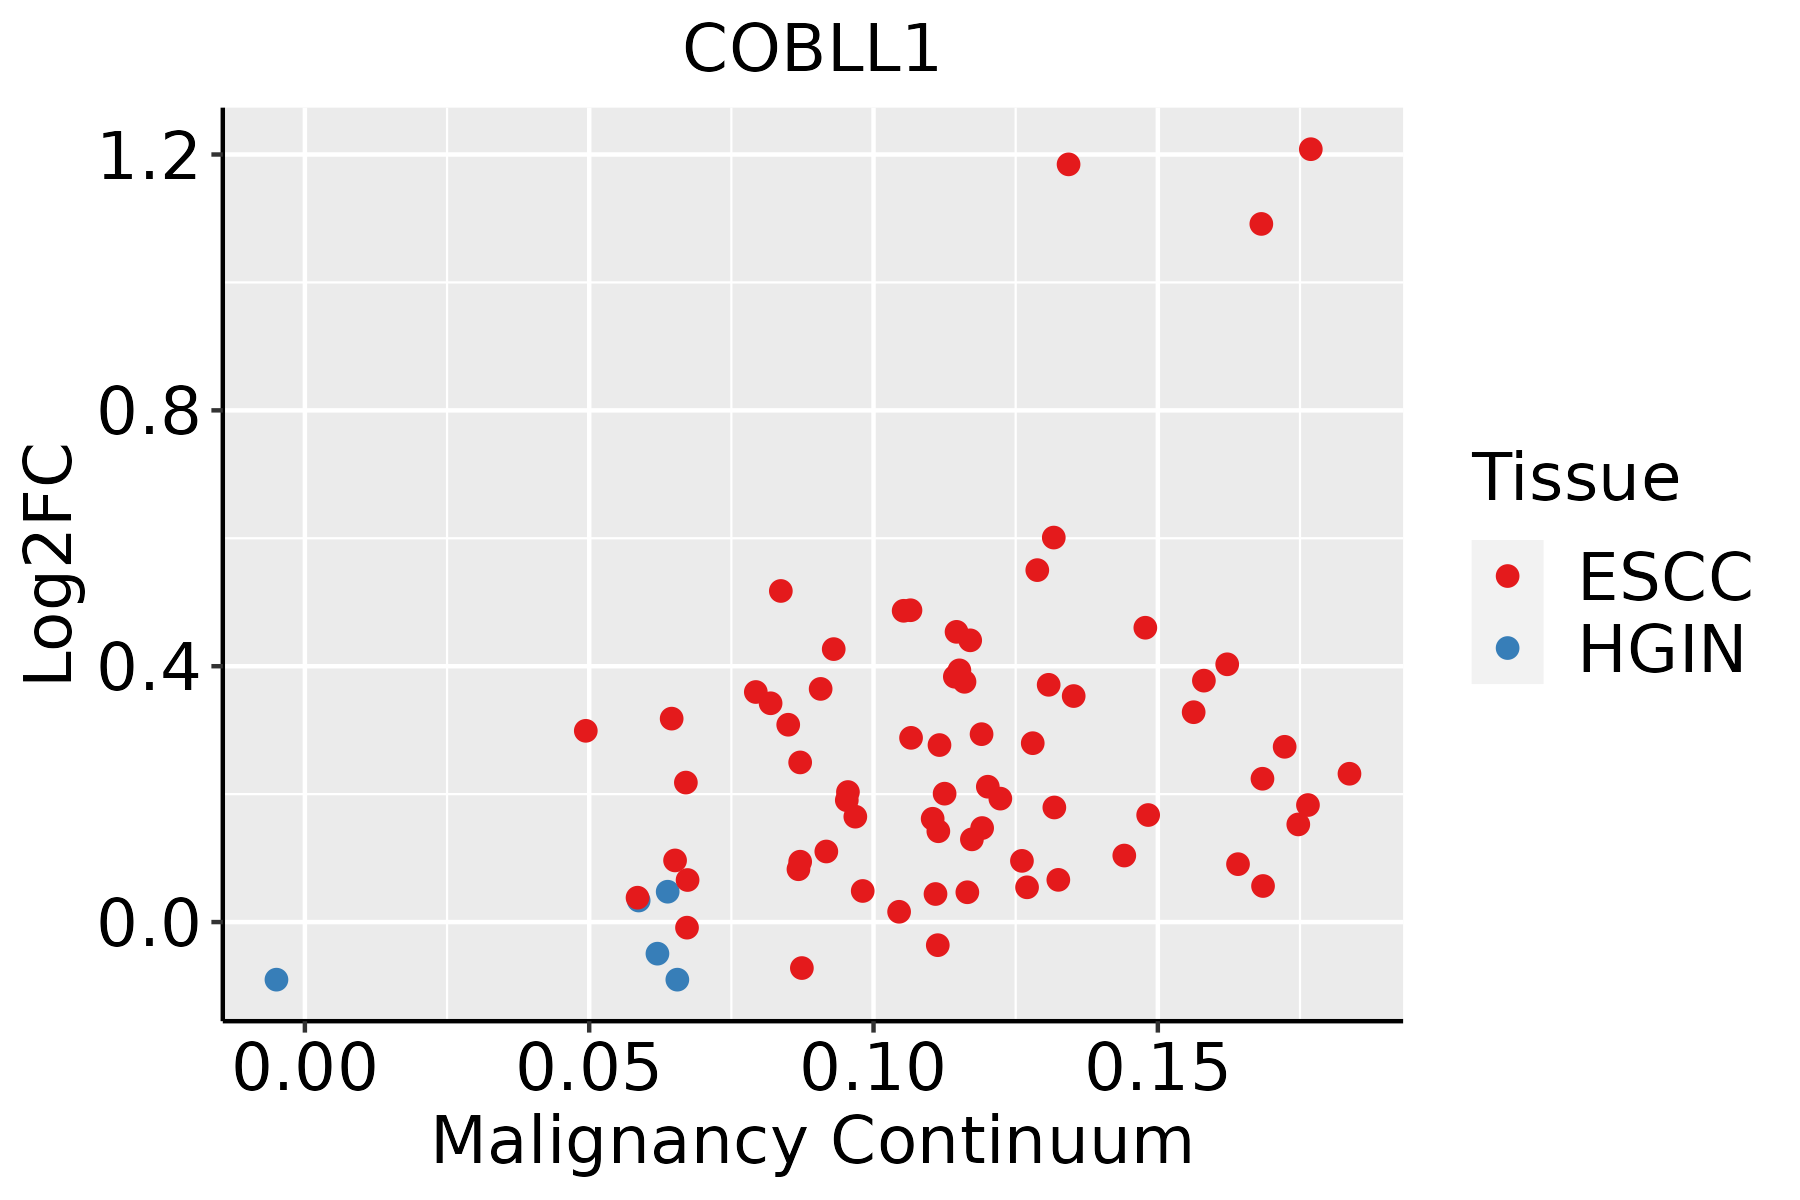 | ESCC: Esophageal squamous cell carcinoma |
| HGIN: High-grade intraepithelial neoplasias | ||
| LGIN: Low-grade intraepithelial neoplasias | ||
| Liver | 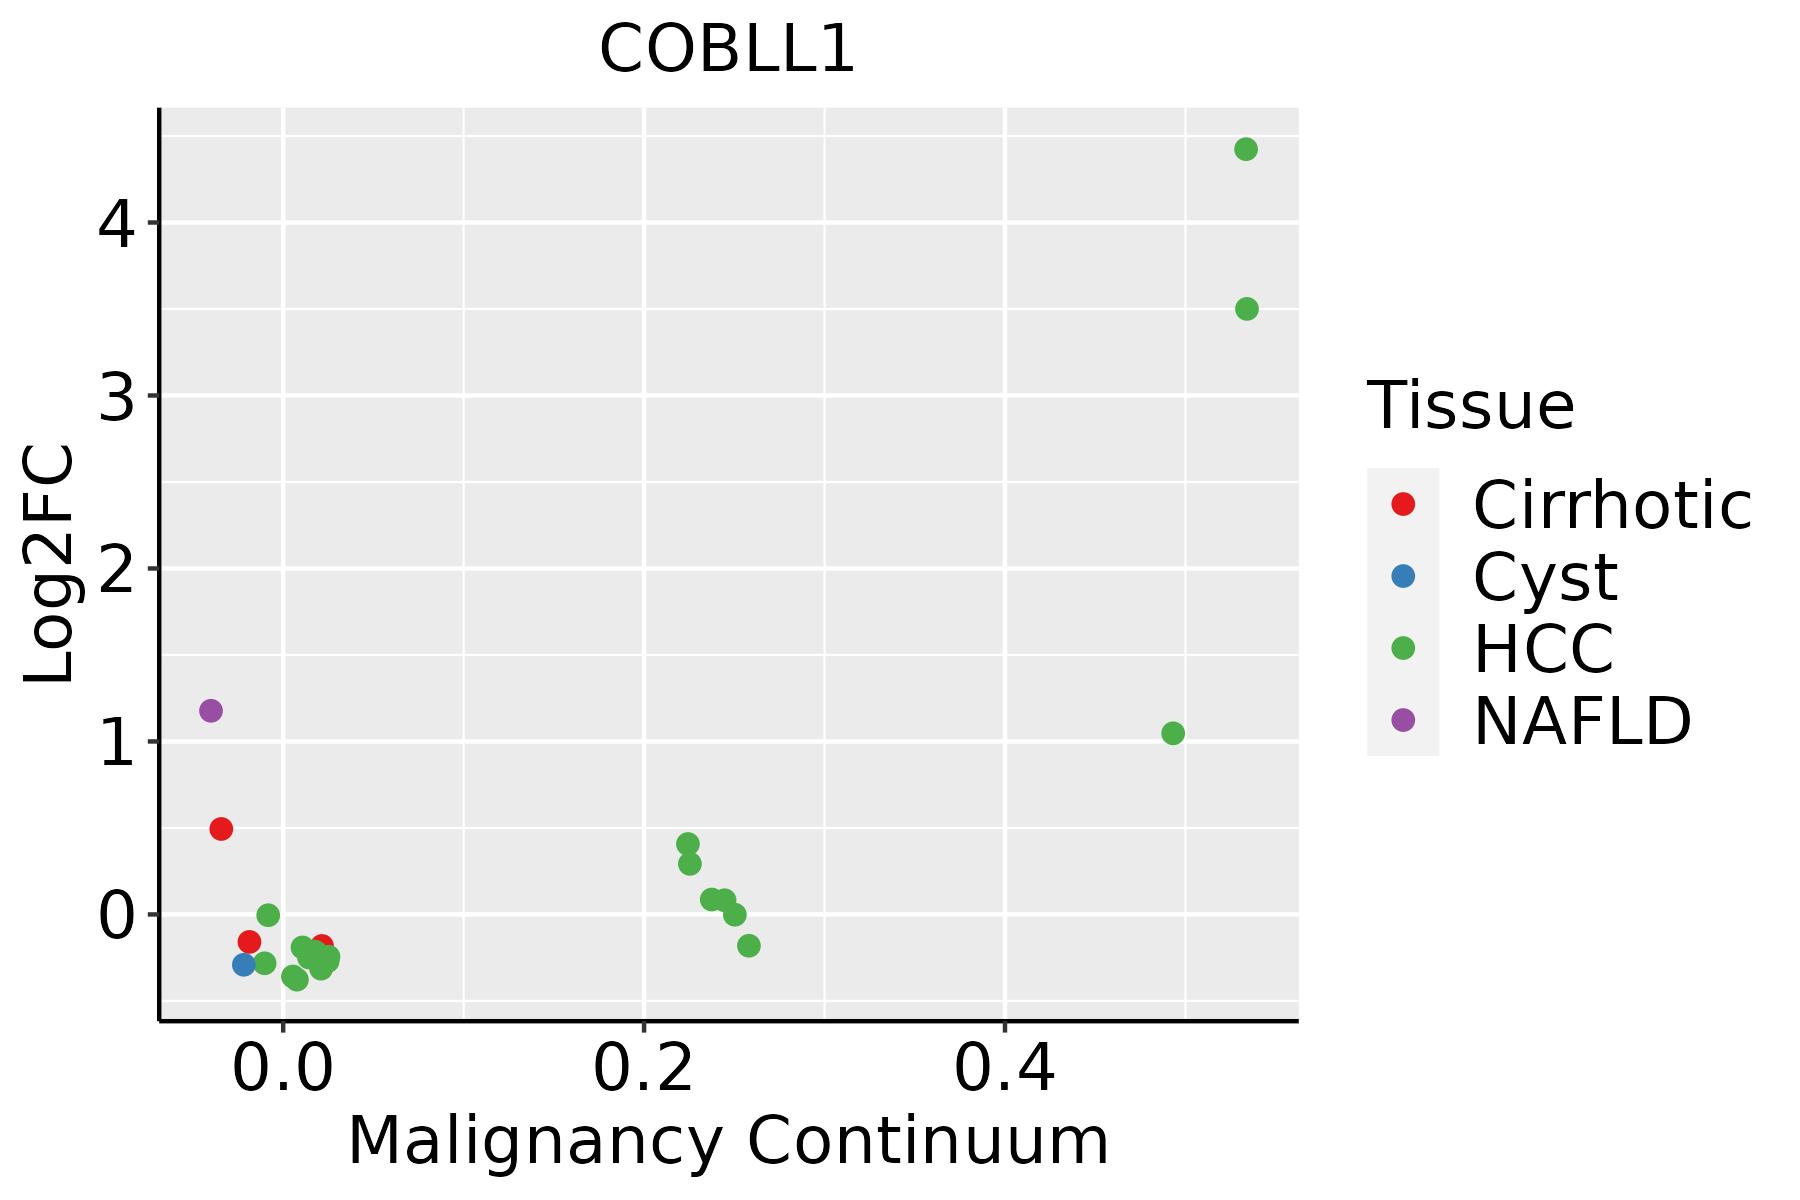 | HCC: Hepatocellular carcinoma |
| NAFLD: Non-alcoholic fatty liver disease | ||
| Lung | 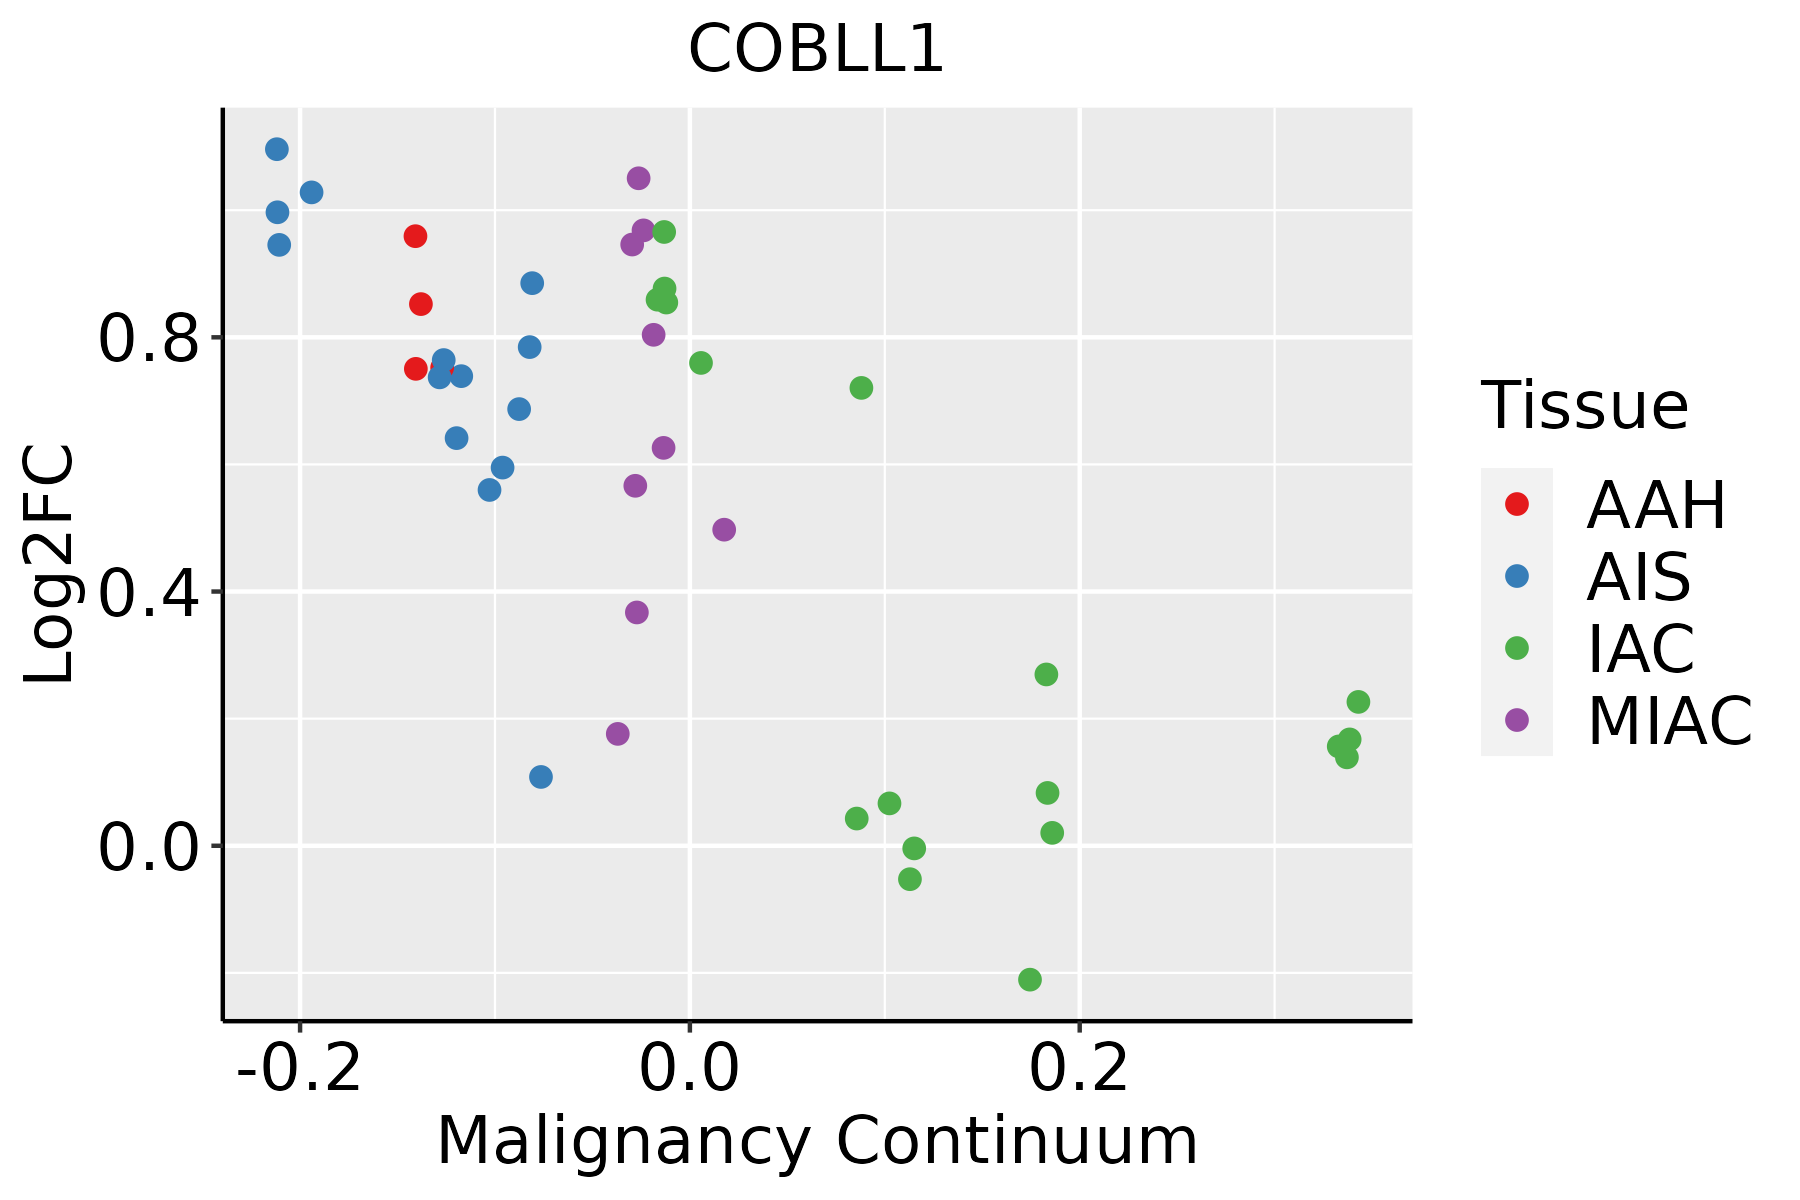 | AAH: Atypical adenomatous hyperplasia |
| AIS: Adenocarcinoma in situ | ||
| IAC: Invasive lung adenocarcinoma | ||
| MIA: Minimally invasive adenocarcinoma | ||
| Prostate |  | BPH: Benign Prostatic Hyperplasia |
| Skin | 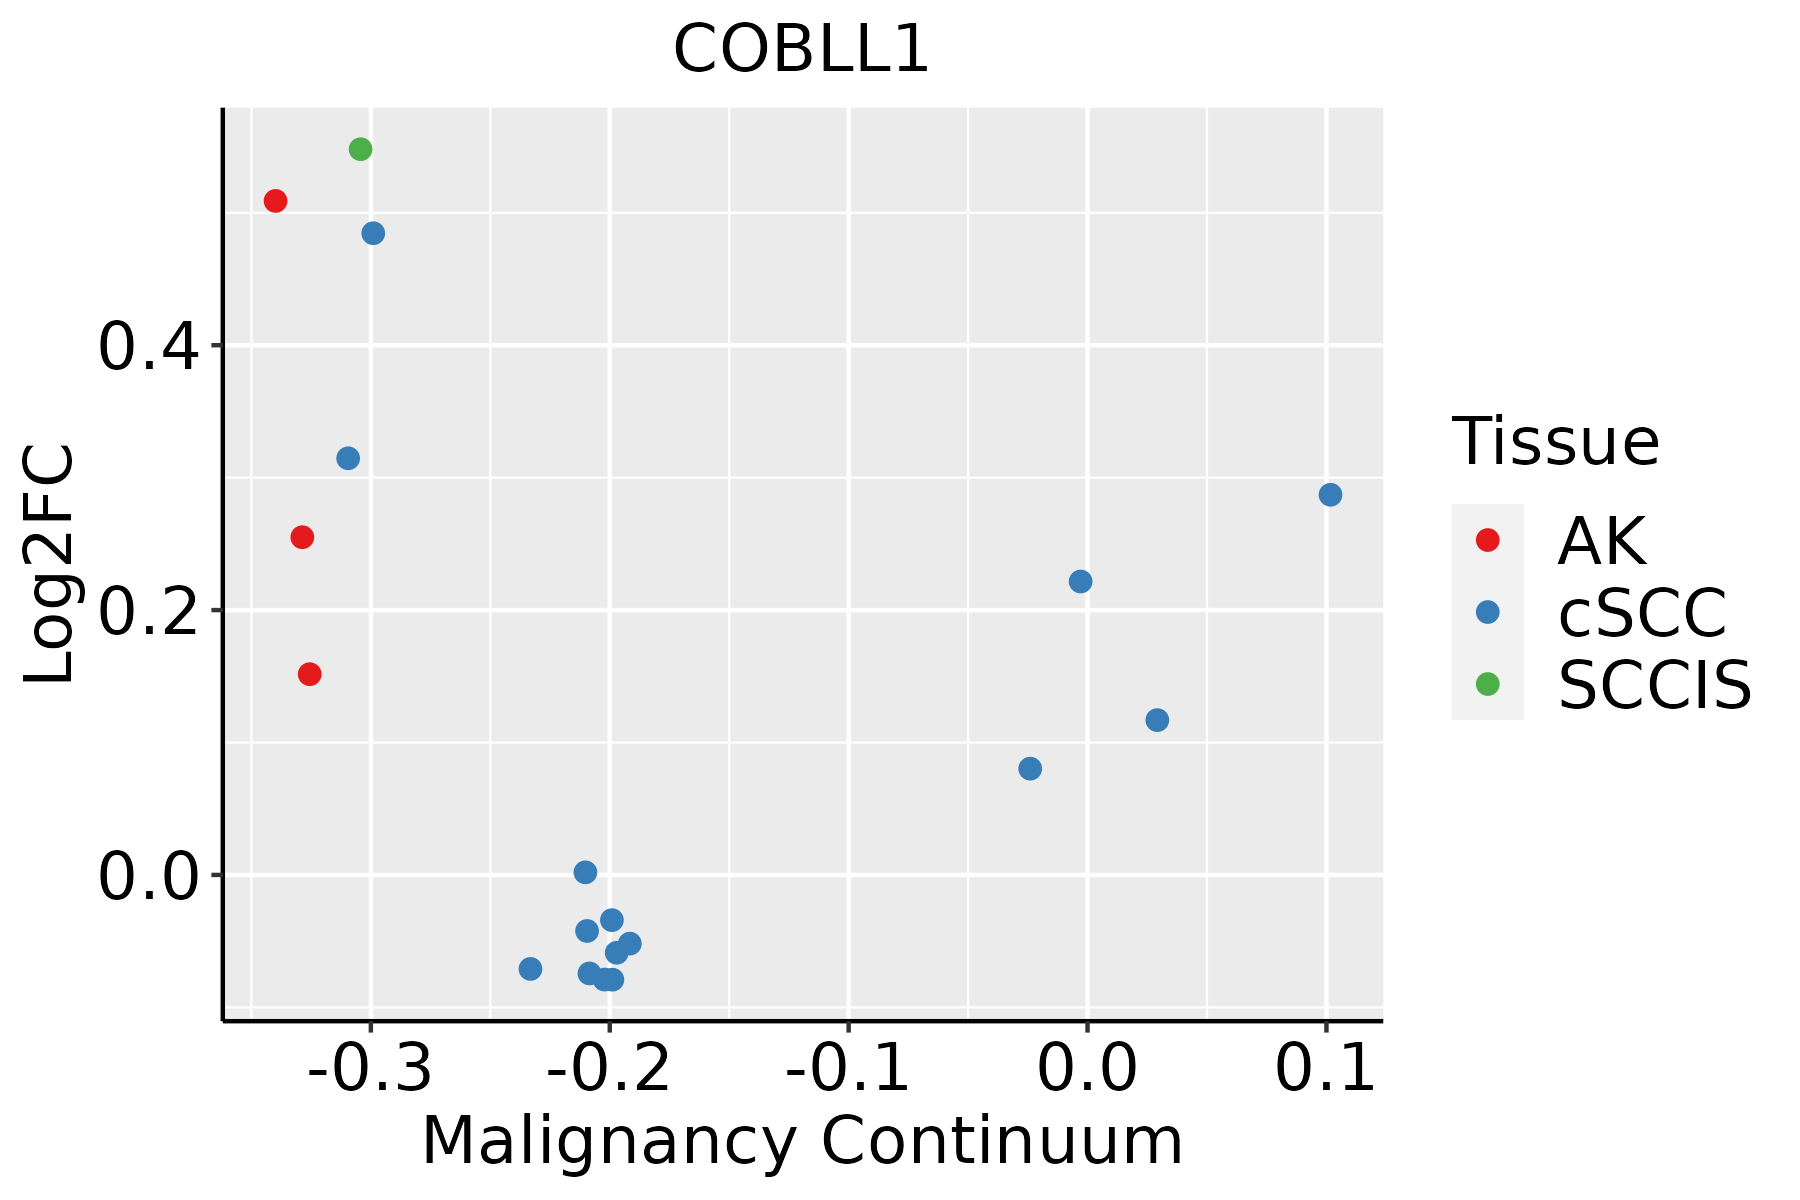 | AK: Actinic keratosis |
| cSCC: Cutaneous squamous cell carcinoma | ||
| SCCIS:squamous cell carcinoma in situ | ||
| Thyroid | 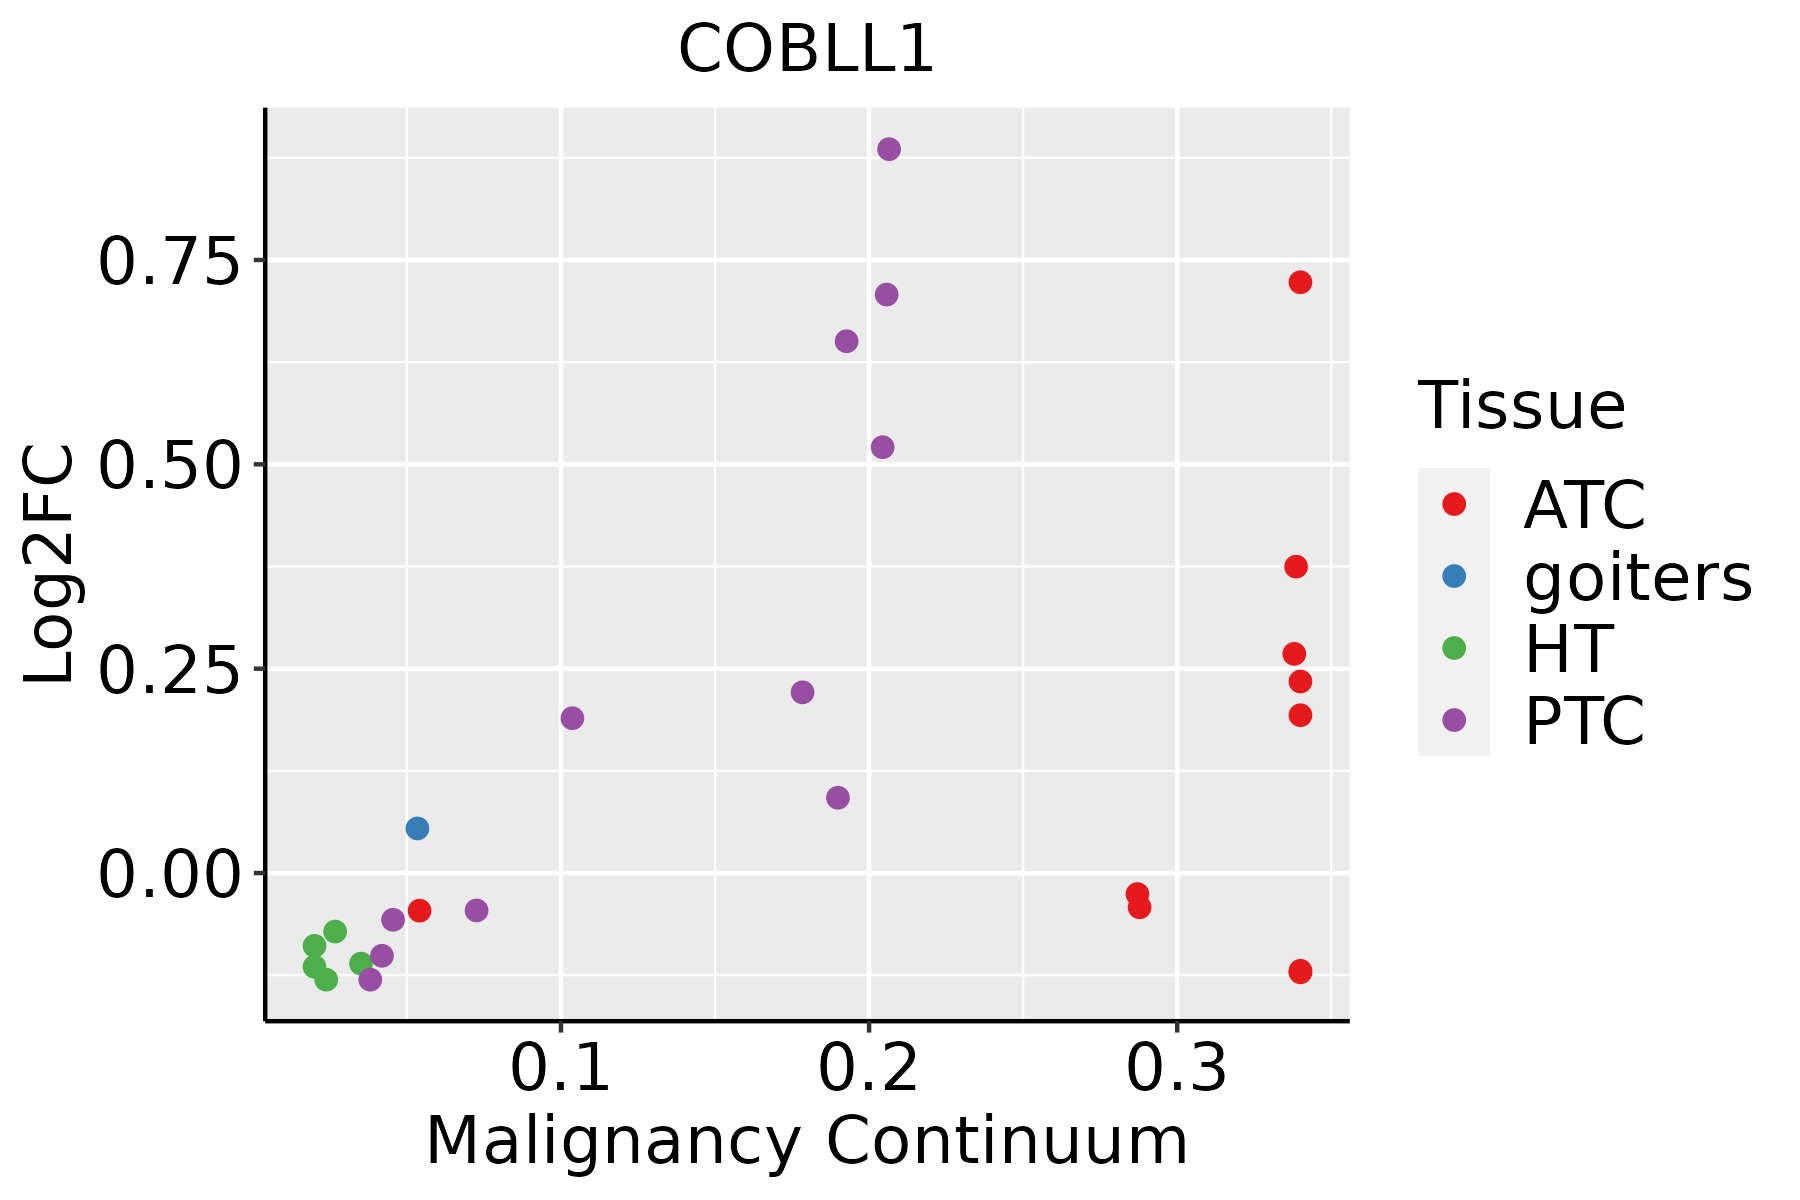 | ATC: Anaplastic thyroid cancer |
| HT: Hashimoto's thyroiditis | ||
| PTC: Papillary thyroid cancer |
| ∗log2FC in expression of this searched gene in stem-like cells from each diseased tissue sample relative to stem-like cells in normal samples in each tissue plotted against the malignancy continuum. Samples are colored based on if they are from different disease stage. |
Top |
Malignant transformation related pathway analysis |
| Find out the enriched GO biological processes and KEGG pathways involved in transition from healthy to precancer to cancer |
| Tissue | Disease Stage | Enriched GO biological Processes |
| Colorectum | AD |  |
| Colorectum | SER |  |
| Colorectum | MSS |  |
| Colorectum | MSI-H |  |
| Colorectum | FAP |  |
| ∗Top 15 enriched GO BP terms are showed in the bar plot of each disease state in each tissue. Each row represents a significant GO biological process which is colored according to the -log10(p.adjust). |
| Page: 1 2 3 4 5 6 7 8 9 |
| GO ID | Tissue | Disease Stage | Description | Gene Ratio | Bg Ratio | pvalue | p.adjust | Count |
| Page: 1 |
| Pathway ID | Tissue | Disease Stage | Description | Gene Ratio | Bg Ratio | pvalue | p.adjust | qvalue | Count |
| Page: 1 |
Top |
Cell-cell communication analysis |
| Identification of potential cell-cell interactions between two cell types and their ligand-receptor pairs for different disease states |
| Ligand | Receptor | LRpair | Pathway | Tissue | Disease Stage |
| Page: 1 |
Top |
Single-cell gene regulatory network inference analysis |
| Find out the significant the regulons (TFs) and the target genes of each regulon across cell types for different disease states |
| TF | Cell Type | Tissue | Disease Stage | Target Gene | RSS | Regulon Activity |
| ∗The dot plots of a searched regulon are shown for all cell subpopulations in each disease state of each tissue based on the regulon specific score inferred using pySCENIC and by calculating the average expression. |
| Page: 1 |
Top |
Somatic mutation of malignant transformation related genes |
| Annotation of somatic variants for genes involved in malignant transformation |
| Hugo Symbol | Variant Class | Variant Classification | dbSNP RS | HGVSc | HGVSp | HGVSp Short | SWISSPROT | BIOTYPE | SIFT | PolyPhen | Tumor Sample Barcode | Tissue | Histology | Sex | Age | Stage | Therapy Types | Drugs | Outcome |
| COBLL1 | SNV | Missense_Mutation | novel | c.3592G>A | p.Glu1198Lys | p.E1198K | protein_coding | deleterious(0) | probably_damaging(0.953) | TCGA-5L-AAT1-01 | Breast | breast invasive carcinoma | Female | <65 | III/IV | Hormone Therapy | letrozol | SD | |
| COBLL1 | SNV | Missense_Mutation | novel | c.3222N>C | p.Lys1074Asn | p.K1074N | protein_coding | deleterious(0) | probably_damaging(0.984) | TCGA-A7-A4SA-01 | Breast | breast invasive carcinoma | Female | <65 | I/II | Chemotherapy | doxorubicin | CR | |
| COBLL1 | SNV | Missense_Mutation | novel | c.2841N>T | p.Leu947Phe | p.L947F | protein_coding | deleterious(0.01) | probably_damaging(0.988) | TCGA-AN-A046-01 | Breast | breast invasive carcinoma | Female | >=65 | I/II | Unknown | Unknown | SD | |
| COBLL1 | SNV | Missense_Mutation | novel | c.2251N>C | p.Ser751Arg | p.S751R | protein_coding | tolerated(0.27) | benign(0.02) | TCGA-AN-A046-01 | Breast | breast invasive carcinoma | Female | >=65 | I/II | Unknown | Unknown | SD | |
| COBLL1 | SNV | Missense_Mutation | c.2912N>G | p.Ser971Cys | p.S971C | protein_coding | deleterious(0) | probably_damaging(0.99) | TCGA-AN-A0FJ-01 | Breast | breast invasive carcinoma | Female | <65 | III/IV | Unknown | Unknown | SD | ||
| COBLL1 | SNV | Missense_Mutation | c.3314N>T | p.Ser1105Ile | p.S1105I | protein_coding | deleterious(0) | probably_damaging(0.985) | TCGA-BH-A0DK-01 | Breast | breast invasive carcinoma | Female | <65 | I/II | Hormone Therapy | tamoxiphen | SD | ||
| COBLL1 | SNV | Missense_Mutation | c.2761N>A | p.Asp921Asn | p.D921N | protein_coding | tolerated(0.5) | benign(0.001) | TCGA-BH-A0H9-01 | Breast | breast invasive carcinoma | Female | >=65 | I/II | Hormone Therapy | arimidex | SD | ||
| COBLL1 | SNV | Missense_Mutation | c.1173N>C | p.Met391Ile | p.M391I | protein_coding | tolerated(0.36) | benign(0.022) | TCGA-C8-A1HM-01 | Breast | breast invasive carcinoma | Female | >=65 | I/II | Chemotherapy | doxorubicin | CR | ||
| COBLL1 | SNV | Missense_Mutation | c.1173N>A | p.Met391Ile | p.M391I | protein_coding | tolerated(0.36) | benign(0.022) | TCGA-PE-A5DE-01 | Breast | breast invasive carcinoma | Female | <65 | I/II | Chemotherapy | taxotere | CR | ||
| COBLL1 | insertion | Nonsense_Mutation | novel | c.3451_3452insAGGAGGTATGAGTGACAGCCATTCCTCCCAGAGGACTT | p.Ala1151GlufsTer4 | p.A1151Efs*4 | protein_coding | TCGA-A2-A0EQ-01 | Breast | breast invasive carcinoma | Female | <65 | I/II | Chemotherapy | adriamycin | SD |
| Page: 1 2 3 4 5 6 7 8 9 10 11 12 |
Top |
Related drugs of malignant transformation related genes |
| Identification of chemicals and drugs interact with genes involved in malignant transfromation |
| (DGIdb 4.0) |
| Entrez ID | Symbol | Category | Interaction Types | Drug Claim Name | Drug Name | PMIDs |
| Page: 1 |

Copyright 2023-Present -The University of Texas Health Science Center at Houston |