Schematic overview of the cellular and molecular mechanisms involved in the cancer progression, including the proposed cellular and molecular mechanisms in cancer cells trajectory. AT1: alveolar type 1 cells; AT2: alveolar type 2 cells; AAH: atypical adenomatous hyperplasia; AIS: adenocarcinoma in situ; MIA: minimally invasive adenocarcinoma; IA: invasive adenocarcinoma; EMT: epithelial-mesenchymal transition

Home

Download

Statistics

Help

Contact

Center for Computational Systems Medicine
leaf

Gene summary

leaf

Malignant transformation analysis

leaf

Malignant transformation related pathway analysis

leaf

Cell-cell communication analysis

leaf

Single-cell gene regulatory network inference analysis

leaf

Somatic mutation of malignant transformation related genes

leaf

Related drugs of malignant transformation related genes

Gene: COBL

Gene summary for COBL

check button Gene summary.

Gene informationSpeciesHuman
Gene symbol

COBL

Gene ID

23242

Gene namecordon-bleu WH2 repeat protein
Gene AliasCOBL
Cytomap7p12.1
Gene Typeprotein-coding
GO ID

GO:0000578

UniProtAcc

O75128


Top

Malignant transformation analysis

check button Identification of the aberrant gene expression in precancerous and cancerous lesions by comparing the gene expression of stem-like cells in diseased tissues with normal stem cells
check button Malignant transformation involving gene list.
Entrez IDSymbolReplicatesSpeciesOrganTissueAdj P-valueLog2FCMalignancy
23242COBLHTA11_3410_2000001011HumanColorectumAD9.76e-11-5.01e-010.0155
23242COBLHTA11_347_2000001011HumanColorectumAD1.95e-146.70e-01-0.1954
23242COBLHTA11_411_2000001011HumanColorectumSER9.75e-038.30e-01-0.2602
23242COBLHTA11_696_2000001011HumanColorectumAD3.23e-054.18e-01-0.1464
23242COBLHTA11_99999970781_79442HumanColorectumMSS1.46e-02-3.60e-010.294
23242COBLA015-C-203HumanColorectumFAP2.41e-13-3.60e-01-0.1294
23242COBLA015-C-204HumanColorectumFAP1.24e-02-2.81e-01-0.0228
23242COBLA002-C-201HumanColorectumFAP7.06e-08-3.29e-010.0324
23242COBLA001-C-108HumanColorectumFAP5.61e-04-1.73e-01-0.0272
23242COBLA002-C-205HumanColorectumFAP6.75e-14-3.56e-01-0.1236
23242COBLA015-C-006HumanColorectumFAP5.93e-06-2.26e-01-0.0994
23242COBLA015-C-106HumanColorectumFAP8.45e-03-1.63e-01-0.0511
23242COBLA002-C-114HumanColorectumFAP7.78e-10-2.47e-01-0.1561
23242COBLA015-C-104HumanColorectumFAP1.57e-14-3.01e-01-0.1899
23242COBLA001-C-014HumanColorectumFAP1.37e-02-1.76e-010.0135
23242COBLA002-C-016HumanColorectumFAP7.60e-13-3.30e-010.0521
23242COBLA015-C-002HumanColorectumFAP1.34e-04-2.94e-01-0.0763
23242COBLA001-C-203HumanColorectumFAP7.08e-05-1.73e-01-0.0481
23242COBLA002-C-116HumanColorectumFAP1.10e-15-3.61e-01-0.0452
23242COBLA014-C-008HumanColorectumFAP1.51e-06-2.00e-01-0.191
Page: 1 2 3 4 5 

check button Transcriptomic changes along malignancy continuum.
TissueExpression DynamicsAbbreviation
Colorectum (GSE201348)The image shows the transcriptomic changes along malignancy continuum.log2FC in expression of this searched gene in stem-like cells from each diseased tissue sample relative to stem-like cells in normal samples in each tissue plotted against the malignancy continuum. Samples are colored based on if they are from different disease stage.FAP: Familial adenomatous polyposis
CRC: Colorectal cancer
Colorectum (HTA11)The image shows the transcriptomic changes along malignancy continuum.log2FC in expression of this searched gene in stem-like cells from each diseased tissue sample relative to stem-like cells in normal samples in each tissue plotted against the malignancy continuum. Samples are colored based on if they are from different disease stage.AD: Adenomas
SER: Sessile serrated lesions
MSI-H: Microsatellite-high colorectal cancer
MSS: Microsatellite stable colorectal cancer
EndometriumThe image shows the transcriptomic changes along malignancy continuum.log2FC in expression of this searched gene in stem-like cells from each diseased tissue sample relative to stem-like cells in normal samples in each tissue plotted against the malignancy continuum. Samples are colored based on if they are from different disease stage.
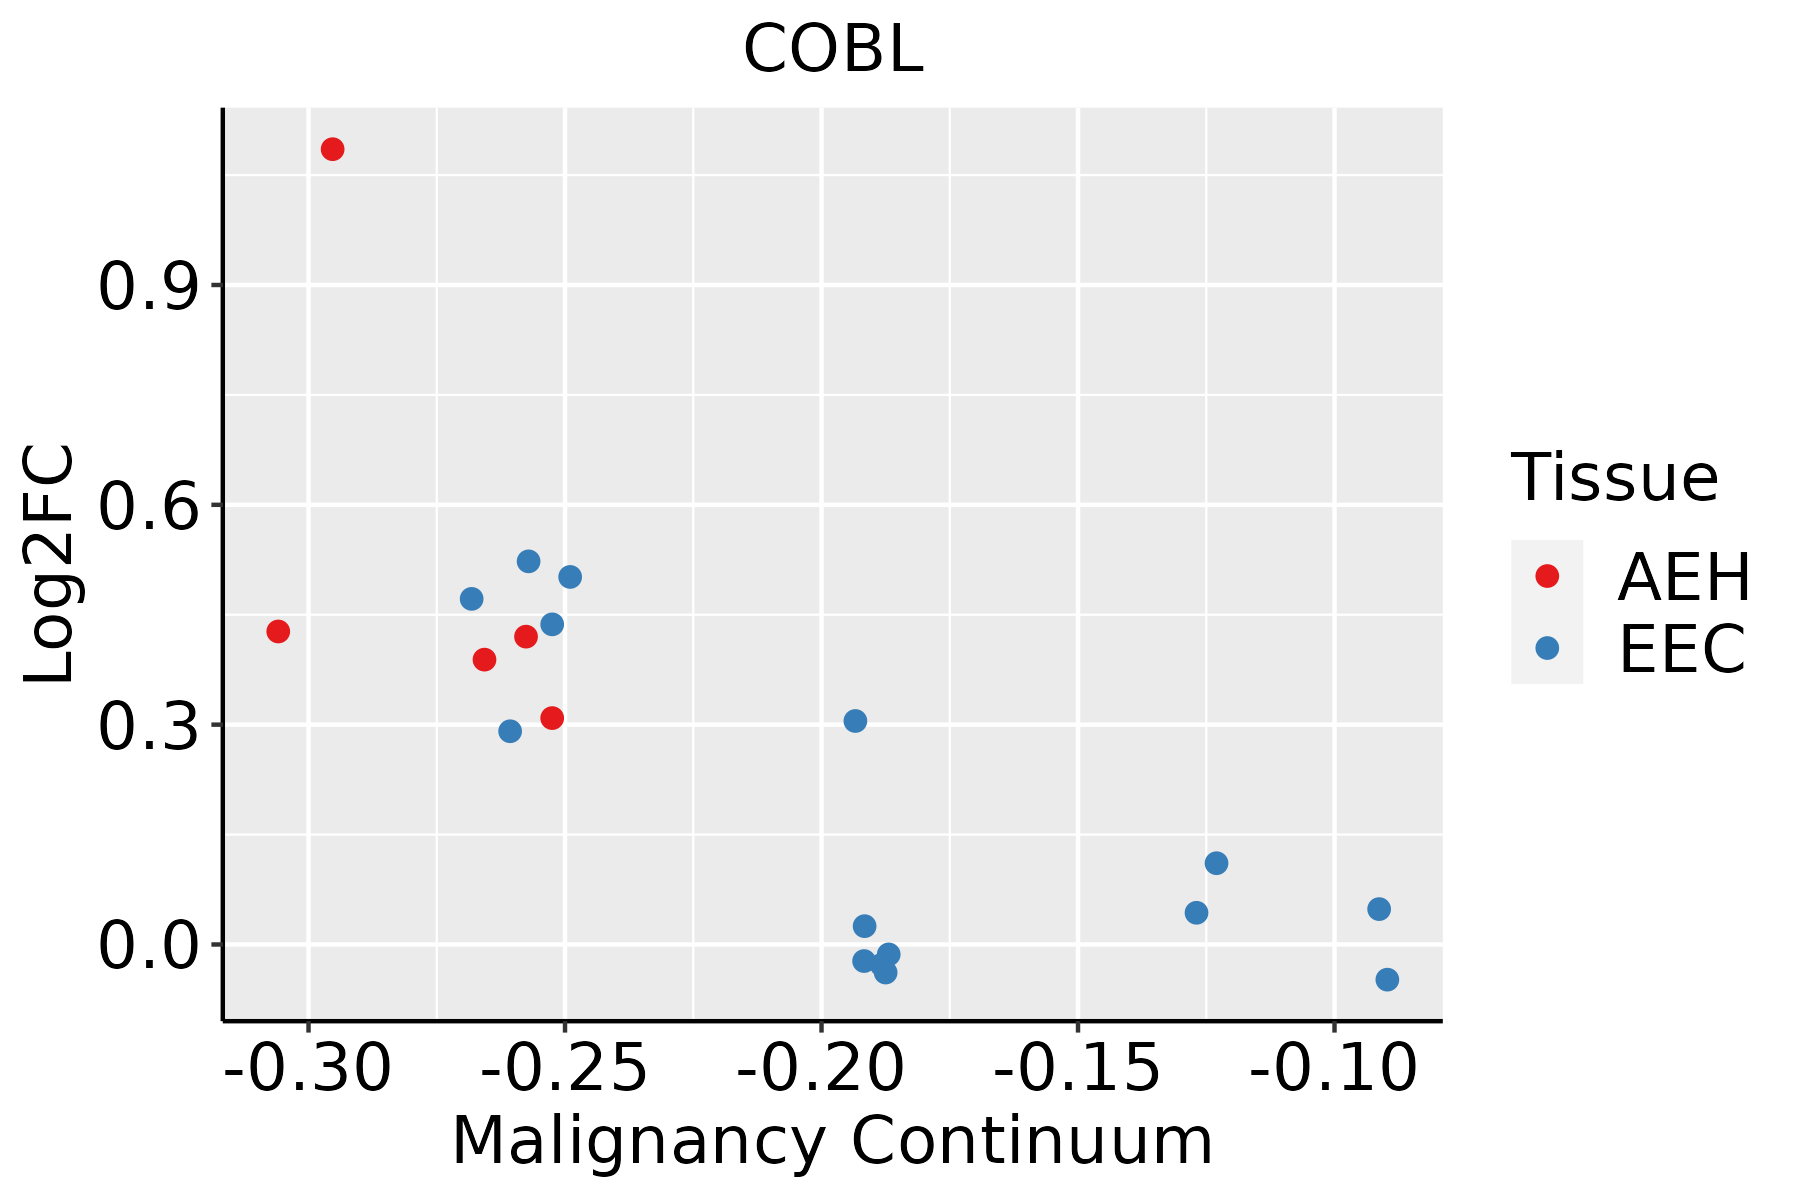
AEH: Atypical endometrial hyperplasia
EEC: Endometrioid Cancer
GCThe image shows the transcriptomic changes along malignancy continuum.log2FC in expression of this searched gene in stem-like cells from each diseased tissue sample relative to stem-like cells in normal samples in each tissue plotted against the malignancy continuum. Samples are colored based on if they are from different disease stage.
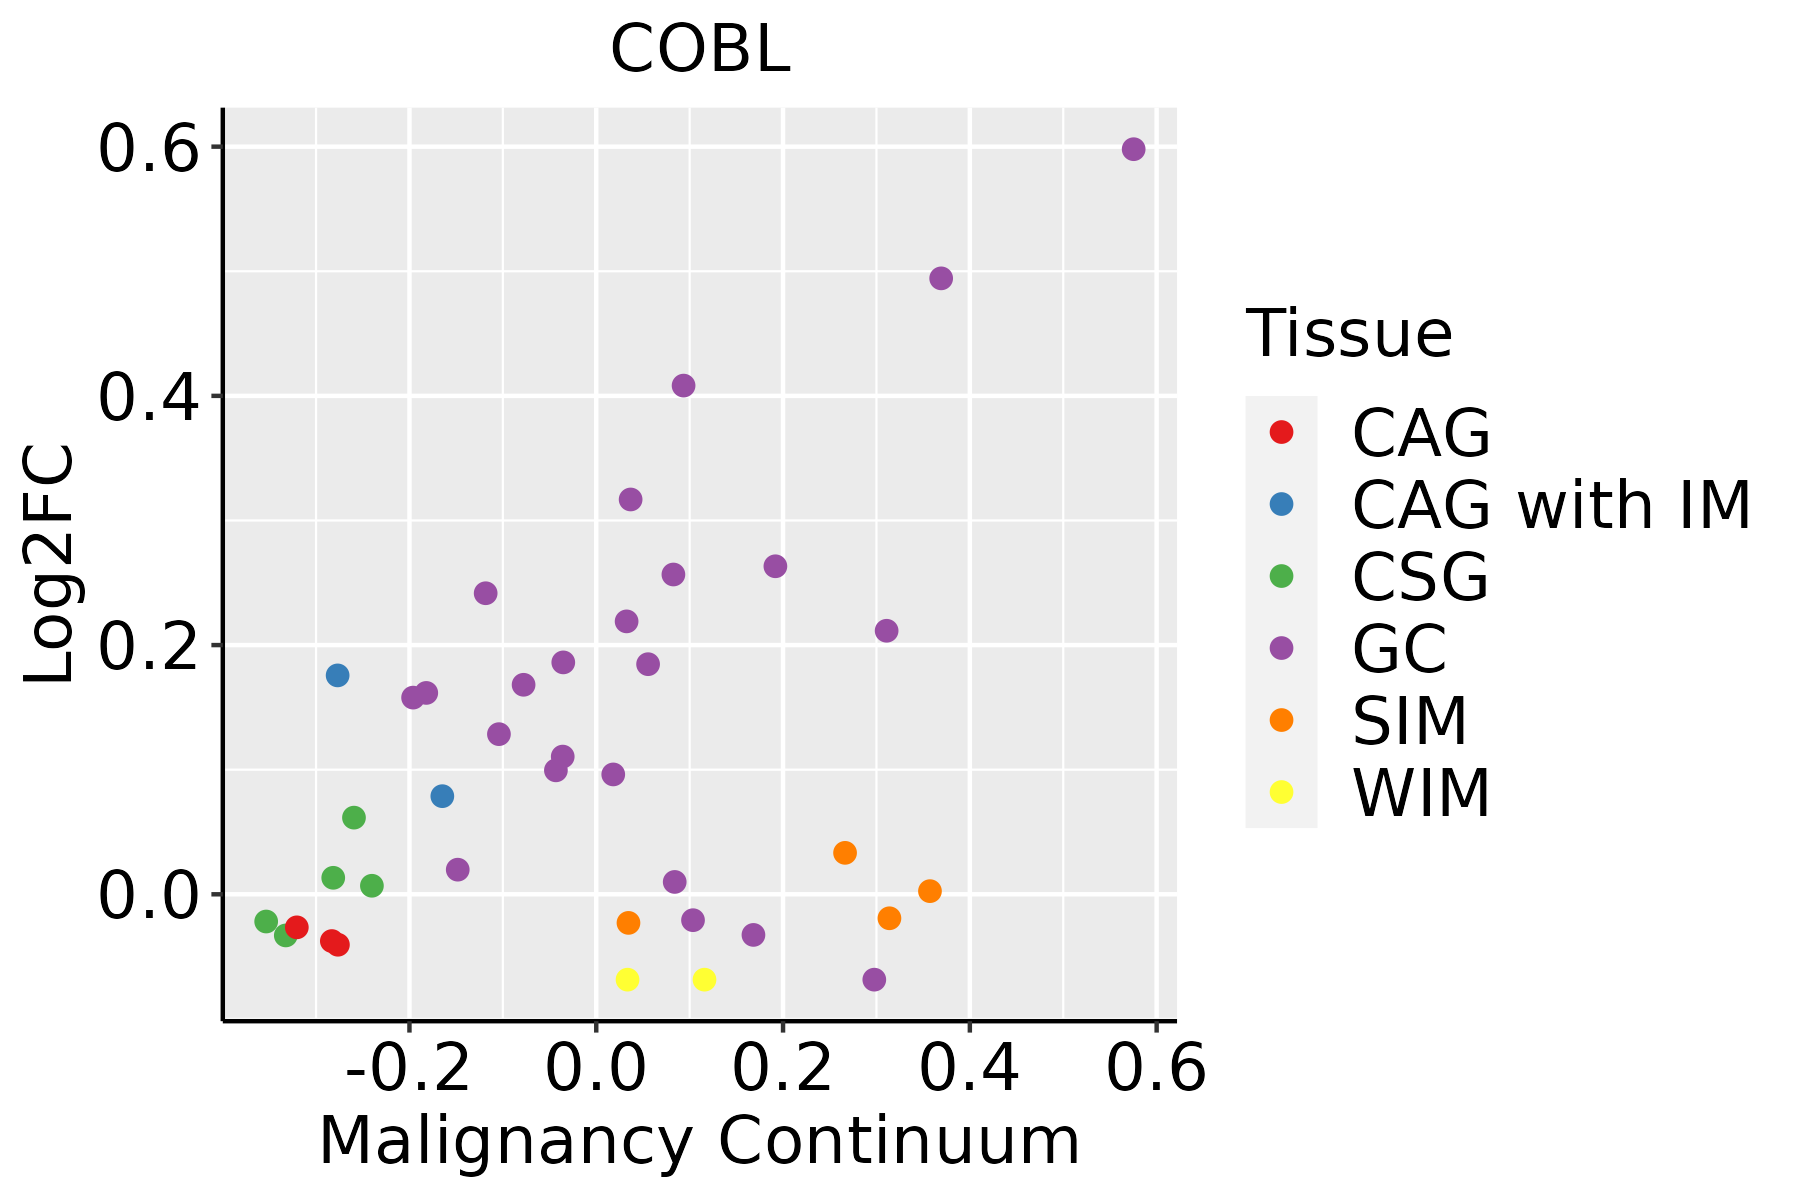
CAG: Chronic atrophic gastritis
CAG with IM: Chronic atrophic gastritis with intestinal metaplasia
CSG: Chronic superficial gastritis
GC: Gastric cancer
SIM: Severe intestinal metaplasia
WIM: Wild intestinal metaplasia
LiverThe image shows the transcriptomic changes along malignancy continuum.log2FC in expression of this searched gene in stem-like cells from each diseased tissue sample relative to stem-like cells in normal samples in each tissue plotted against the malignancy continuum. Samples are colored based on if they are from different disease stage.
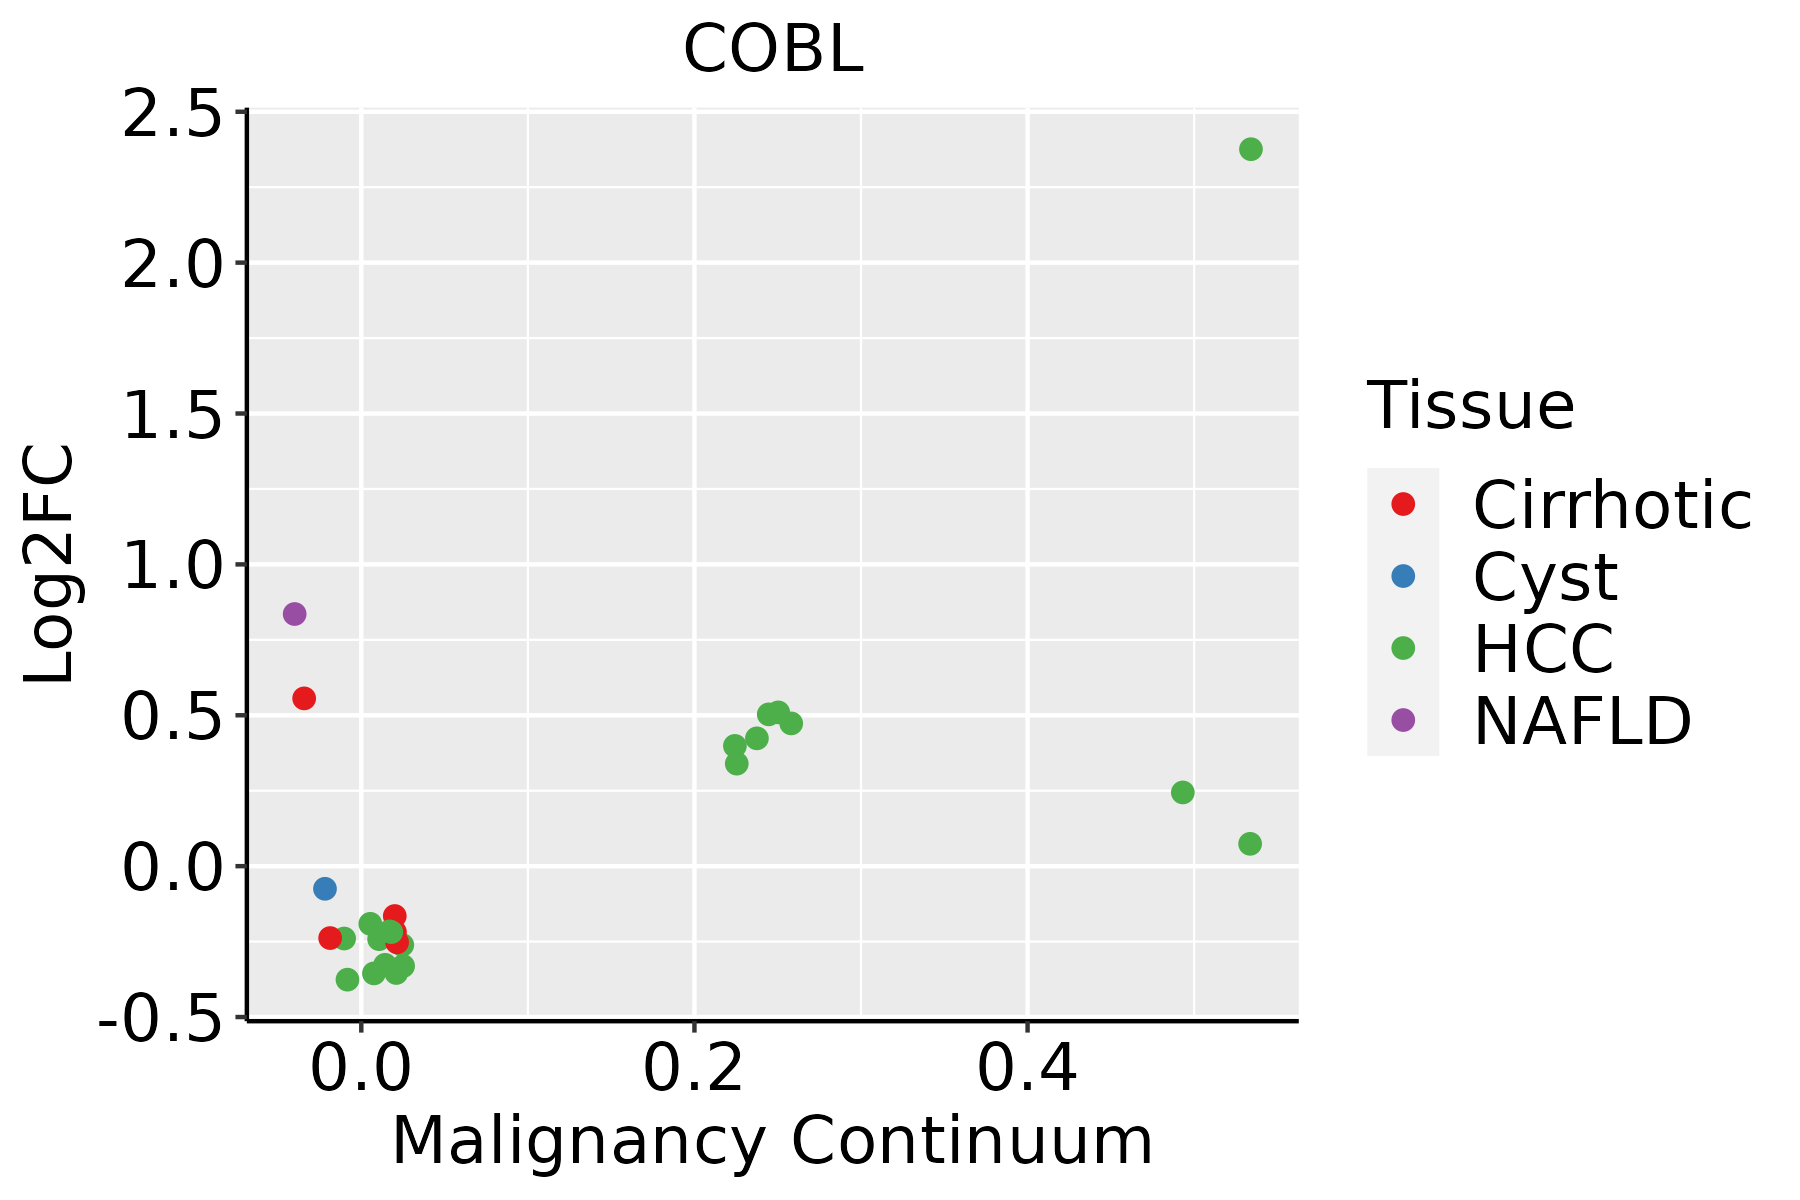
HCC: Hepatocellular carcinoma
NAFLD: Non-alcoholic fatty liver disease
LungThe image shows the transcriptomic changes along malignancy continuum.log2FC in expression of this searched gene in stem-like cells from each diseased tissue sample relative to stem-like cells in normal samples in each tissue plotted against the malignancy continuum. Samples are colored based on if they are from different disease stage.
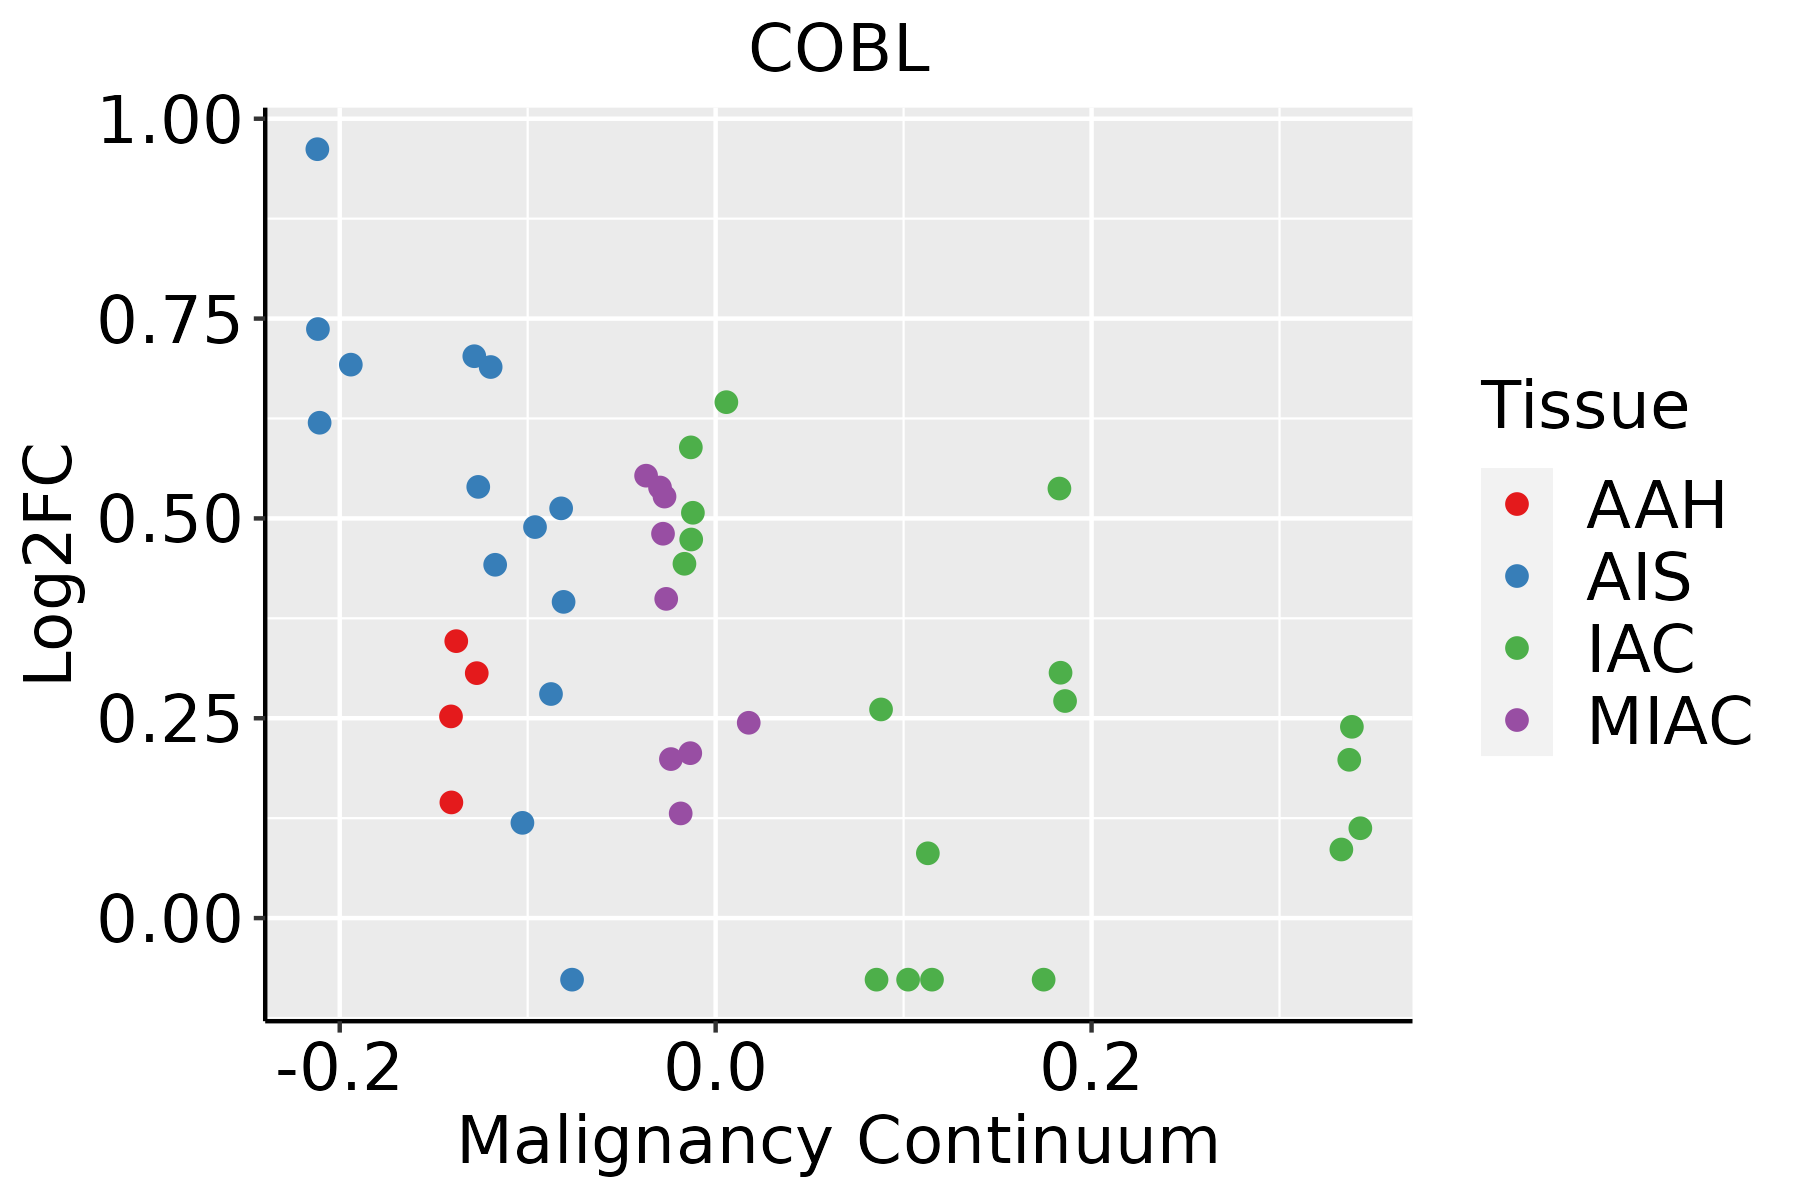
AAH: Atypical adenomatous hyperplasia
AIS: Adenocarcinoma in situ
IAC: Invasive lung adenocarcinoma
MIA: Minimally invasive adenocarcinoma
ThyroidThe image shows the transcriptomic changes along malignancy continuum.log2FC in expression of this searched gene in stem-like cells from each diseased tissue sample relative to stem-like cells in normal samples in each tissue plotted against the malignancy continuum. Samples are colored based on if they are from different disease stage.
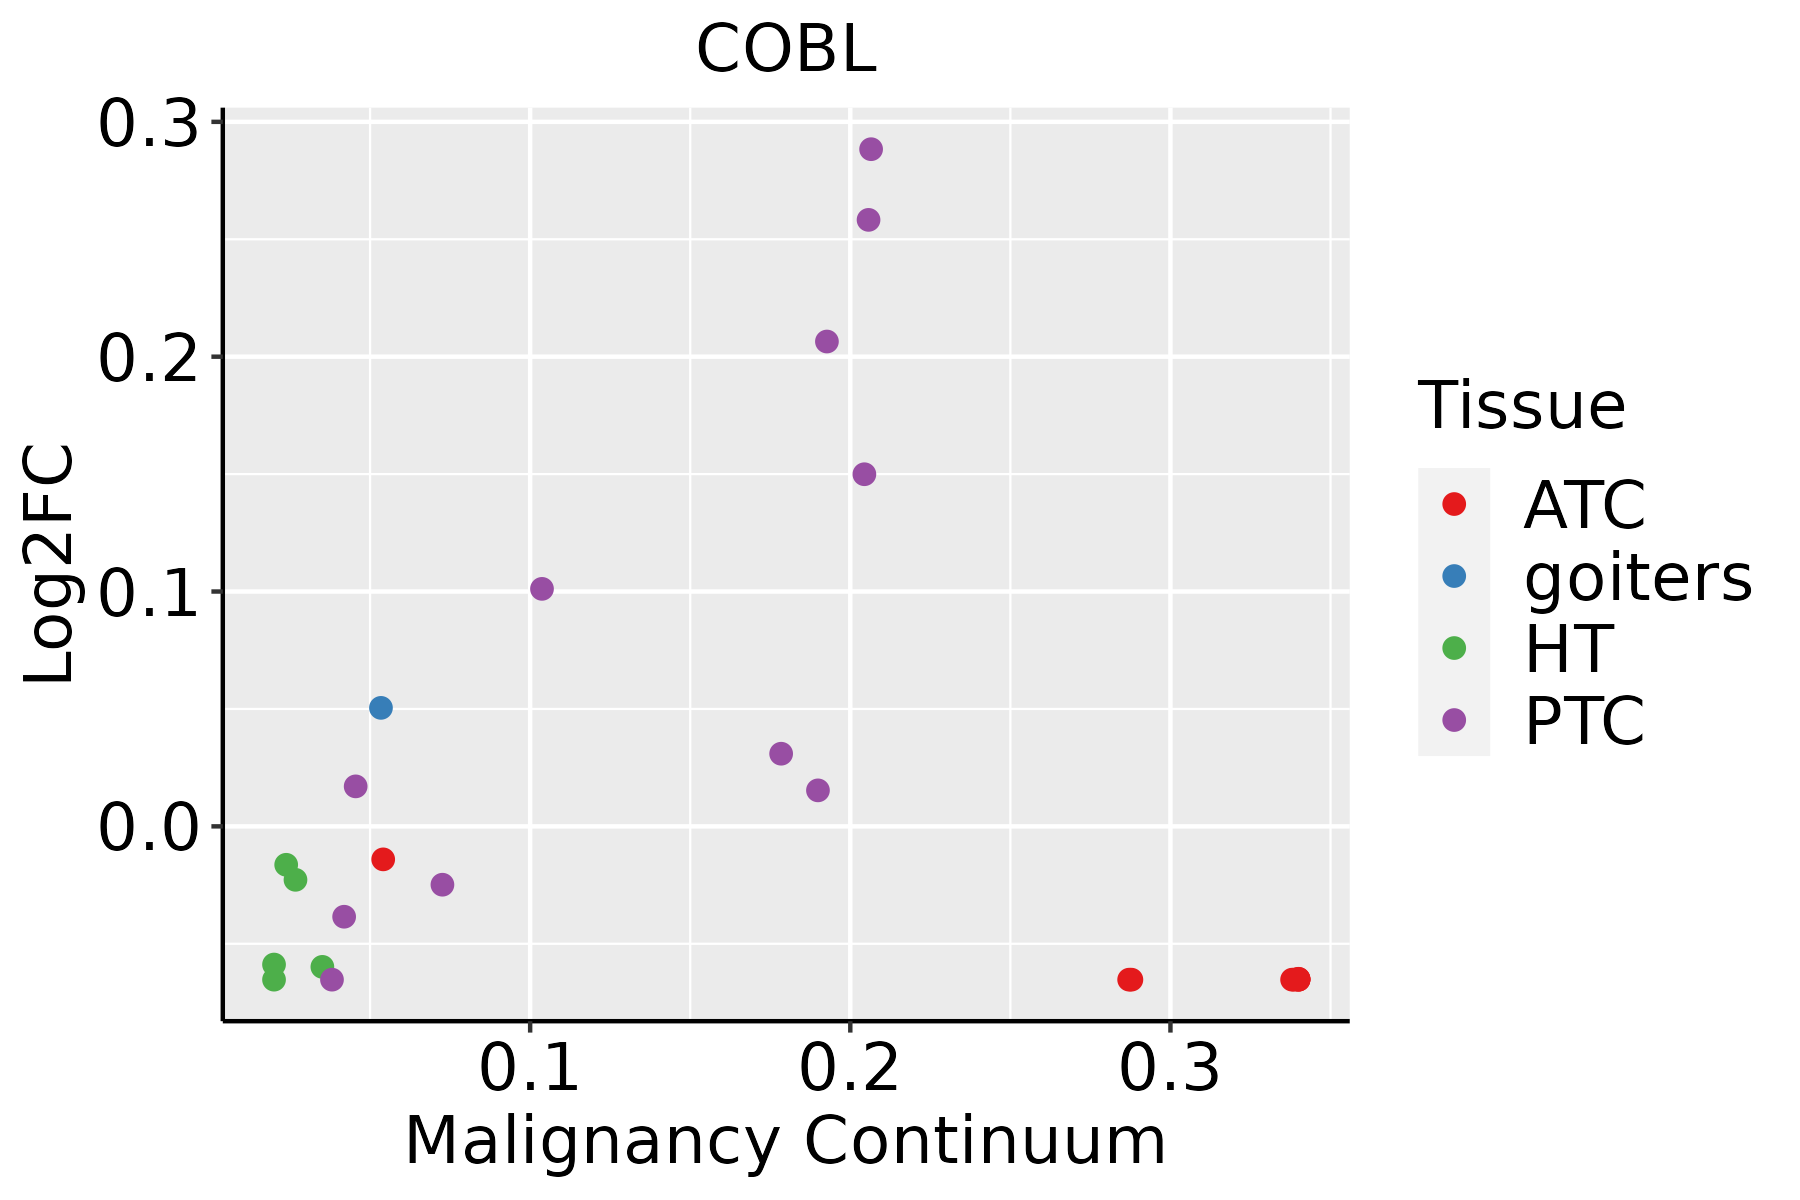
ATC: Anaplastic thyroid cancer
HT: Hashimoto's thyroiditis
PTC: Papillary thyroid cancer
∗log2FC in expression of this searched gene in stem-like cells from each diseased tissue sample relative to stem-like cells in normal samples in each tissue plotted against the malignancy continuum. Samples are colored based on if they are from different disease stage.

Top

Malignant transformation related pathway analysis

check buttonFind out the enriched GO biological processes and KEGG pathways involved in transition from healthy to precancer to cancer
check button Figure of enriched GO biological processes.
TissueDisease StageEnriched GO biological Processes
ColorectumADGO analysis - Figure of enriched GO biological processes: Top 15 enriched GO BP terms are showed in the bar plot of each disease state in each tissue. Each row represents a significant GO biological process which is colored according to the -log10(p.adjust).
ColorectumSERGO analysis - Figure of enriched GO biological processes: Top 15 enriched GO BP terms are showed in the bar plot of each disease state in each tissue. Each row represents a significant GO biological process which is colored according to the -log10(p.adjust).
ColorectumMSSGO analysis - Figure of enriched GO biological processes: Top 15 enriched GO BP terms are showed in the bar plot of each disease state in each tissue. Each row represents a significant GO biological process which is colored according to the -log10(p.adjust).
ColorectumMSI-HGO analysis - Figure of enriched GO biological processes: Top 15 enriched GO BP terms are showed in the bar plot of each disease state in each tissue. Each row represents a significant GO biological process which is colored according to the -log10(p.adjust).
ColorectumFAPGO analysis - Figure of enriched GO biological processes: Top 15 enriched GO BP terms are showed in the bar plot of each disease state in each tissue. Each row represents a significant GO biological process which is colored according to the -log10(p.adjust).
∗Top 15 enriched GO BP terms are showed in the bar plot of each disease state in each tissue. Each row represents a significant GO biological process which is colored according to the -log10(p.adjust).
Page: 1 2 3 4 5 6 7 8 9 

check button Enriched GO biological processes.
GO IDTissueDisease StageDescriptionGene RatioBg Ratiopvaluep.adjustCount
GO:0007015ColorectumADactin filament organization167/3918442/187231.65e-167.94e-14167
GO:0008154ColorectumADactin polymerization or depolymerization90/3918218/187236.14e-128.23e-1090
GO:0030041ColorectumADactin filament polymerization81/3918191/187231.35e-111.69e-0981
GO:0051258ColorectumADprotein polymerization112/3918297/187231.85e-112.27e-09112
GO:0048732ColorectumADgland development149/3918436/187236.07e-116.33e-09149
GO:0016049ColorectumADcell growth143/3918482/187232.83e-068.09e-05143
GO:0061008ColorectumADhepaticobiliary system development55/3918150/187236.34e-061.59e-0455
GO:0001889ColorectumADliver development54/3918147/187237.20e-061.77e-0454
GO:0010975ColorectumADregulation of neuron projection development129/3918445/187232.88e-055.37e-04129
GO:0007409ColorectumADaxonogenesis122/3918418/187233.36e-056.15e-04122
GO:0031346ColorectumADpositive regulation of cell projection organization104/3918353/187238.26e-051.30e-03104
GO:0061564ColorectumADaxon development132/3918467/187238.40e-051.31e-03132
GO:0060562ColorectumADepithelial tube morphogenesis93/3918325/187235.65e-046.00e-0393
GO:0014020ColorectumADprimary neural tube formation33/391894/187231.02e-039.50e-0333
GO:0001841ColorectumADneural tube formation35/3918102/187231.16e-031.05e-0235
GO:0001843ColorectumADneural tube closure30/391888/187232.83e-032.12e-0230
GO:0048588ColorectumADdevelopmental cell growth67/3918234/187233.03e-032.25e-0267
GO:0016358ColorectumADdendrite development69/3918243/187233.32e-032.42e-0269
GO:0060606ColorectumADtube closure30/391889/187233.42e-032.49e-0230
GO:0035148ColorectumADtube formation45/3918148/187234.13e-032.87e-0245
Page: 1 2 3 4 5 6 7 8 9 10 11 12 13 14 15 16 17 18 19 

check button Enriched KEGG pathways.
Pathway IDTissueDisease StageDescriptionGene RatioBg Ratiopvaluep.adjustqvalueCount
Page: 1 

Top

Cell-cell communication analysis

check buttonIdentification of potential cell-cell interactions between two cell types and their ligand-receptor pairs for different disease states
LigandReceptorLRpairPathwayTissueDisease Stage
Page: 1 

Top

Single-cell gene regulatory network inference analysis

check buttonFind out the significant the regulons (TFs) and the target genes of each regulon across cell types for different disease states
TFCell TypeTissueDisease StageTarget GeneRSSRegulon Activity
∗The dot plots of a searched regulon are shown for all cell subpopulations in each disease state of each tissue based on the regulon specific score inferred using pySCENIC and by calculating the average expression.
Page: 1 

Top

Somatic mutation of malignant transformation related genes

check buttonAnnotation of somatic variants for genes involved in malignant transformation
Hugo SymbolVariant ClassVariant ClassificationdbSNP RSHGVScHGVSpHGVSp ShortSWISSPROTBIOTYPESIFTPolyPhenTumor Sample BarcodeTissueHistologySexAgeStageTherapy TypesDrugsOutcome
COBLSNVMissense_Mutationc.3280N>Cp.Val1094Leup.V1094LO75128protein_codingtolerated(0.31)benign(0)TCGA-AN-A0XN-01Breastbreast invasive carcinomaFemale>=65III/IVUnknownUnknownSD
COBLSNVMissense_Mutationnovelc.3233C>Tp.Pro1078Leup.P1078LO75128protein_codingtolerated(0.32)benign(0.003)TCGA-AR-A2LR-01Breastbreast invasive carcinomaFemale<65I/IIChemotherapyadriamycinSD
COBLSNVMissense_Mutationc.271G>Ap.Glu91Lysp.E91KO75128protein_codingdeleterious(0.01)possibly_damaging(0.721)TCGA-D8-A1J8-01Breastbreast invasive carcinomaFemale>=65I/IIHormone TherapynolvadexSD
COBLinsertionFrame_Shift_Insnovelc.1912_1913insAACTACTCAGGGGACTGAGGTGGGAAGATp.Pro638GlnfsTer54p.P638Qfs*54O75128protein_codingTCGA-A2-A0CP-01Breastbreast invasive carcinomaFemale<65I/IIChemotherapycytoxanSD
COBLinsertionIn_Frame_Insnovelc.1040_1041insGGTTCATTTTCTTTTTAAATCATTCAGCATTTGTTATTTCACTTACGTp.Ser347delinsArgValHisPheLeuPheLysSerPheSerIleCysTyrPheThrTyrValp.S347delinsRVHFLFKSFSICYFTYVO75128protein_codingTCGA-A2-A0CP-01Breastbreast invasive carcinomaFemale<65I/IIChemotherapycytoxanSD
COBLinsertionFrame_Shift_Insnovelc.3405_3406insTTTGTATTTTTAGTAGAGACAGGp.Glu1136PhefsTer43p.E1136Ffs*43O75128protein_codingTCGA-A8-A08H-01Breastbreast invasive carcinomaFemale>=65I/IIUnknownUnknownSD
COBLinsertionFrame_Shift_Insnovelc.3746_3747insCTCGTACATGCTTGCATTCCAGCCTAATGTTGGACAGTTACGGAATp.Gln1249HisfsTer64p.Q1249Hfs*64O75128protein_codingTCGA-A8-A090-01Breastbreast invasive carcinomaFemale>=65I/IIUnknownUnknownSD
COBLinsertionNonsense_Mutationnovelc.2686_2687insGATATTTGTACTGAp.Met896ArgfsTer5p.M896Rfs*5O75128protein_codingTCGA-A8-A09K-01Breastbreast invasive carcinomaFemale>=65I/IIUnknownUnknownSD
COBLdeletionFrame_Shift_Delc.130delNp.Ala44ProfsTer11p.A44Pfs*11O75128protein_codingTCGA-AN-A0AK-01Breastbreast invasive carcinomaFemale>=65I/IIUnknownUnknownSD
COBLinsertionFrame_Shift_Insnovelc.2195_2196insGCCCATTGGGAAAGTCAGAGAGTTCTGGAGGTGCAACTCTGp.Asp732GlufsTer80p.D732Efs*80O75128protein_codingTCGA-AN-A0G0-01Breastbreast invasive carcinomaFemale<65I/IIUnknownUnknownSD
Page: 1 2 3 4 5 6 7 8 9 10 11 12 13 14 15 16 17 18 19 

Top

Related drugs of malignant transformation related genes

check buttonIdentification of chemicals and drugs interact with genes involved in malignant transfromation
(DGIdb 4.0)
Entrez IDSymbolCategoryInteraction TypesDrug Claim NameDrug NamePMIDs
Page: 1