| Tissue | Expression Dynamics | Abbreviation |
| Esophagus |  | ESCC: Esophageal squamous cell carcinoma |
| HGIN: High-grade intraepithelial neoplasias |
| LGIN: Low-grade intraepithelial neoplasias |
| Liver | 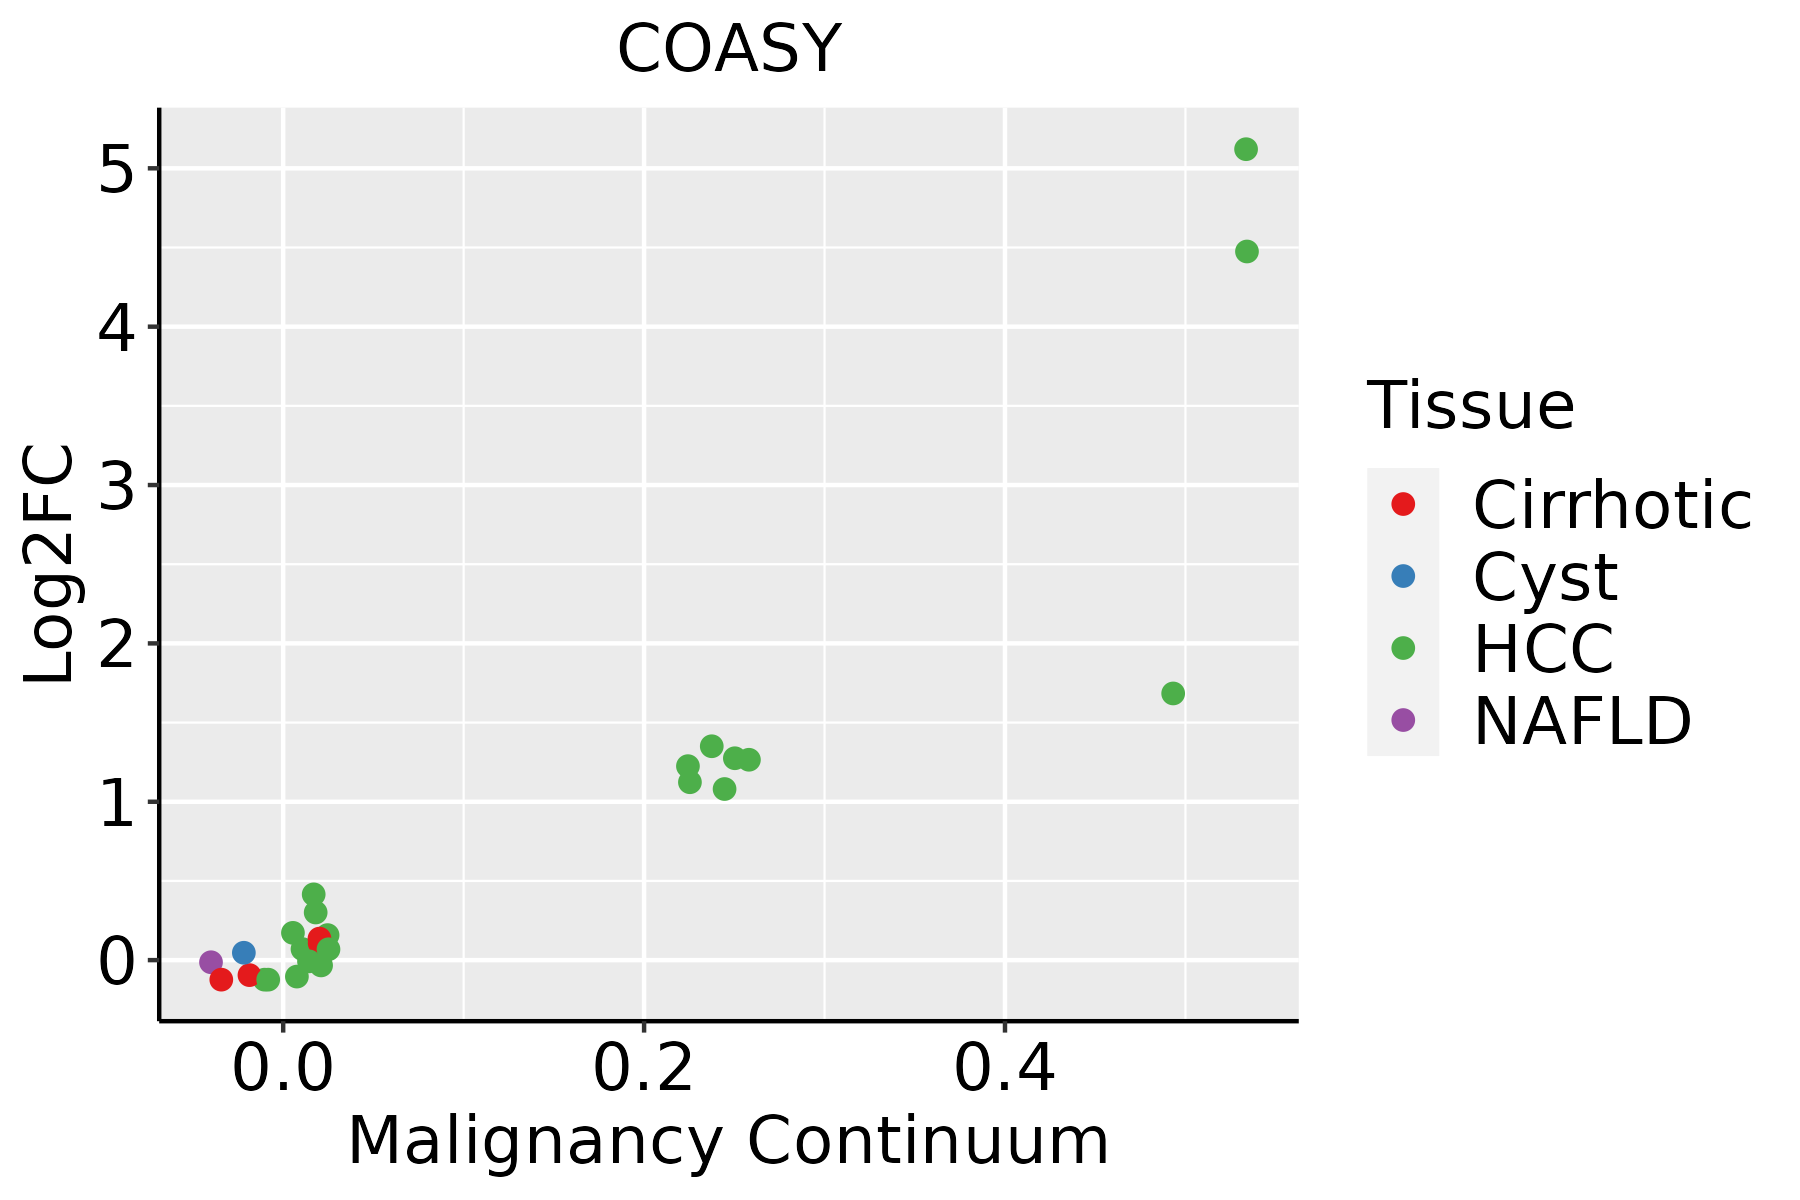 | HCC: Hepatocellular carcinoma |
| NAFLD: Non-alcoholic fatty liver disease |
| Oral Cavity | 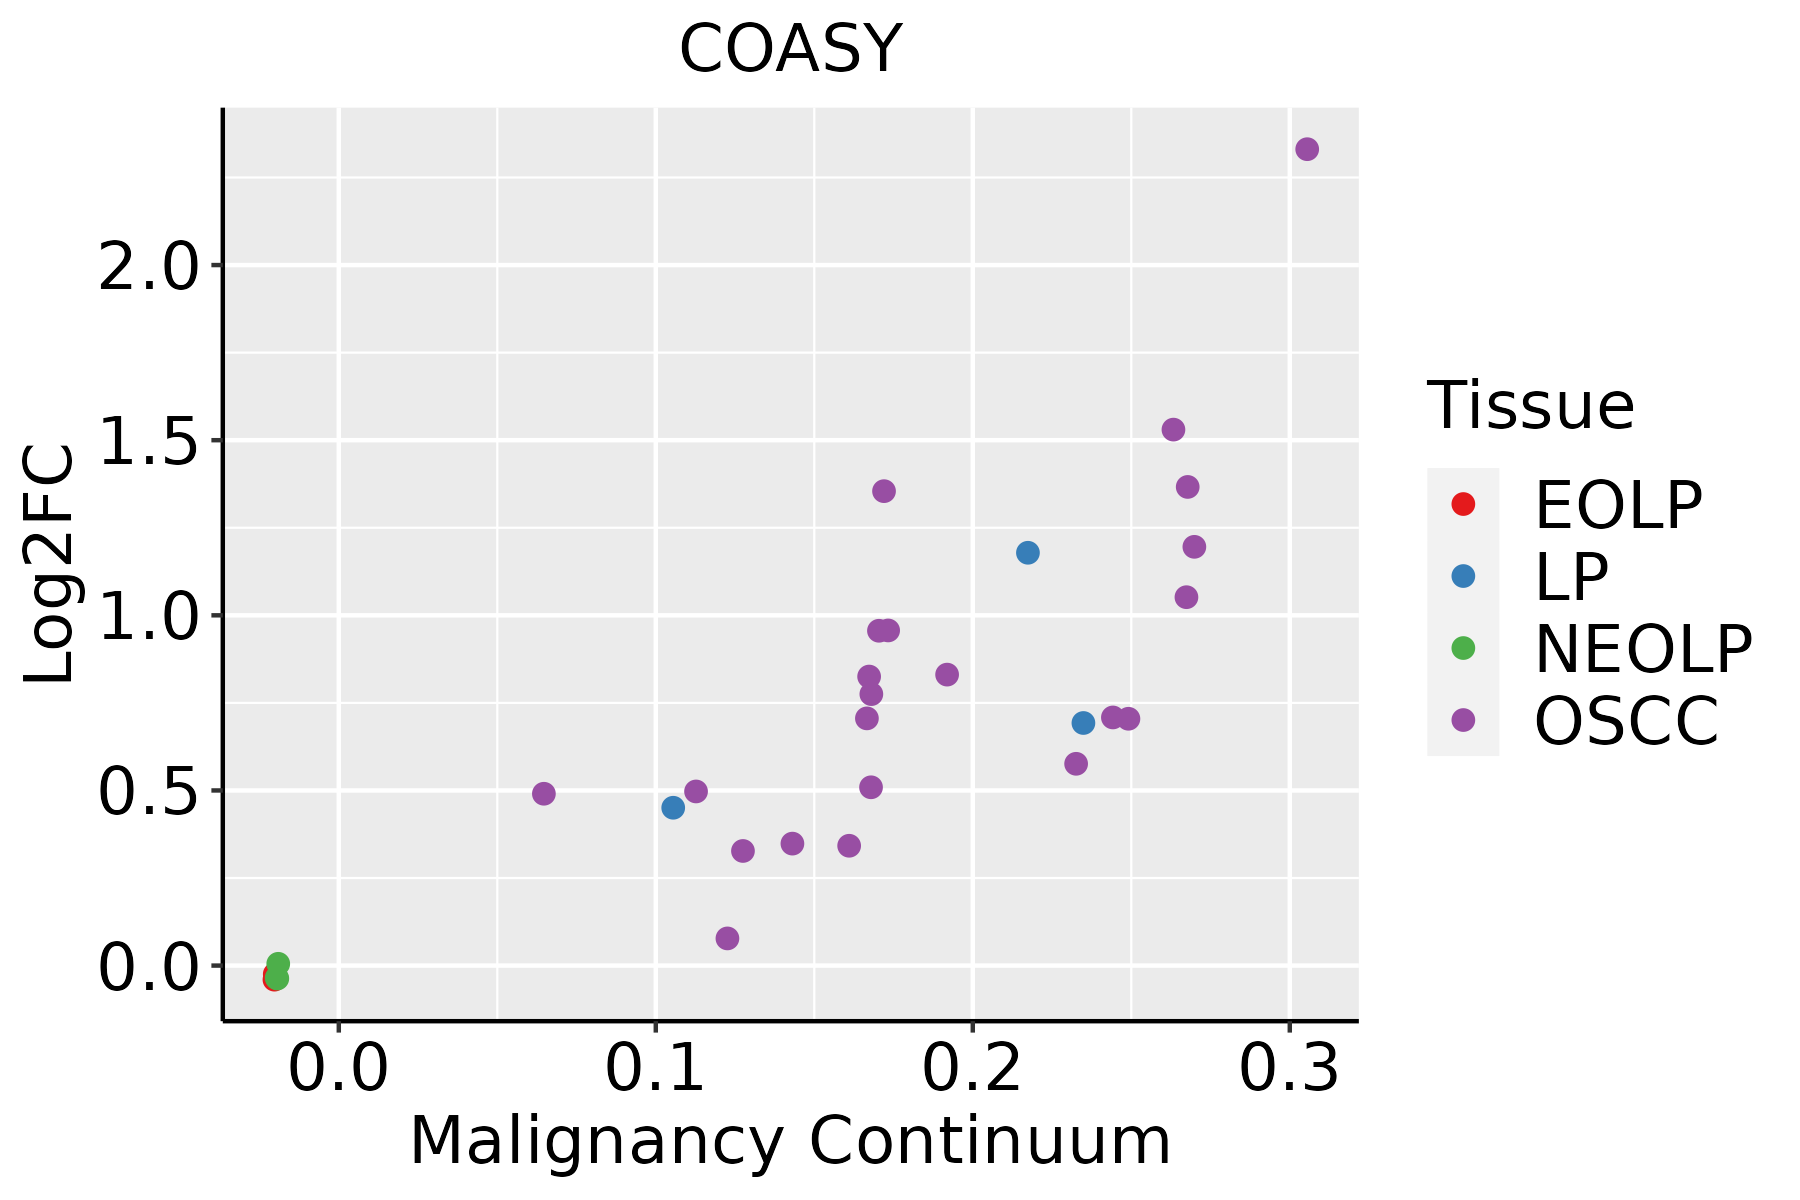 | EOLP: Erosive Oral lichen planus |
| LP: leukoplakia |
| NEOLP: Non-erosive oral lichen planus |
| OSCC: Oral squamous cell carcinoma |
| Skin | 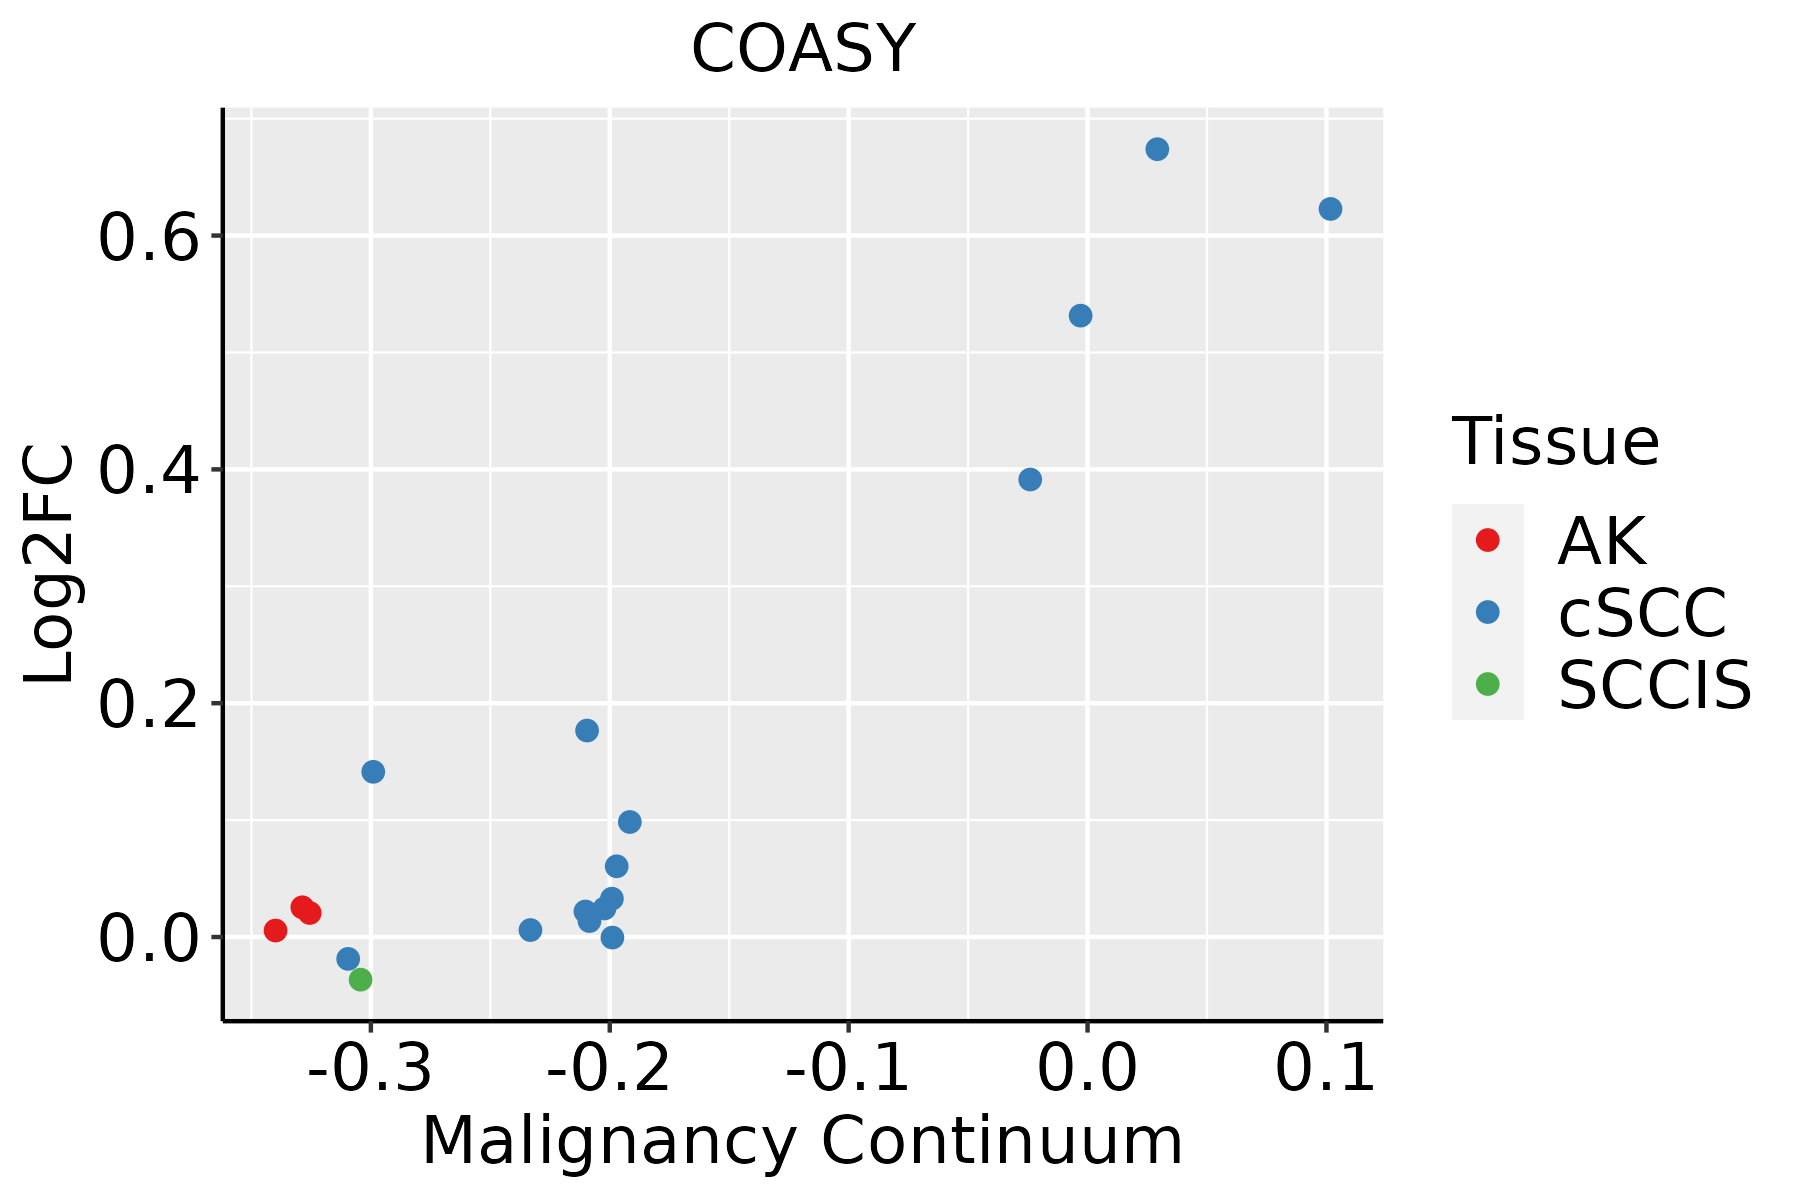 | AK: Actinic keratosis |
| cSCC: Cutaneous squamous cell carcinoma |
| SCCIS:squamous cell carcinoma in situ |
| Thyroid |  | ATC: Anaplastic thyroid cancer |
| HT: Hashimoto's thyroiditis |
| PTC: Papillary thyroid cancer |
| GO ID | Tissue | Disease Stage | Description | Gene Ratio | Bg Ratio | pvalue | p.adjust | Count |
| GO:0006753110 | Esophagus | ESCC | nucleoside phosphate metabolic process | 288/8552 | 497/18723 | 1.80e-08 | 3.50e-07 | 288 |
| GO:0019693111 | Esophagus | ESCC | ribose phosphate metabolic process | 234/8552 | 396/18723 | 4.24e-08 | 7.76e-07 | 234 |
| GO:0009117111 | Esophagus | ESCC | nucleotide metabolic process | 282/8552 | 489/18723 | 4.70e-08 | 8.50e-07 | 282 |
| GO:0009259111 | Esophagus | ESCC | ribonucleotide metabolic process | 224/8552 | 385/18723 | 4.41e-07 | 6.00e-06 | 224 |
| GO:0072521111 | Esophagus | ESCC | purine-containing compound metabolic process | 238/8552 | 416/18723 | 1.20e-06 | 1.49e-05 | 238 |
| GO:0009150111 | Esophagus | ESCC | purine ribonucleotide metabolic process | 213/8552 | 368/18723 | 1.40e-06 | 1.69e-05 | 213 |
| GO:0046390110 | Esophagus | ESCC | ribose phosphate biosynthetic process | 119/8552 | 190/18723 | 1.73e-06 | 2.06e-05 | 119 |
| GO:0006163111 | Esophagus | ESCC | purine nucleotide metabolic process | 226/8552 | 396/18723 | 2.81e-06 | 3.21e-05 | 226 |
| GO:000916516 | Esophagus | ESCC | nucleotide biosynthetic process | 150/8552 | 254/18723 | 1.12e-05 | 1.06e-04 | 150 |
| GO:0009260110 | Esophagus | ESCC | ribonucleotide biosynthetic process | 112/8552 | 182/18723 | 1.12e-05 | 1.06e-04 | 112 |
| GO:190129316 | Esophagus | ESCC | nucleoside phosphate biosynthetic process | 151/8552 | 256/18723 | 1.15e-05 | 1.08e-04 | 151 |
| GO:00338664 | Esophagus | ESCC | nucleoside bisphosphate biosynthetic process | 44/8552 | 60/18723 | 1.25e-05 | 1.15e-04 | 44 |
| GO:00340304 | Esophagus | ESCC | ribonucleoside bisphosphate biosynthetic process | 44/8552 | 60/18723 | 1.25e-05 | 1.15e-04 | 44 |
| GO:00340334 | Esophagus | ESCC | purine nucleoside bisphosphate biosynthetic process | 44/8552 | 60/18723 | 1.25e-05 | 1.15e-04 | 44 |
| GO:007252217 | Esophagus | ESCC | purine-containing compound biosynthetic process | 120/8552 | 200/18723 | 3.02e-05 | 2.51e-04 | 120 |
| GO:0009152110 | Esophagus | ESCC | purine ribonucleotide biosynthetic process | 103/8552 | 169/18723 | 4.40e-05 | 3.51e-04 | 103 |
| GO:000616417 | Esophagus | ESCC | purine nucleotide biosynthetic process | 113/8552 | 191/18723 | 1.16e-04 | 8.04e-04 | 113 |
| GO:00338655 | Esophagus | ESCC | nucleoside bisphosphate metabolic process | 77/8552 | 128/18723 | 6.71e-04 | 3.55e-03 | 77 |
| GO:00338755 | Esophagus | ESCC | ribonucleoside bisphosphate metabolic process | 77/8552 | 128/18723 | 6.71e-04 | 3.55e-03 | 77 |
| GO:00340325 | Esophagus | ESCC | purine nucleoside bisphosphate metabolic process | 77/8552 | 128/18723 | 6.71e-04 | 3.55e-03 | 77 |
| Pathway ID | Tissue | Disease Stage | Description | Gene Ratio | Bg Ratio | pvalue | p.adjust | qvalue | Count |
| hsa012405 | Esophagus | ESCC | Biosynthesis of cofactors | 97/4205 | 153/8465 | 3.88e-04 | 1.35e-03 | 6.94e-04 | 97 |
| hsa0124012 | Esophagus | ESCC | Biosynthesis of cofactors | 97/4205 | 153/8465 | 3.88e-04 | 1.35e-03 | 6.94e-04 | 97 |
| hsa01240 | Liver | Cirrhotic | Biosynthesis of cofactors | 66/2530 | 153/8465 | 3.11e-04 | 1.99e-03 | 1.23e-03 | 66 |
| hsa012401 | Liver | Cirrhotic | Biosynthesis of cofactors | 66/2530 | 153/8465 | 3.11e-04 | 1.99e-03 | 1.23e-03 | 66 |
| hsa012402 | Liver | HCC | Biosynthesis of cofactors | 103/4020 | 153/8465 | 4.67e-07 | 5.05e-06 | 2.81e-06 | 103 |
| hsa007702 | Liver | HCC | Pantothenate and CoA biosynthesis | 16/4020 | 21/8465 | 7.16e-03 | 1.97e-02 | 1.09e-02 | 16 |
| hsa012403 | Liver | HCC | Biosynthesis of cofactors | 103/4020 | 153/8465 | 4.67e-07 | 5.05e-06 | 2.81e-06 | 103 |
| hsa007703 | Liver | HCC | Pantothenate and CoA biosynthesis | 16/4020 | 21/8465 | 7.16e-03 | 1.97e-02 | 1.09e-02 | 16 |
| hsa012404 | Oral cavity | OSCC | Biosynthesis of cofactors | 88/3704 | 153/8465 | 3.84e-04 | 1.20e-03 | 6.12e-04 | 88 |
| hsa0124011 | Oral cavity | OSCC | Biosynthesis of cofactors | 88/3704 | 153/8465 | 3.84e-04 | 1.20e-03 | 6.12e-04 | 88 |
| hsa0124021 | Oral cavity | LP | Biosynthesis of cofactors | 57/2418 | 153/8465 | 1.17e-02 | 3.91e-02 | 2.52e-02 | 57 |
| hsa0124031 | Oral cavity | LP | Biosynthesis of cofactors | 57/2418 | 153/8465 | 1.17e-02 | 3.91e-02 | 2.52e-02 | 57 |
| Hugo Symbol | Variant Class | Variant Classification | dbSNP RS | HGVSc | HGVSp | HGVSp Short | SWISSPROT | BIOTYPE | SIFT | PolyPhen | Tumor Sample Barcode | Tissue | Histology | Sex | Age | Stage | Therapy Types | Drugs | Outcome |
| COASY | SNV | Missense_Mutation | rs781118243 | c.616N>C | p.Ala206Pro | p.A206P | Q13057 | protein_coding | tolerated(0.16) | benign(0.005) | TCGA-BH-A0BZ-01 | Breast | breast invasive carcinoma | Female | <65 | III/IV | Chemotherapy | doxorubicin | CR |
| COASY | SNV | Missense_Mutation | | c.418N>A | p.Pro140Thr | p.P140T | Q13057 | protein_coding | tolerated(0.18) | probably_damaging(0.982) | TCGA-D8-A1JM-01 | Breast | breast invasive carcinoma | Female | <65 | I/II | ChemotherapyHormone Therapy | doxorubicine | SD |
| COASY | SNV | Missense_Mutation | novel | c.638C>T | p.Pro213Leu | p.P213L | Q13057 | protein_coding | tolerated(0.12) | benign(0.058) | TCGA-D8-A4Z1-01 | Breast | breast invasive carcinoma | Female | >=65 | I/II | Hormone Therapy | tamoxiphen | SD |
| COASY | deletion | In_Frame_Del | | c.512_514delNNN | p.Cys173del | p.C173del | Q13057 | protein_coding | | | TCGA-E2-A1L6-01 | Breast | breast invasive carcinoma | Female | <65 | I/II | Chemotherapy | cyclophosphamide | SD |
| COASY | SNV | Missense_Mutation | rs755520740 | c.964N>T | p.Arg322Cys | p.R322C | Q13057 | protein_coding | deleterious(0) | probably_damaging(0.975) | TCGA-2W-A8YY-01 | Cervix | cervical & endocervical cancer | Female | <65 | I/II | Chemotherapy | cisplatin | CR |
| COASY | SNV | Missense_Mutation | | c.148N>G | p.Arg50Gly | p.R50G | Q13057 | protein_coding | deleterious(0.02) | probably_damaging(0.969) | TCGA-C5-A1BL-01 | Cervix | cervical & endocervical cancer | Female | <65 | I/II | Unknown | Unknown | SD |
| COASY | SNV | Missense_Mutation | novel | c.20G>C | p.Arg7Thr | p.R7T | Q13057 | protein_coding | tolerated_low_confidence(0.08) | benign(0) | TCGA-VS-A9UH-01 | Cervix | cervical & endocervical cancer | Female | <65 | I/II | Chemotherapy | cisplatin | CR |
| COASY | SNV | Missense_Mutation | novel | c.554N>G | p.Tyr185Cys | p.Y185C | Q13057 | protein_coding | tolerated(0.07) | possibly_damaging(0.794) | TCGA-CA-6717-01 | Colorectum | colon adenocarcinoma | Male | <65 | I/II | Chemotherapy | oxaliplatin | CR |
| COASY | SNV | Missense_Mutation | | c.1112G>A | p.Gly371Glu | p.G371E | Q13057 | protein_coding | deleterious(0) | probably_damaging(1) | TCGA-D5-6930-01 | Colorectum | colon adenocarcinoma | Male | >=65 | I/II | Unknown | Unknown | SD |
| COASY | SNV | Missense_Mutation | | c.1048C>A | p.Leu350Ile | p.L350I | Q13057 | protein_coding | tolerated(0.18) | benign(0.044) | TCGA-G4-6588-01 | Colorectum | colon adenocarcinoma | Female | <65 | I/II | Unknown | Unknown | SD |


