
|
|||||
|
 | |
| |
| |
| |
| |
| |
|
Gene: COA8 |
Gene summary for COA8 |
| Gene information | Species | Human | Gene symbol | COA8 | Gene ID | 84334 |
| Gene name | cytochrome c oxidase assembly factor 8 | |
| Gene Alias | APOP | |
| Cytomap | 14q32.33 | |
| Gene Type | protein-coding | GO ID | GO:0000302 | UniProtAcc | Q96IL0 |
Top |
Malignant transformation analysis |
| Identification of the aberrant gene expression in precancerous and cancerous lesions by comparing the gene expression of stem-like cells in diseased tissues with normal stem cells |
| Entrez ID | Symbol | Replicates | Species | Organ | Tissue | Adj P-value | Log2FC | Malignancy |
| 84334 | COA8 | LZE2T | Human | Esophagus | ESCC | 3.94e-07 | 6.52e-01 | 0.082 |
| 84334 | COA8 | LZE4T | Human | Esophagus | ESCC | 4.82e-28 | 6.81e-01 | 0.0811 |
| 84334 | COA8 | LZE5T | Human | Esophagus | ESCC | 6.95e-12 | 6.52e-01 | 0.0514 |
| 84334 | COA8 | LZE7T | Human | Esophagus | ESCC | 1.56e-14 | 5.06e-01 | 0.0667 |
| 84334 | COA8 | LZE8T | Human | Esophagus | ESCC | 2.41e-13 | 4.06e-01 | 0.067 |
| 84334 | COA8 | LZE20T | Human | Esophagus | ESCC | 6.74e-27 | 7.49e-01 | 0.0662 |
| 84334 | COA8 | LZE22D1 | Human | Esophagus | HGIN | 2.88e-06 | 3.09e-01 | 0.0595 |
| 84334 | COA8 | LZE22T | Human | Esophagus | ESCC | 2.25e-16 | 7.98e-01 | 0.068 |
| 84334 | COA8 | LZE24T | Human | Esophagus | ESCC | 9.18e-36 | 7.32e-01 | 0.0596 |
| 84334 | COA8 | LZE22D3 | Human | Esophagus | HGIN | 1.73e-02 | 4.41e-01 | 0.0653 |
| 84334 | COA8 | LZE21T | Human | Esophagus | ESCC | 1.97e-09 | 4.69e-01 | 0.0655 |
| 84334 | COA8 | LZE6T | Human | Esophagus | ESCC | 4.61e-14 | 5.67e-01 | 0.0845 |
| Page: 1 |
| Tissue | Expression Dynamics | Abbreviation |
| Esophagus | 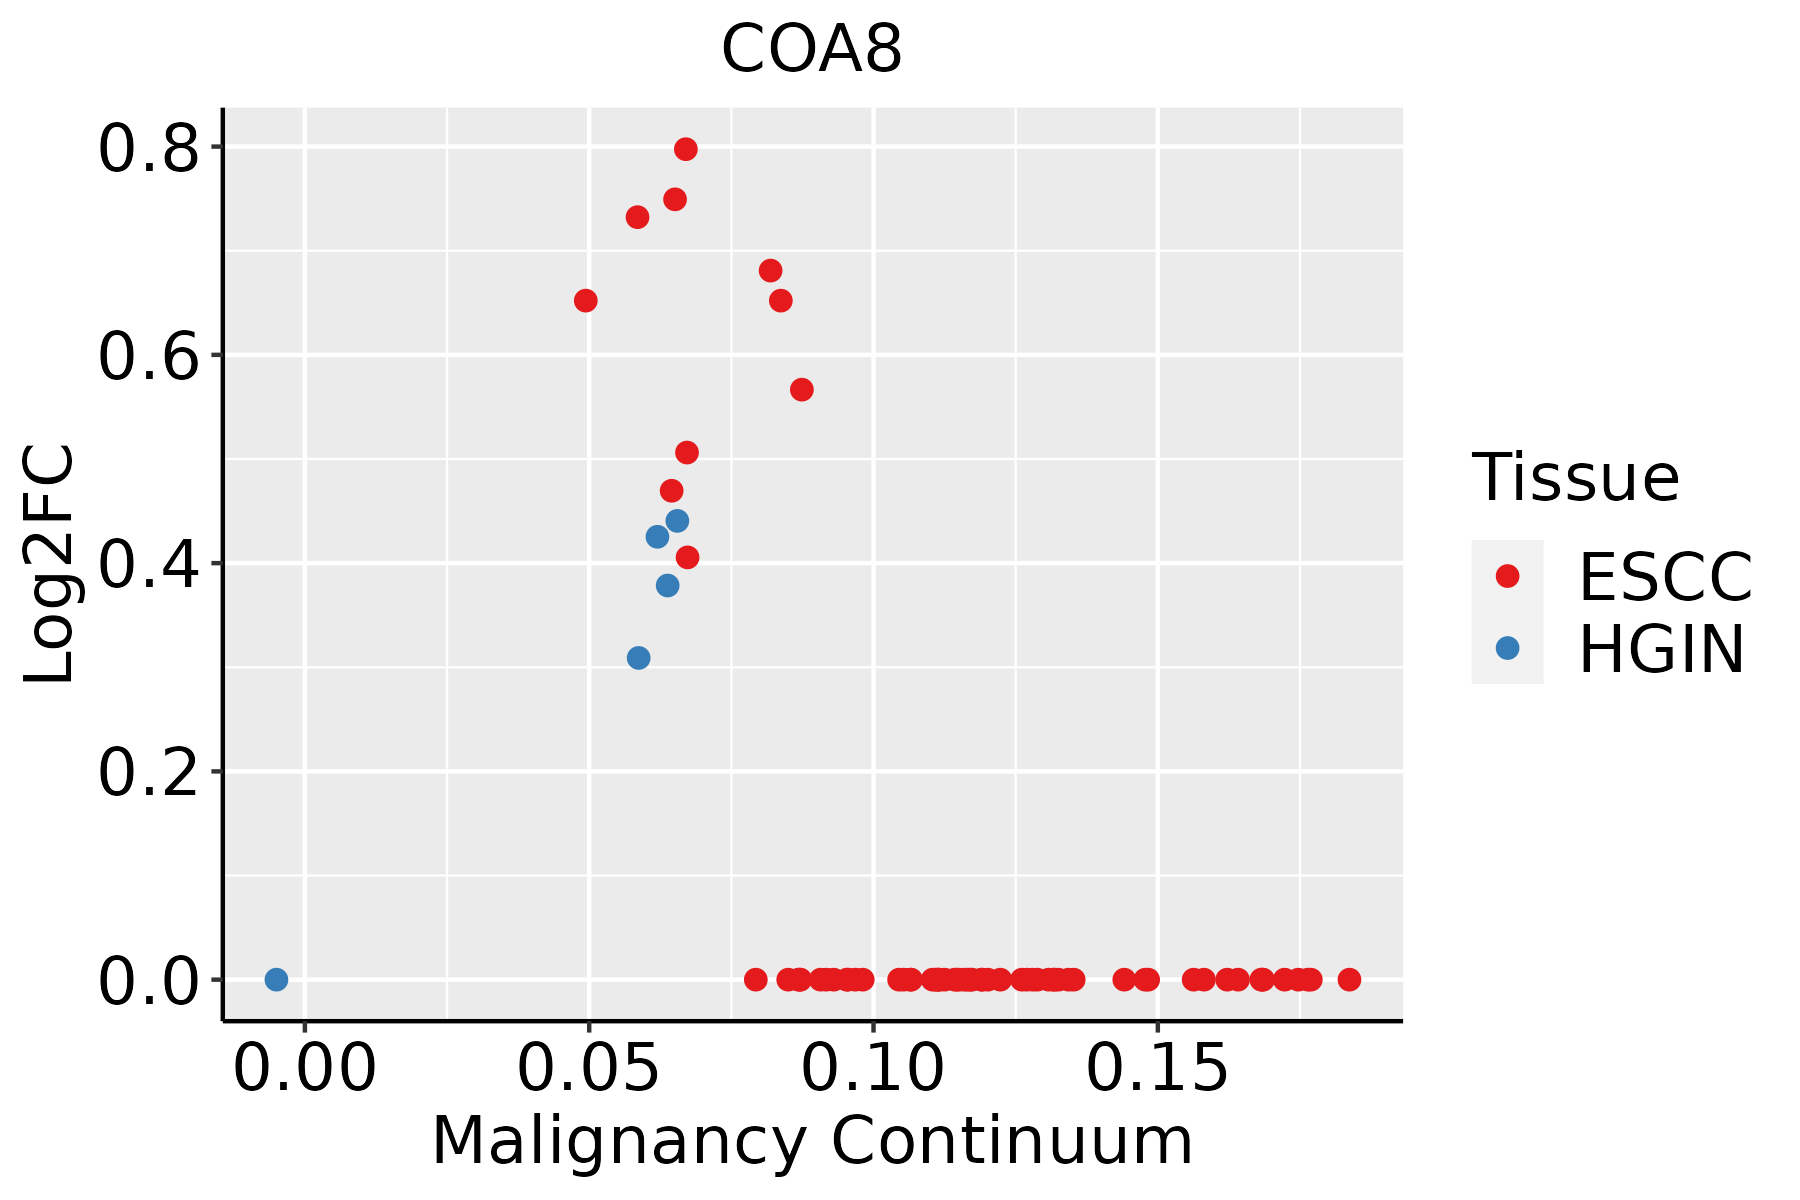 | ESCC: Esophageal squamous cell carcinoma |
| HGIN: High-grade intraepithelial neoplasias | ||
| LGIN: Low-grade intraepithelial neoplasias |
| ∗log2FC in expression of this searched gene in stem-like cells from each diseased tissue sample relative to stem-like cells in normal samples in each tissue plotted against the malignancy continuum. Samples are colored based on if they are from different disease stage. |
Top |
Malignant transformation related pathway analysis |
| Find out the enriched GO biological processes and KEGG pathways involved in transition from healthy to precancer to cancer |
| Tissue | Disease Stage | Enriched GO biological Processes |
| Colorectum | AD |  |
| Colorectum | SER |  |
| Colorectum | MSS |  |
| Colorectum | MSI-H |  |
| Colorectum | FAP |  |
| ∗Top 15 enriched GO BP terms are showed in the bar plot of each disease state in each tissue. Each row represents a significant GO biological process which is colored according to the -log10(p.adjust). |
| Page: 1 2 3 4 5 6 7 8 9 |
| GO ID | Tissue | Disease Stage | Description | Gene Ratio | Bg Ratio | pvalue | p.adjust | Count |
| GO:000609120 | Esophagus | HGIN | generation of precursor metabolites and energy | 145/2587 | 490/18723 | 3.41e-20 | 2.04e-17 | 145 |
| GO:003310820 | Esophagus | HGIN | mitochondrial respiratory chain complex assembly | 47/2587 | 93/18723 | 3.15e-17 | 8.60e-15 | 47 |
| GO:003164727 | Esophagus | HGIN | regulation of protein stability | 96/2587 | 298/18723 | 2.21e-16 | 5.76e-14 | 96 |
| GO:009719327 | Esophagus | HGIN | intrinsic apoptotic signaling pathway | 90/2587 | 288/18723 | 1.50e-14 | 2.80e-12 | 90 |
| GO:005082127 | Esophagus | HGIN | protein stabilization | 64/2587 | 191/18723 | 3.11e-12 | 4.24e-10 | 64 |
| GO:000697927 | Esophagus | HGIN | response to oxidative stress | 107/2587 | 446/18723 | 3.91e-09 | 2.76e-07 | 107 |
| GO:00170044 | Esophagus | HGIN | cytochrome complex assembly | 18/2587 | 36/18723 | 2.39e-07 | 1.14e-05 | 18 |
| GO:00336173 | Esophagus | HGIN | mitochondrial cytochrome c oxidase assembly | 13/2587 | 22/18723 | 9.51e-07 | 3.80e-05 | 13 |
| GO:00085353 | Esophagus | HGIN | respiratory chain complex IV assembly | 14/2587 | 26/18723 | 1.68e-06 | 6.29e-05 | 14 |
| GO:190260017 | Esophagus | HGIN | proton transmembrane transport | 43/2587 | 157/18723 | 5.51e-06 | 1.75e-04 | 43 |
| GO:000030226 | Esophagus | HGIN | response to reactive oxygen species | 52/2587 | 222/18723 | 7.30e-05 | 1.66e-03 | 52 |
| GO:004346718 | Esophagus | HGIN | regulation of generation of precursor metabolites and energy | 34/2587 | 130/18723 | 1.37e-04 | 2.76e-03 | 34 |
| GO:00101557 | Esophagus | HGIN | regulation of proton transport | 10/2587 | 24/18723 | 7.66e-04 | 1.00e-02 | 10 |
| GO:0097193111 | Esophagus | ESCC | intrinsic apoptotic signaling pathway | 222/8552 | 288/18723 | 5.87e-28 | 2.02e-25 | 222 |
| GO:0031647111 | Esophagus | ESCC | regulation of protein stability | 223/8552 | 298/18723 | 5.76e-25 | 1.52e-22 | 223 |
| GO:0006091110 | Esophagus | ESCC | generation of precursor metabolites and energy | 331/8552 | 490/18723 | 3.86e-23 | 8.45e-21 | 331 |
| GO:0006979111 | Esophagus | ESCC | response to oxidative stress | 303/8552 | 446/18723 | 7.15e-22 | 1.30e-19 | 303 |
| GO:0033108110 | Esophagus | ESCC | mitochondrial respiratory chain complex assembly | 83/8552 | 93/18723 | 9.56e-19 | 1.05e-16 | 83 |
| GO:0050821111 | Esophagus | ESCC | protein stabilization | 140/8552 | 191/18723 | 6.50e-15 | 3.61e-13 | 140 |
| GO:0000302111 | Esophagus | ESCC | response to reactive oxygen species | 150/8552 | 222/18723 | 3.06e-11 | 1.02e-09 | 150 |
| Page: 1 2 |
| Pathway ID | Tissue | Disease Stage | Description | Gene Ratio | Bg Ratio | pvalue | p.adjust | qvalue | Count |
| Page: 1 |
Top |
Cell-cell communication analysis |
| Identification of potential cell-cell interactions between two cell types and their ligand-receptor pairs for different disease states |
| Ligand | Receptor | LRpair | Pathway | Tissue | Disease Stage |
| Page: 1 |
Top |
Single-cell gene regulatory network inference analysis |
| Find out the significant the regulons (TFs) and the target genes of each regulon across cell types for different disease states |
| TF | Cell Type | Tissue | Disease Stage | Target Gene | RSS | Regulon Activity |
| ∗The dot plots of a searched regulon are shown for all cell subpopulations in each disease state of each tissue based on the regulon specific score inferred using pySCENIC and by calculating the average expression. |
| Page: 1 |
Top |
Somatic mutation of malignant transformation related genes |
| Annotation of somatic variants for genes involved in malignant transformation |
| Hugo Symbol | Variant Class | Variant Classification | dbSNP RS | HGVSc | HGVSp | HGVSp Short | SWISSPROT | BIOTYPE | SIFT | PolyPhen | Tumor Sample Barcode | Tissue | Histology | Sex | Age | Stage | Therapy Types | Drugs | Outcome |
| Page: 1 |
Top |
Related drugs of malignant transformation related genes |
| Identification of chemicals and drugs interact with genes involved in malignant transfromation |
| (DGIdb 4.0) |
| Entrez ID | Symbol | Category | Interaction Types | Drug Claim Name | Drug Name | PMIDs |
| Page: 1 |

Copyright 2023-Present -The University of Texas Health Science Center at Houston |