
|
|||||
|
 | |
| |
| |
| |
| |
| |
|
Gene: COA7 |
Gene summary for COA7 |
| Gene information | Species | Human | Gene symbol | COA7 | Gene ID | 65260 |
| Gene name | cytochrome c oxidase assembly factor 7 | |
| Gene Alias | C1orf163 | |
| Cytomap | 1p32.3 | |
| Gene Type | protein-coding | GO ID | GO:0005575 | UniProtAcc | Q96BR5 |
Top |
Malignant transformation analysis |
| Identification of the aberrant gene expression in precancerous and cancerous lesions by comparing the gene expression of stem-like cells in diseased tissues with normal stem cells |
| Entrez ID | Symbol | Replicates | Species | Organ | Tissue | Adj P-value | Log2FC | Malignancy |
| 65260 | COA7 | LZE4T | Human | Esophagus | ESCC | 1.84e-02 | 1.01e-01 | 0.0811 |
| 65260 | COA7 | LZE24T | Human | Esophagus | ESCC | 1.10e-09 | 1.23e-01 | 0.0596 |
| 65260 | COA7 | P2T-E | Human | Esophagus | ESCC | 1.70e-16 | 3.05e-01 | 0.1177 |
| 65260 | COA7 | P4T-E | Human | Esophagus | ESCC | 1.81e-08 | 2.24e-01 | 0.1323 |
| 65260 | COA7 | P5T-E | Human | Esophagus | ESCC | 1.69e-13 | 2.70e-01 | 0.1327 |
| 65260 | COA7 | P8T-E | Human | Esophagus | ESCC | 2.53e-06 | 3.76e-02 | 0.0889 |
| 65260 | COA7 | P9T-E | Human | Esophagus | ESCC | 6.76e-07 | 1.08e-01 | 0.1131 |
| 65260 | COA7 | P10T-E | Human | Esophagus | ESCC | 4.26e-16 | 2.20e-01 | 0.116 |
| 65260 | COA7 | P11T-E | Human | Esophagus | ESCC | 1.93e-02 | 2.47e-01 | 0.1426 |
| 65260 | COA7 | P12T-E | Human | Esophagus | ESCC | 1.80e-09 | 2.49e-01 | 0.1122 |
| 65260 | COA7 | P15T-E | Human | Esophagus | ESCC | 9.25e-17 | 3.53e-01 | 0.1149 |
| 65260 | COA7 | P16T-E | Human | Esophagus | ESCC | 6.83e-09 | 1.02e-01 | 0.1153 |
| 65260 | COA7 | P17T-E | Human | Esophagus | ESCC | 2.14e-03 | 1.45e-01 | 0.1278 |
| 65260 | COA7 | P19T-E | Human | Esophagus | ESCC | 7.15e-03 | 3.44e-01 | 0.1662 |
| 65260 | COA7 | P20T-E | Human | Esophagus | ESCC | 5.19e-17 | 2.63e-01 | 0.1124 |
| 65260 | COA7 | P21T-E | Human | Esophagus | ESCC | 8.24e-15 | 3.86e-01 | 0.1617 |
| 65260 | COA7 | P22T-E | Human | Esophagus | ESCC | 5.77e-07 | 6.20e-02 | 0.1236 |
| 65260 | COA7 | P23T-E | Human | Esophagus | ESCC | 4.41e-16 | 4.53e-01 | 0.108 |
| 65260 | COA7 | P24T-E | Human | Esophagus | ESCC | 1.87e-07 | 1.96e-01 | 0.1287 |
| 65260 | COA7 | P26T-E | Human | Esophagus | ESCC | 6.13e-11 | 2.03e-01 | 0.1276 |
| Page: 1 2 3 4 |
| Tissue | Expression Dynamics | Abbreviation |
| Esophagus | 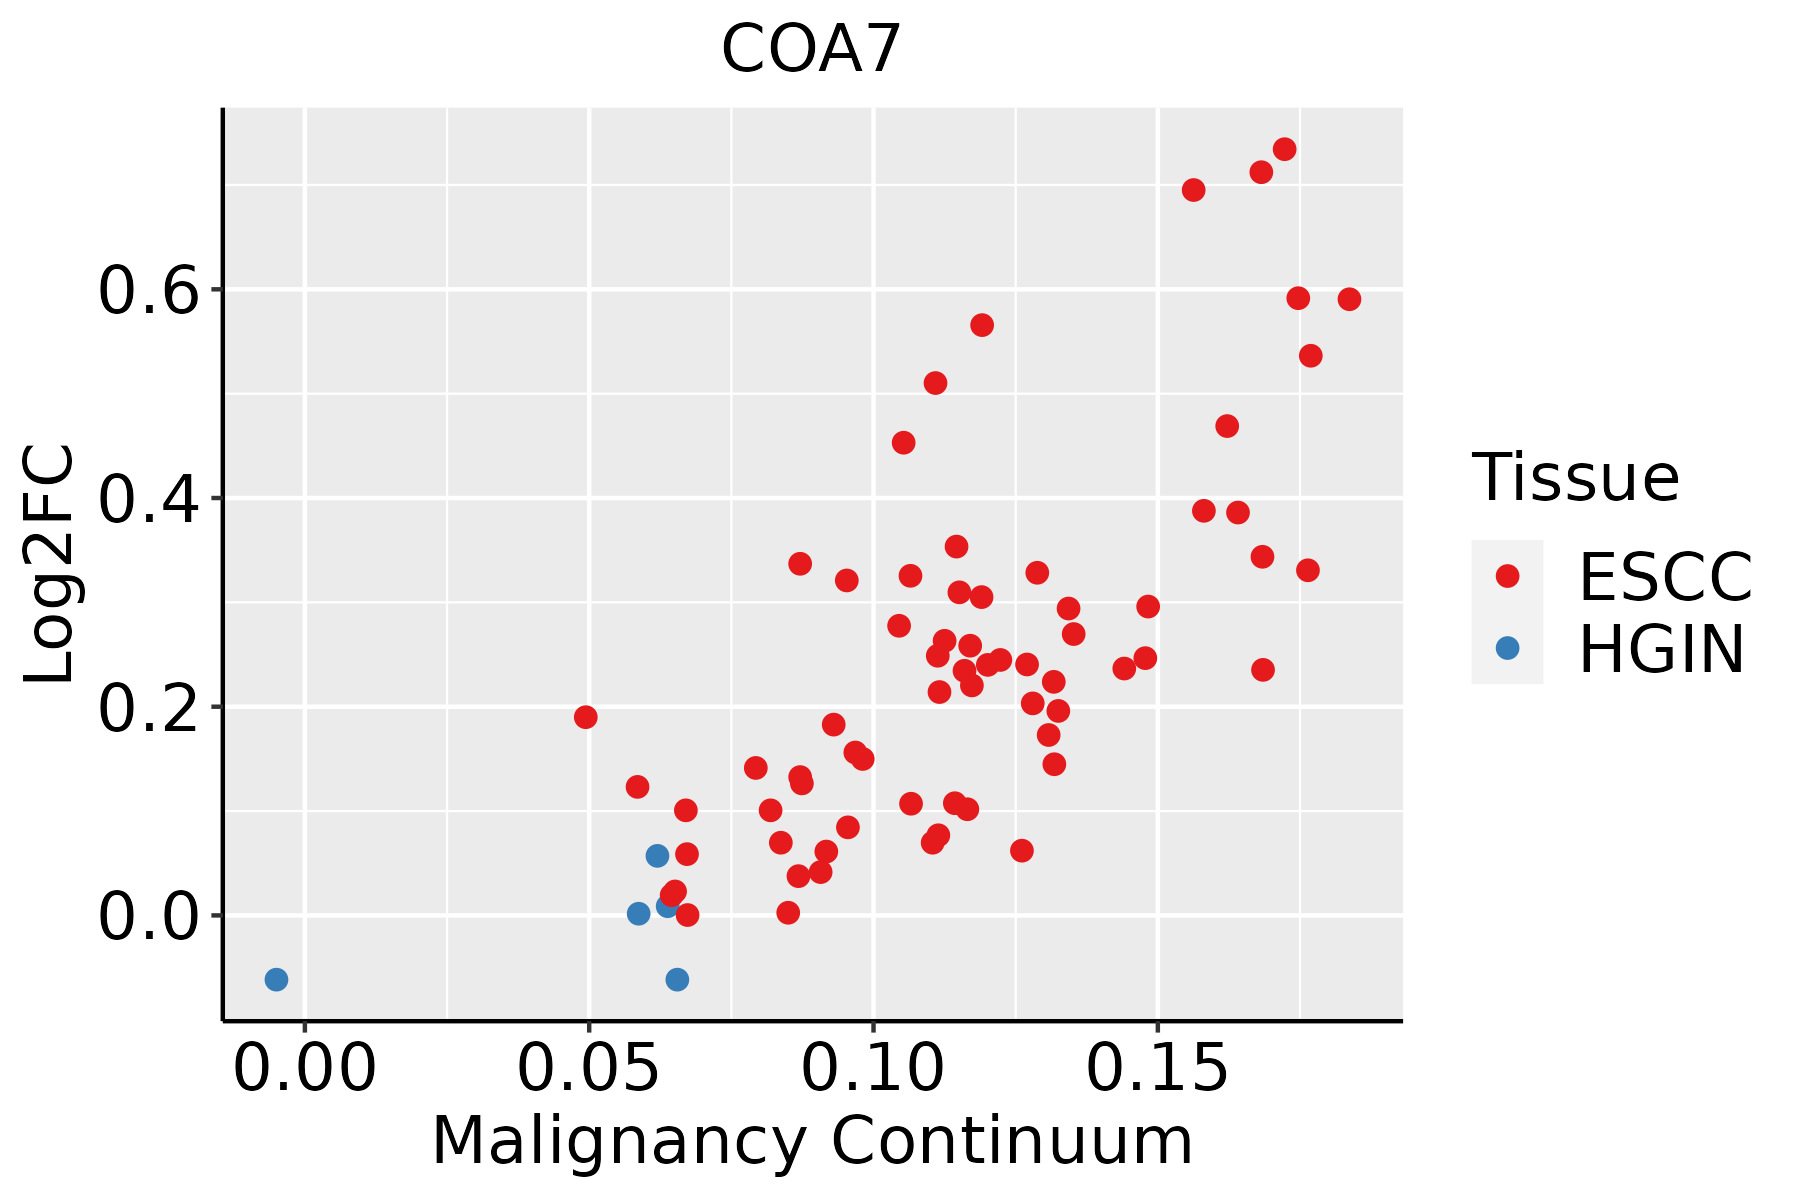 | ESCC: Esophageal squamous cell carcinoma |
| HGIN: High-grade intraepithelial neoplasias | ||
| LGIN: Low-grade intraepithelial neoplasias | ||
| Liver | 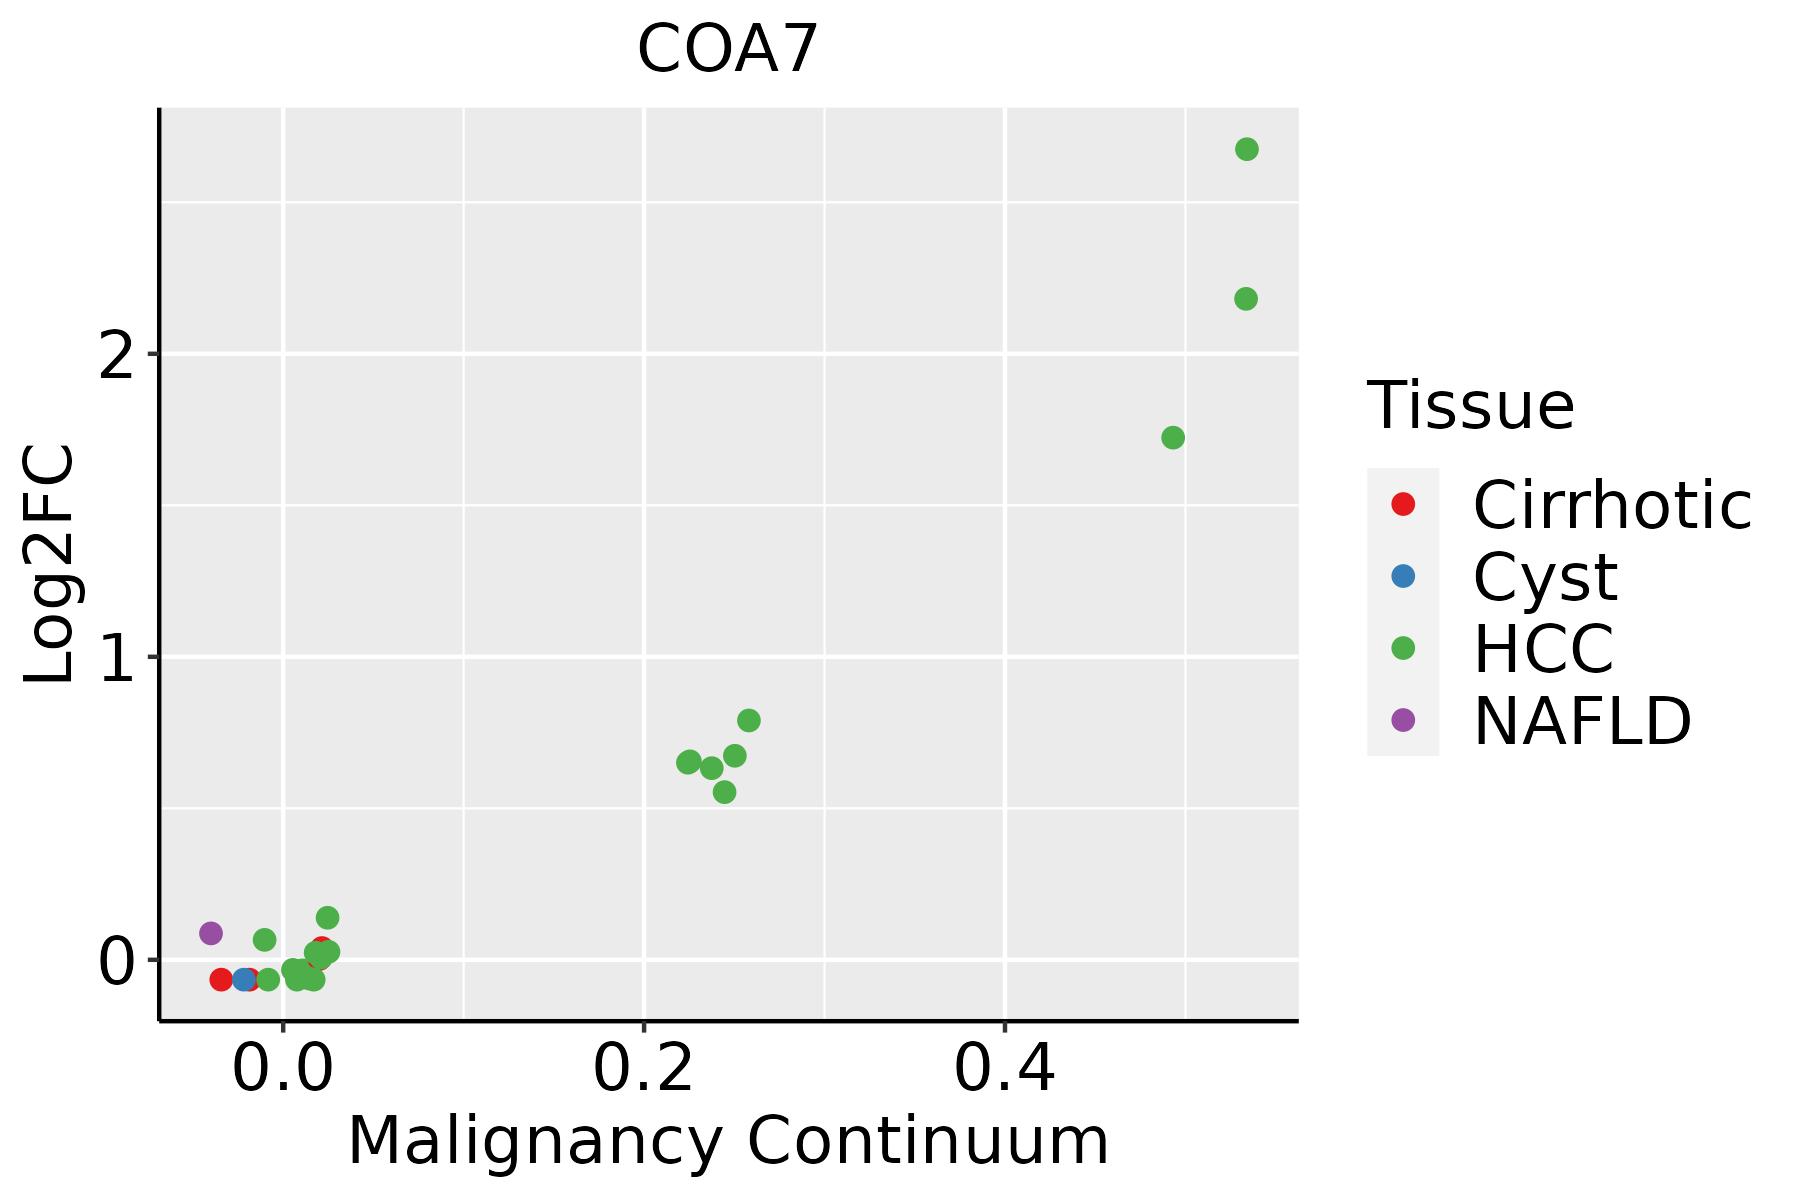 | HCC: Hepatocellular carcinoma |
| NAFLD: Non-alcoholic fatty liver disease | ||
| Oral Cavity |  | EOLP: Erosive Oral lichen planus |
| LP: leukoplakia | ||
| NEOLP: Non-erosive oral lichen planus | ||
| OSCC: Oral squamous cell carcinoma |
| ∗log2FC in expression of this searched gene in stem-like cells from each diseased tissue sample relative to stem-like cells in normal samples in each tissue plotted against the malignancy continuum. Samples are colored based on if they are from different disease stage. |
Top |
Malignant transformation related pathway analysis |
| Find out the enriched GO biological processes and KEGG pathways involved in transition from healthy to precancer to cancer |
| Tissue | Disease Stage | Enriched GO biological Processes |
| Colorectum | AD |  |
| Colorectum | SER |  |
| Colorectum | MSS |  |
| Colorectum | MSI-H |  |
| Colorectum | FAP |  |
| ∗Top 15 enriched GO BP terms are showed in the bar plot of each disease state in each tissue. Each row represents a significant GO biological process which is colored according to the -log10(p.adjust). |
| Page: 1 2 3 4 5 6 7 8 9 |
| GO ID | Tissue | Disease Stage | Description | Gene Ratio | Bg Ratio | pvalue | p.adjust | Count |
| GO:000697910 | Cervix | CC | response to oxidative stress | 102/2311 | 446/18723 | 2.99e-10 | 4.36e-08 | 102 |
| GO:006219710 | Cervix | CC | cellular response to chemical stress | 76/2311 | 337/18723 | 1.01e-07 | 5.25e-06 | 76 |
| GO:003459910 | Cervix | CC | cellular response to oxidative stress | 63/2311 | 288/18723 | 3.58e-06 | 9.50e-05 | 63 |
| GO:007099710 | Cervix | CC | neuron death | 70/2311 | 361/18723 | 7.50e-05 | 1.03e-03 | 70 |
| GO:190121410 | Cervix | CC | regulation of neuron death | 61/2311 | 319/18723 | 3.11e-04 | 3.31e-03 | 61 |
| GO:00170143 | Cervix | CC | protein nitrosylation | 7/2311 | 16/18723 | 1.79e-03 | 1.34e-02 | 7 |
| GO:00181193 | Cervix | CC | peptidyl-cysteine S-nitrosylation | 7/2311 | 16/18723 | 1.79e-03 | 1.34e-02 | 7 |
| GO:003647310 | Cervix | CC | cell death in response to oxidative stress | 21/2311 | 95/18723 | 5.32e-03 | 3.10e-02 | 21 |
| GO:0006979111 | Esophagus | ESCC | response to oxidative stress | 303/8552 | 446/18723 | 7.15e-22 | 1.30e-19 | 303 |
| GO:0062197111 | Esophagus | ESCC | cellular response to chemical stress | 234/8552 | 337/18723 | 5.37e-19 | 5.97e-17 | 234 |
| GO:0034599111 | Esophagus | ESCC | cellular response to oxidative stress | 197/8552 | 288/18723 | 3.76e-15 | 2.15e-13 | 197 |
| GO:0070997111 | Esophagus | ESCC | neuron death | 216/8552 | 361/18723 | 3.49e-08 | 6.45e-07 | 216 |
| GO:1901214111 | Esophagus | ESCC | regulation of neuron death | 186/8552 | 319/18723 | 3.35e-06 | 3.73e-05 | 186 |
| GO:003647320 | Esophagus | ESCC | cell death in response to oxidative stress | 59/8552 | 95/18723 | 9.12e-04 | 4.65e-03 | 59 |
| GO:190121516 | Esophagus | ESCC | negative regulation of neuron death | 115/8552 | 208/18723 | 3.24e-03 | 1.34e-02 | 115 |
| GO:190288220 | Esophagus | ESCC | regulation of response to oxidative stress | 58/8552 | 98/18723 | 4.86e-03 | 1.88e-02 | 58 |
| GO:190320316 | Esophagus | ESCC | regulation of oxidative stress-induced neuron death | 19/8552 | 27/18723 | 8.35e-03 | 2.95e-02 | 19 |
| GO:190040720 | Esophagus | ESCC | regulation of cellular response to oxidative stress | 52/8552 | 89/18723 | 1.04e-02 | 3.56e-02 | 52 |
| GO:190320120 | Esophagus | ESCC | regulation of oxidative stress-induced cell death | 44/8552 | 74/18723 | 1.18e-02 | 3.94e-02 | 44 |
| GO:00069797 | Liver | NAFLD | response to oxidative stress | 78/1882 | 446/18723 | 7.85e-07 | 4.29e-05 | 78 |
| Page: 1 2 3 4 5 6 7 8 9 10 11 12 13 14 |
| Pathway ID | Tissue | Disease Stage | Description | Gene Ratio | Bg Ratio | pvalue | p.adjust | qvalue | Count |
| hsa04714211 | Esophagus | ESCC | Thermogenesis | 163/4205 | 232/8465 | 9.22e-11 | 1.14e-09 | 5.86e-10 | 163 |
| hsa04714310 | Esophagus | ESCC | Thermogenesis | 163/4205 | 232/8465 | 9.22e-11 | 1.14e-09 | 5.86e-10 | 163 |
| hsa0471422 | Liver | HCC | Thermogenesis | 170/4020 | 232/8465 | 5.36e-16 | 2.25e-14 | 1.25e-14 | 170 |
| hsa0471432 | Liver | HCC | Thermogenesis | 170/4020 | 232/8465 | 5.36e-16 | 2.25e-14 | 1.25e-14 | 170 |
| hsa0471430 | Oral cavity | OSCC | Thermogenesis | 138/3704 | 232/8465 | 7.67e-07 | 4.35e-06 | 2.22e-06 | 138 |
| hsa04714113 | Oral cavity | OSCC | Thermogenesis | 138/3704 | 232/8465 | 7.67e-07 | 4.35e-06 | 2.22e-06 | 138 |
| Page: 1 |
Top |
Cell-cell communication analysis |
| Identification of potential cell-cell interactions between two cell types and their ligand-receptor pairs for different disease states |
| Ligand | Receptor | LRpair | Pathway | Tissue | Disease Stage |
| Page: 1 |
Top |
Single-cell gene regulatory network inference analysis |
| Find out the significant the regulons (TFs) and the target genes of each regulon across cell types for different disease states |
| TF | Cell Type | Tissue | Disease Stage | Target Gene | RSS | Regulon Activity |
| ∗The dot plots of a searched regulon are shown for all cell subpopulations in each disease state of each tissue based on the regulon specific score inferred using pySCENIC and by calculating the average expression. |
| Page: 1 |
Top |
Somatic mutation of malignant transformation related genes |
| Annotation of somatic variants for genes involved in malignant transformation |
| Hugo Symbol | Variant Class | Variant Classification | dbSNP RS | HGVSc | HGVSp | HGVSp Short | SWISSPROT | BIOTYPE | SIFT | PolyPhen | Tumor Sample Barcode | Tissue | Histology | Sex | Age | Stage | Therapy Types | Drugs | Outcome |
| COA7 | SNV | Missense_Mutation | c.343N>A | p.Gly115Ser | p.G115S | Q96BR5 | protein_coding | deleterious(0.01) | possibly_damaging(0.809) | TCGA-A8-A0A1-01 | Breast | breast invasive carcinoma | Female | >=65 | I/II | Hormone Therapy | tamoxiphen | SD | |
| COA7 | SNV | Missense_Mutation | c.671N>C | p.Gly224Ala | p.G224A | Q96BR5 | protein_coding | tolerated(1) | benign(0) | TCGA-AO-A03T-01 | Breast | breast invasive carcinoma | Female | <65 | I/II | Chemotherapy | cyclophosphamide | SD | |
| COA7 | insertion | Nonsense_Mutation | novel | c.326_327insCTTAACATTTGGGTAATGT | p.Ala110LeufsTer5 | p.A110Lfs*5 | Q96BR5 | protein_coding | TCGA-A2-A0D1-01 | Breast | breast invasive carcinoma | Female | >=65 | I/II | Chemotherapy | taxotere | SD | ||
| COA7 | insertion | Frame_Shift_Ins | novel | c.601_602insTCACCATCTACTGT | p.Asp201ValfsTer15 | p.D201Vfs*15 | Q96BR5 | protein_coding | TCGA-AO-A0J5-01 | Breast | breast invasive carcinoma | Female | <65 | III/IV | Other, specify in notesBisphosphonate | zoledronic | PD | ||
| COA7 | SNV | Missense_Mutation | novel | c.515G>A | p.Cys172Tyr | p.C172Y | Q96BR5 | protein_coding | tolerated(0.11) | benign(0.003) | TCGA-2W-A8YY-01 | Cervix | cervical & endocervical cancer | Female | <65 | I/II | Chemotherapy | cisplatin | CR |
| COA7 | SNV | Missense_Mutation | c.601N>C | p.Asp201His | p.D201H | Q96BR5 | protein_coding | deleterious(0.02) | benign(0.253) | TCGA-VS-A94X-01 | Cervix | cervical & endocervical cancer | Female | <65 | I/II | Chemotherapy | cisplatin | PD | |
| COA7 | SNV | Missense_Mutation | c.344N>A | p.Gly115Asp | p.G115D | Q96BR5 | protein_coding | deleterious(0) | probably_damaging(0.925) | TCGA-D5-6930-01 | Colorectum | colon adenocarcinoma | Male | >=65 | I/II | Unknown | Unknown | SD | |
| COA7 | SNV | Missense_Mutation | novel | c.524N>A | p.Ser175Tyr | p.S175Y | Q96BR5 | protein_coding | deleterious(0) | probably_damaging(0.911) | TCGA-A5-A0G1-01 | Endometrium | uterine corpus endometrioid carcinoma | Female | >=65 | I/II | Unknown | Unknown | SD |
| COA7 | SNV | Missense_Mutation | rs768084335 | c.115N>T | p.Arg39Trp | p.R39W | Q96BR5 | protein_coding | deleterious(0.01) | probably_damaging(0.981) | TCGA-AX-A06F-01 | Endometrium | uterine corpus endometrioid carcinoma | Female | <65 | III/IV | Chemotherapy | carboplatin | SD |
| COA7 | SNV | Missense_Mutation | rs768757974 | c.296N>T | p.Ala99Val | p.A99V | Q96BR5 | protein_coding | tolerated(0.08) | benign(0.054) | TCGA-AX-A0J1-01 | Endometrium | uterine corpus endometrioid carcinoma | Female | >=65 | I/II | Unknown | Unknown | SD |
| Page: 1 2 3 |
Top |
Related drugs of malignant transformation related genes |
| Identification of chemicals and drugs interact with genes involved in malignant transfromation |
| (DGIdb 4.0) |
| Entrez ID | Symbol | Category | Interaction Types | Drug Claim Name | Drug Name | PMIDs |
| Page: 1 |

Copyright 2023-Present -The University of Texas Health Science Center at Houston |