
|
|||||
|
 | |
| |
| |
| |
| |
| |
|
Gene: COA6 |
Gene summary for COA6 |
| Gene information | Species | Human | Gene symbol | COA6 | Gene ID | 388753 |
| Gene name | cytochrome c oxidase assembly factor 6 | |
| Gene Alias | C1orf31 | |
| Cytomap | 1q42.2 | |
| Gene Type | protein-coding | GO ID | GO:0006091 | UniProtAcc | Q5JTJ3 |
Top |
Malignant transformation analysis |
| Identification of the aberrant gene expression in precancerous and cancerous lesions by comparing the gene expression of stem-like cells in diseased tissues with normal stem cells |
| Entrez ID | Symbol | Replicates | Species | Organ | Tissue | Adj P-value | Log2FC | Malignancy |
| 388753 | COA6 | LZE2T | Human | Esophagus | ESCC | 7.15e-17 | 1.93e+00 | 0.082 |
| 388753 | COA6 | LZE4T | Human | Esophagus | ESCC | 9.11e-39 | 1.77e+00 | 0.0811 |
| 388753 | COA6 | LZE7T | Human | Esophagus | ESCC | 2.07e-25 | 1.66e+00 | 0.0667 |
| 388753 | COA6 | LZE20T | Human | Esophagus | ESCC | 8.91e-06 | 2.81e-01 | 0.0662 |
| 388753 | COA6 | LZE22T | Human | Esophagus | ESCC | 4.14e-04 | 6.68e-01 | 0.068 |
| 388753 | COA6 | LZE24T | Human | Esophagus | ESCC | 2.54e-11 | 6.06e-01 | 0.0596 |
| 388753 | COA6 | LZE22D3 | Human | Esophagus | HGIN | 3.20e-02 | 1.61e-01 | 0.0653 |
| 388753 | COA6 | LZE21T | Human | Esophagus | ESCC | 6.76e-13 | 8.53e-01 | 0.0655 |
| 388753 | COA6 | LZE6T | Human | Esophagus | ESCC | 8.69e-07 | 3.36e-01 | 0.0845 |
| 388753 | COA6 | P1T-E | Human | Esophagus | ESCC | 5.68e-16 | 4.96e-01 | 0.0875 |
| 388753 | COA6 | P2T-E | Human | Esophagus | ESCC | 3.70e-32 | 7.96e-01 | 0.1177 |
| 388753 | COA6 | P4T-E | Human | Esophagus | ESCC | 2.68e-32 | 9.07e-01 | 0.1323 |
| 388753 | COA6 | P5T-E | Human | Esophagus | ESCC | 1.10e-31 | 8.97e-01 | 0.1327 |
| 388753 | COA6 | P8T-E | Human | Esophagus | ESCC | 2.86e-17 | 6.13e-01 | 0.0889 |
| 388753 | COA6 | P9T-E | Human | Esophagus | ESCC | 2.31e-57 | 1.68e+00 | 0.1131 |
| 388753 | COA6 | P10T-E | Human | Esophagus | ESCC | 2.60e-67 | 1.38e+00 | 0.116 |
| 388753 | COA6 | P11T-E | Human | Esophagus | ESCC | 2.38e-22 | 1.12e+00 | 0.1426 |
| 388753 | COA6 | P12T-E | Human | Esophagus | ESCC | 3.00e-30 | 8.37e-01 | 0.1122 |
| 388753 | COA6 | P15T-E | Human | Esophagus | ESCC | 1.27e-51 | 1.27e+00 | 0.1149 |
| 388753 | COA6 | P16T-E | Human | Esophagus | ESCC | 6.95e-18 | 3.61e-01 | 0.1153 |
| Page: 1 2 3 4 5 6 7 |
| Tissue | Expression Dynamics | Abbreviation |
| Esophagus |  | ESCC: Esophageal squamous cell carcinoma |
| HGIN: High-grade intraepithelial neoplasias | ||
| LGIN: Low-grade intraepithelial neoplasias | ||
| Liver | 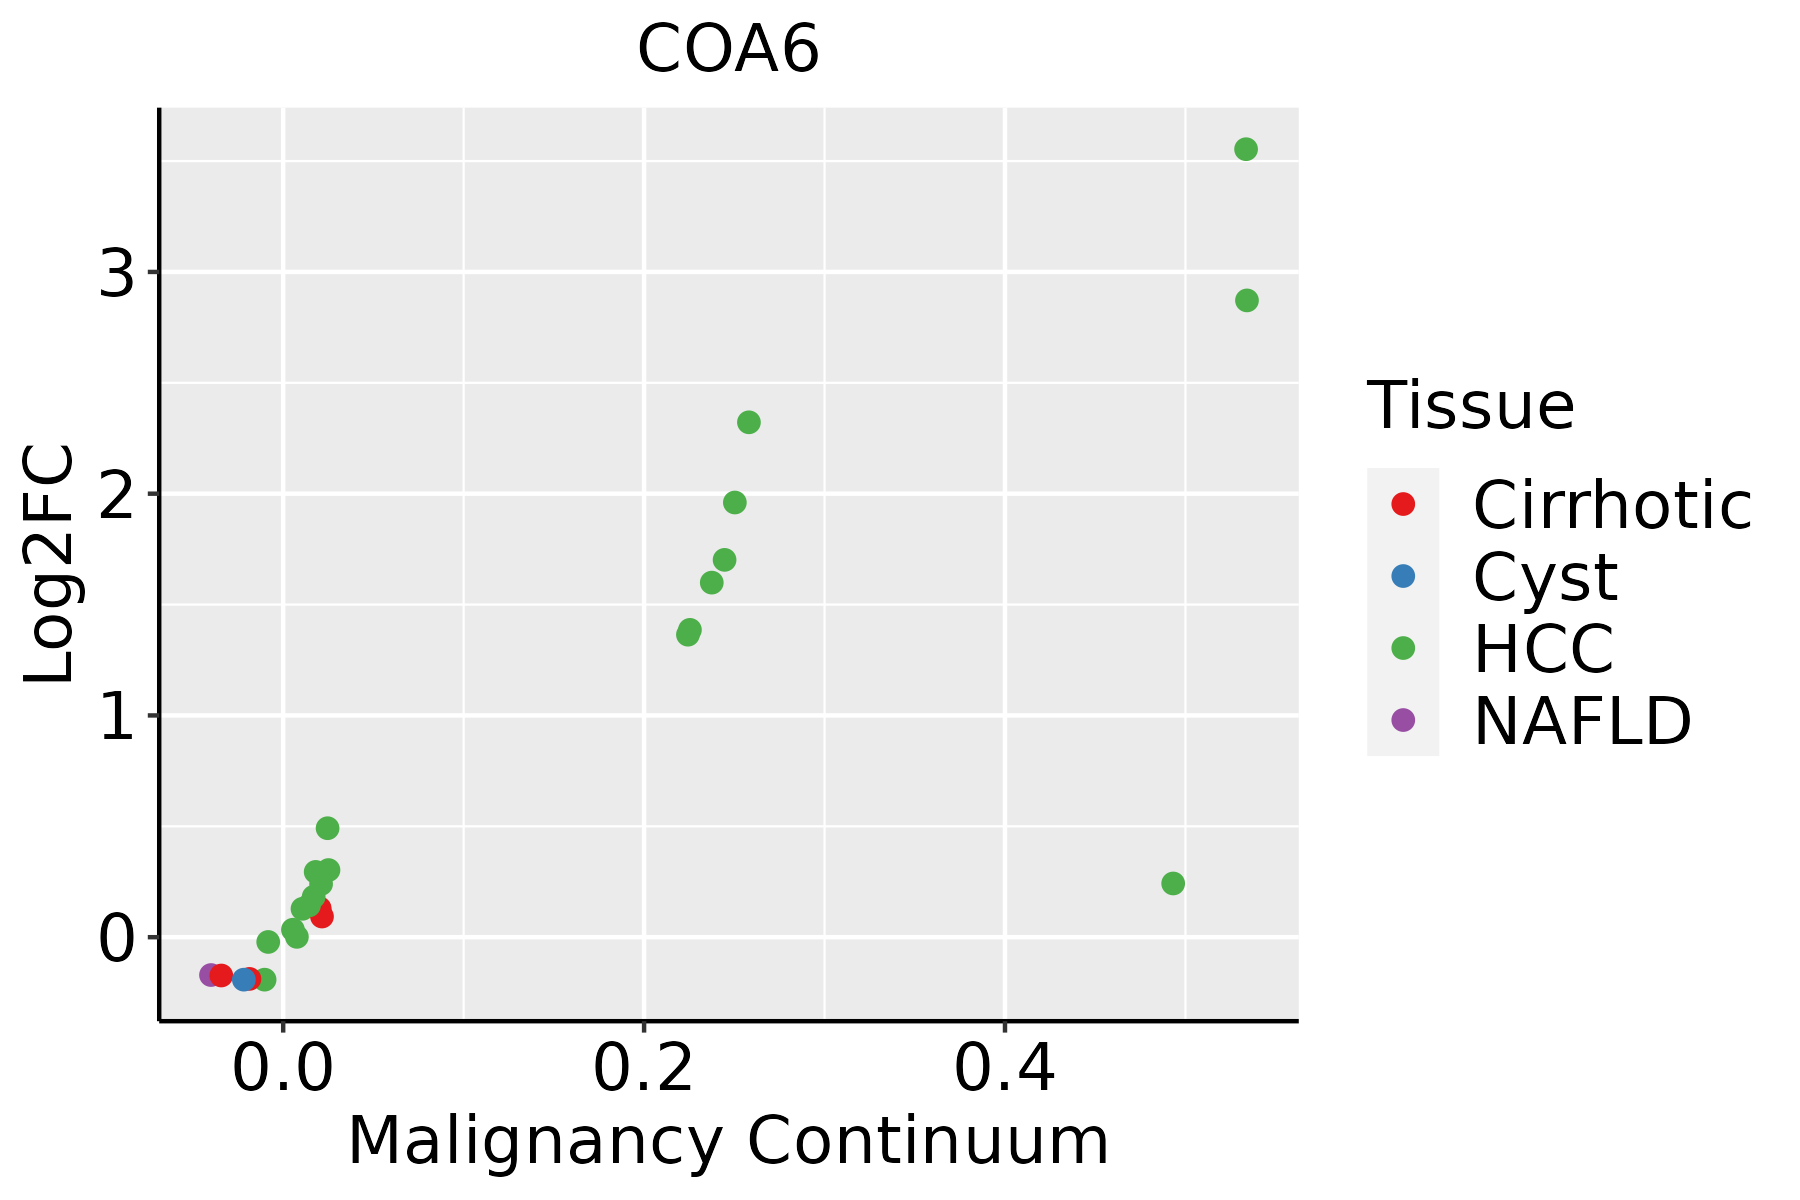 | HCC: Hepatocellular carcinoma |
| NAFLD: Non-alcoholic fatty liver disease | ||
| Oral Cavity | 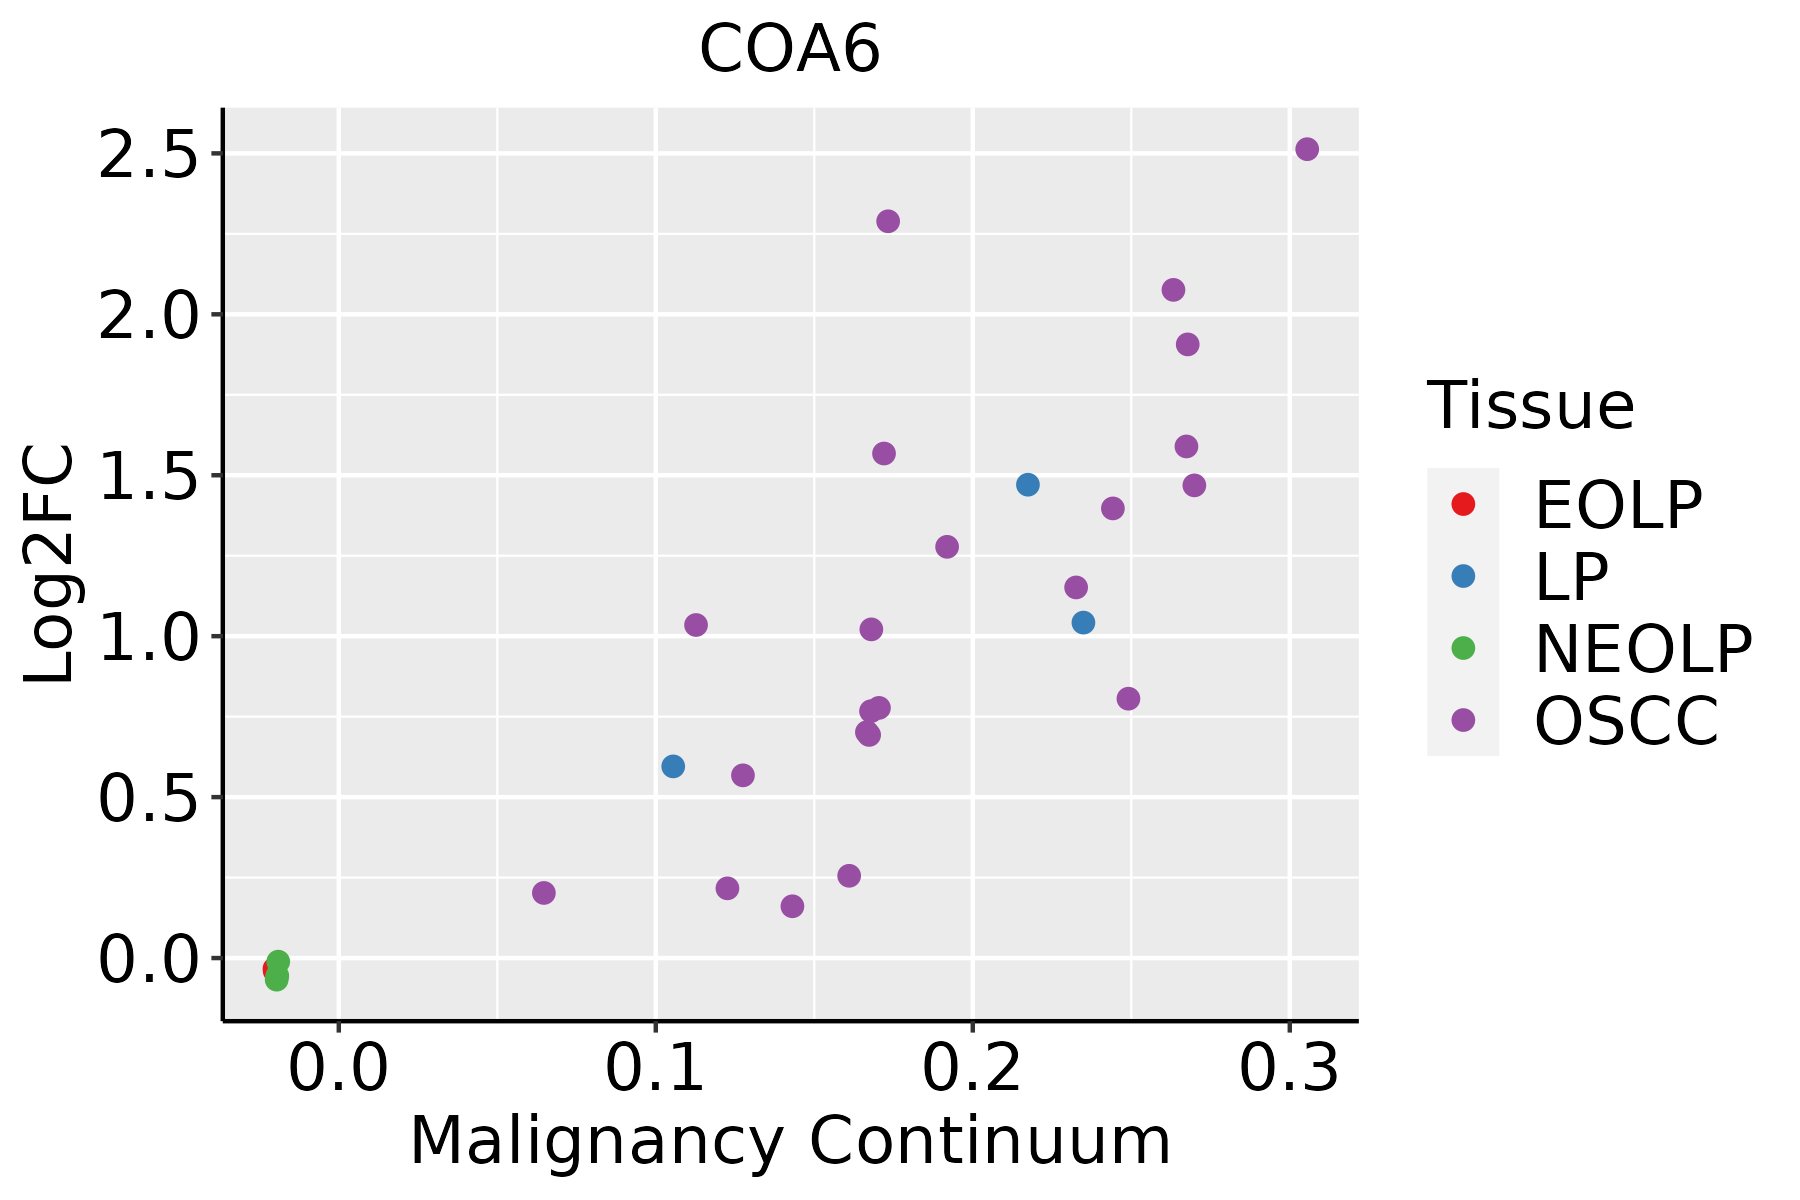 | EOLP: Erosive Oral lichen planus |
| LP: leukoplakia | ||
| NEOLP: Non-erosive oral lichen planus | ||
| OSCC: Oral squamous cell carcinoma | ||
| Skin | 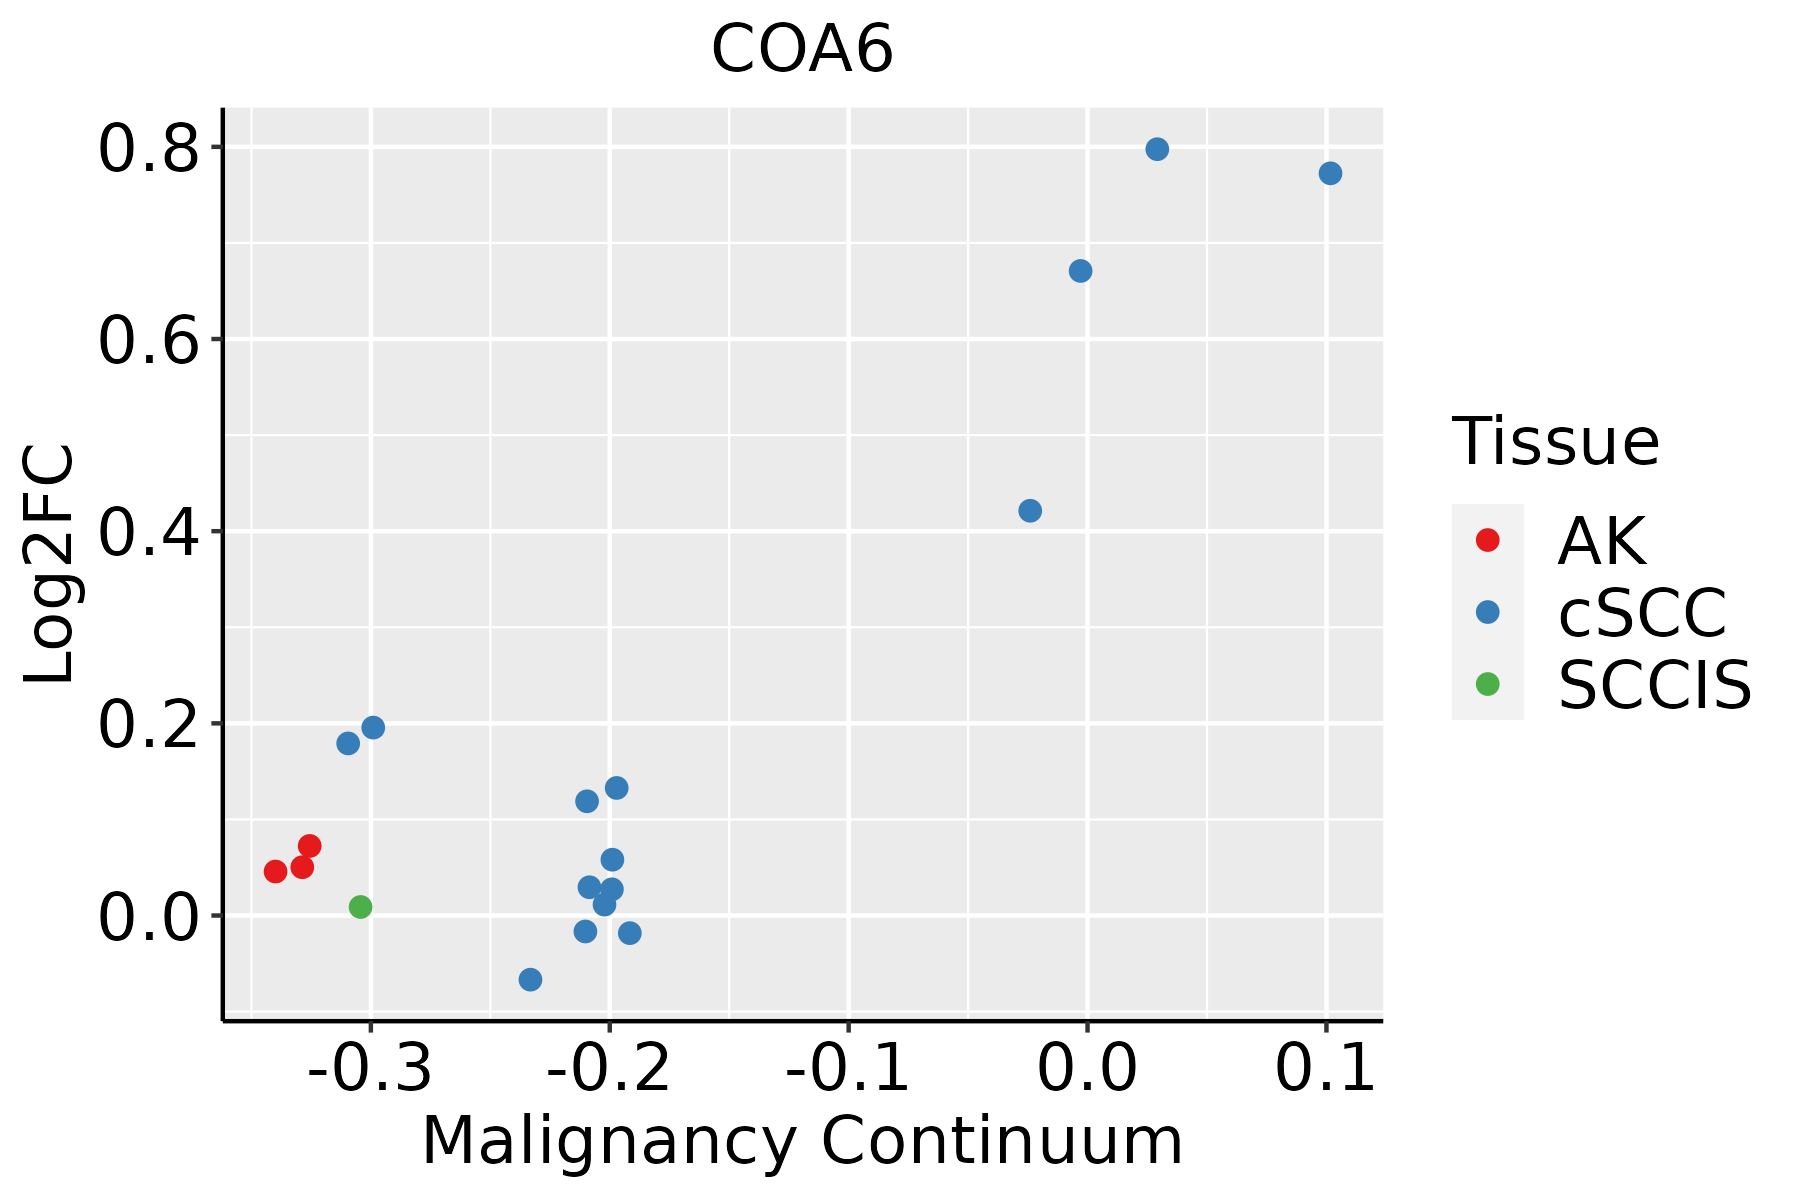 | AK: Actinic keratosis |
| cSCC: Cutaneous squamous cell carcinoma | ||
| SCCIS:squamous cell carcinoma in situ | ||
| Thyroid | 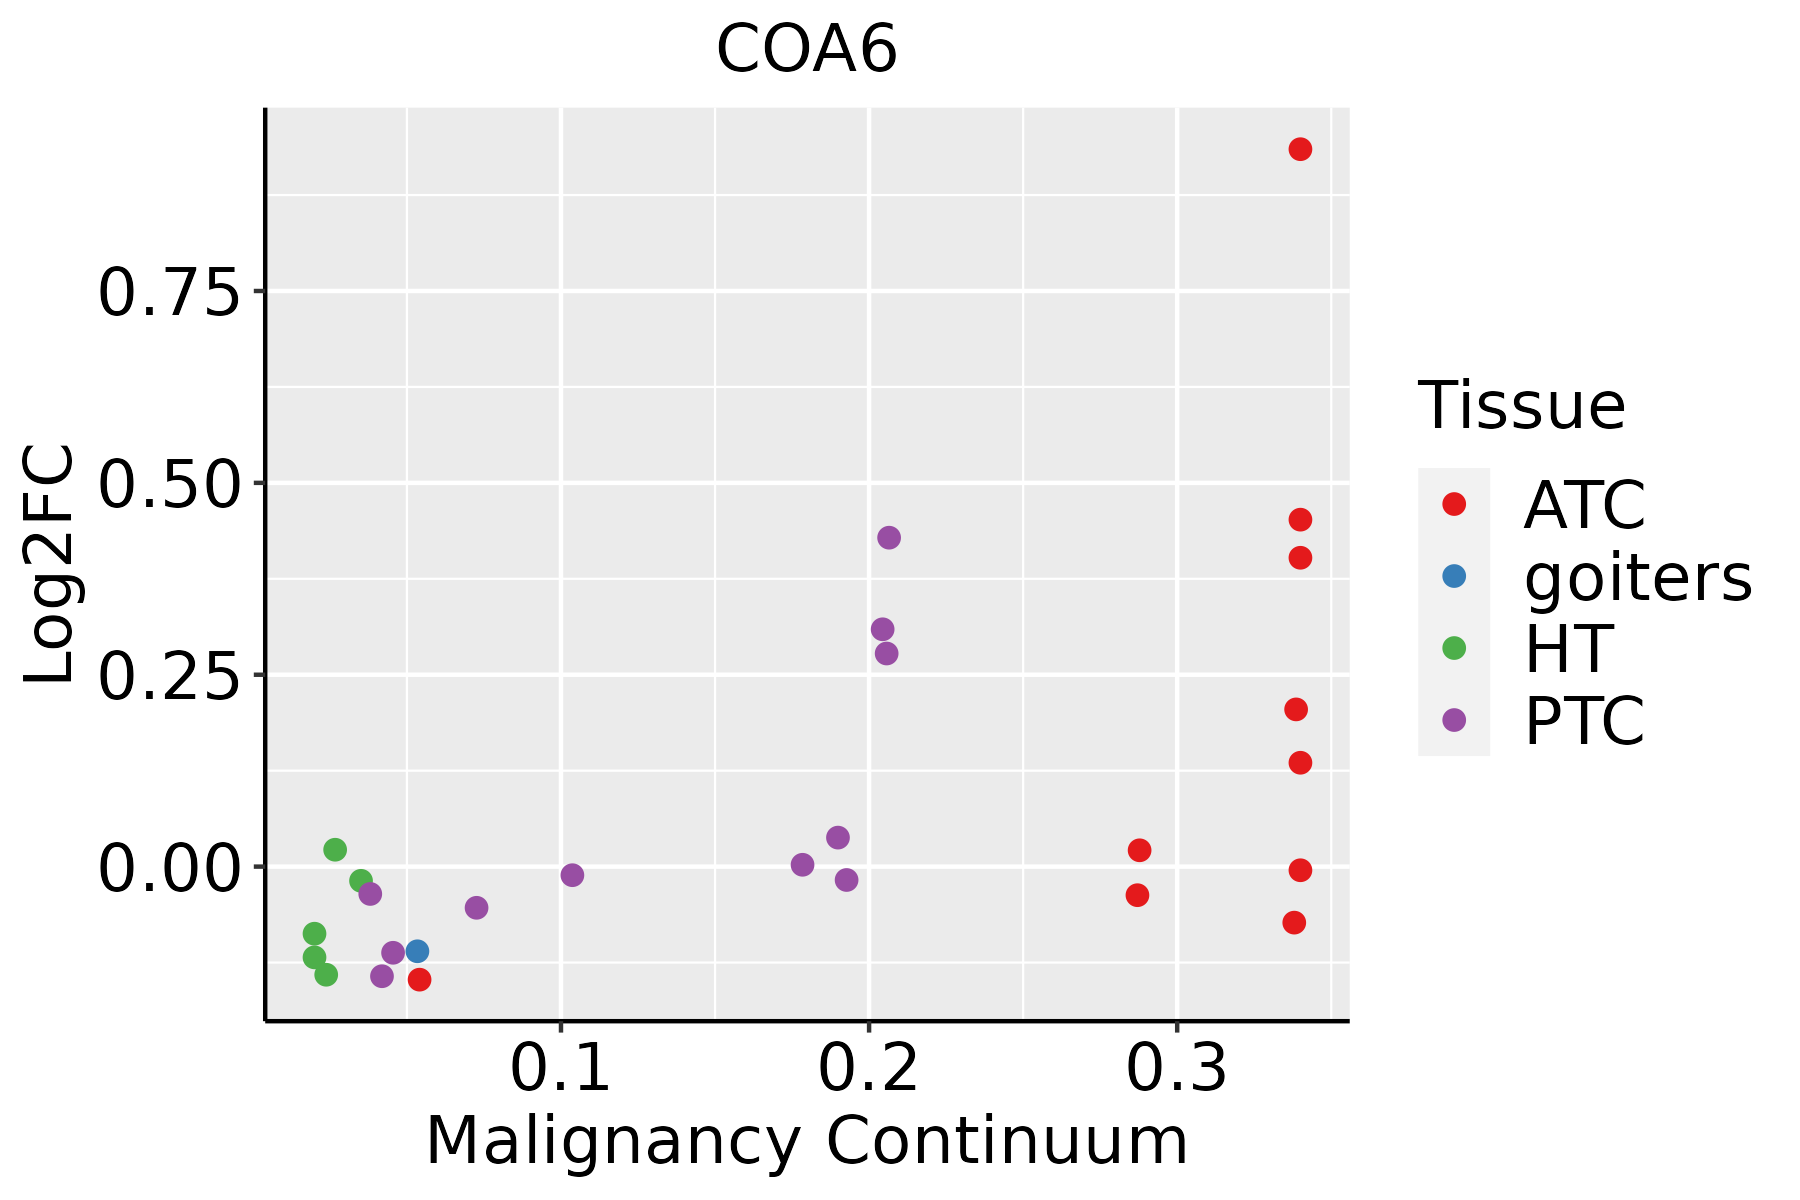 | ATC: Anaplastic thyroid cancer |
| HT: Hashimoto's thyroiditis | ||
| PTC: Papillary thyroid cancer |
| ∗log2FC in expression of this searched gene in stem-like cells from each diseased tissue sample relative to stem-like cells in normal samples in each tissue plotted against the malignancy continuum. Samples are colored based on if they are from different disease stage. |
Top |
Malignant transformation related pathway analysis |
| Find out the enriched GO biological processes and KEGG pathways involved in transition from healthy to precancer to cancer |
| Tissue | Disease Stage | Enriched GO biological Processes |
| Colorectum | AD |  |
| Colorectum | SER |  |
| Colorectum | MSS |  |
| Colorectum | MSI-H |  |
| Colorectum | FAP |  |
| ∗Top 15 enriched GO BP terms are showed in the bar plot of each disease state in each tissue. Each row represents a significant GO biological process which is colored according to the -log10(p.adjust). |
| Page: 1 2 3 4 5 6 7 8 9 |
| GO ID | Tissue | Disease Stage | Description | Gene Ratio | Bg Ratio | pvalue | p.adjust | Count |
| GO:003009910 | Cervix | CC | myeloid cell differentiation | 83/2311 | 381/18723 | 1.31e-07 | 6.42e-06 | 83 |
| GO:0030099 | Colorectum | AD | myeloid cell differentiation | 119/3918 | 381/18723 | 1.24e-06 | 4.01e-05 | 119 |
| GO:00300992 | Colorectum | MSS | myeloid cell differentiation | 110/3467 | 381/18723 | 4.48e-07 | 1.75e-05 | 110 |
| GO:00300994 | Colorectum | FAP | myeloid cell differentiation | 81/2622 | 381/18723 | 6.33e-05 | 1.22e-03 | 81 |
| GO:00300995 | Colorectum | CRC | myeloid cell differentiation | 66/2078 | 381/18723 | 1.59e-04 | 2.87e-03 | 66 |
| GO:000611920 | Esophagus | HGIN | oxidative phosphorylation | 69/2587 | 141/18723 | 1.37e-23 | 2.05e-20 | 69 |
| GO:000906020 | Esophagus | HGIN | aerobic respiration | 81/2587 | 189/18723 | 1.07e-22 | 9.26e-20 | 81 |
| GO:004603427 | Esophagus | HGIN | ATP metabolic process | 101/2587 | 277/18723 | 1.53e-21 | 1.02e-18 | 101 |
| GO:000609120 | Esophagus | HGIN | generation of precursor metabolites and energy | 145/2587 | 490/18723 | 3.41e-20 | 2.04e-17 | 145 |
| GO:004533320 | Esophagus | HGIN | cellular respiration | 86/2587 | 230/18723 | 2.41e-19 | 1.20e-16 | 86 |
| GO:001598020 | Esophagus | HGIN | energy derivation by oxidation of organic compounds | 105/2587 | 318/18723 | 1.16e-18 | 4.99e-16 | 105 |
| GO:004277320 | Esophagus | HGIN | ATP synthesis coupled electron transport | 49/2587 | 95/18723 | 2.21e-18 | 7.36e-16 | 49 |
| GO:004277520 | Esophagus | HGIN | mitochondrial ATP synthesis coupled electron transport | 49/2587 | 95/18723 | 2.21e-18 | 7.36e-16 | 49 |
| GO:002290420 | Esophagus | HGIN | respiratory electron transport chain | 51/2587 | 114/18723 | 9.63e-16 | 2.41e-13 | 51 |
| GO:002290020 | Esophagus | HGIN | electron transport chain | 66/2587 | 175/18723 | 2.21e-15 | 4.73e-13 | 66 |
| GO:00170044 | Esophagus | HGIN | cytochrome complex assembly | 18/2587 | 36/18723 | 2.39e-07 | 1.14e-05 | 18 |
| GO:00085353 | Esophagus | HGIN | respiratory chain complex IV assembly | 14/2587 | 26/18723 | 1.68e-06 | 6.29e-05 | 14 |
| GO:0006091110 | Esophagus | ESCC | generation of precursor metabolites and energy | 331/8552 | 490/18723 | 3.86e-23 | 8.45e-21 | 331 |
| GO:0045333110 | Esophagus | ESCC | cellular respiration | 173/8552 | 230/18723 | 4.53e-20 | 5.99e-18 | 173 |
| GO:0009060110 | Esophagus | ESCC | aerobic respiration | 145/8552 | 189/18723 | 2.16e-18 | 2.21e-16 | 145 |
| Page: 1 2 3 4 5 6 7 |
| Pathway ID | Tissue | Disease Stage | Description | Gene Ratio | Bg Ratio | pvalue | p.adjust | qvalue | Count |
| hsa0471439 | Esophagus | HGIN | Thermogenesis | 91/1383 | 232/8465 | 1.97e-17 | 5.36e-16 | 4.25e-16 | 91 |
| hsa04714114 | Esophagus | HGIN | Thermogenesis | 91/1383 | 232/8465 | 1.97e-17 | 5.36e-16 | 4.25e-16 | 91 |
| hsa04714211 | Esophagus | ESCC | Thermogenesis | 163/4205 | 232/8465 | 9.22e-11 | 1.14e-09 | 5.86e-10 | 163 |
| hsa04714310 | Esophagus | ESCC | Thermogenesis | 163/4205 | 232/8465 | 9.22e-11 | 1.14e-09 | 5.86e-10 | 163 |
| hsa0471414 | Liver | Cirrhotic | Thermogenesis | 121/2530 | 232/8465 | 5.70e-13 | 1.36e-11 | 8.36e-12 | 121 |
| hsa0471415 | Liver | Cirrhotic | Thermogenesis | 121/2530 | 232/8465 | 5.70e-13 | 1.36e-11 | 8.36e-12 | 121 |
| hsa0471422 | Liver | HCC | Thermogenesis | 170/4020 | 232/8465 | 5.36e-16 | 2.25e-14 | 1.25e-14 | 170 |
| hsa0471432 | Liver | HCC | Thermogenesis | 170/4020 | 232/8465 | 5.36e-16 | 2.25e-14 | 1.25e-14 | 170 |
| hsa0471430 | Oral cavity | OSCC | Thermogenesis | 138/3704 | 232/8465 | 7.67e-07 | 4.35e-06 | 2.22e-06 | 138 |
| hsa04714113 | Oral cavity | OSCC | Thermogenesis | 138/3704 | 232/8465 | 7.67e-07 | 4.35e-06 | 2.22e-06 | 138 |
| hsa04714210 | Oral cavity | LP | Thermogenesis | 105/2418 | 232/8465 | 3.14e-08 | 4.98e-07 | 3.21e-07 | 105 |
| hsa0471438 | Oral cavity | LP | Thermogenesis | 105/2418 | 232/8465 | 3.14e-08 | 4.98e-07 | 3.21e-07 | 105 |
| Page: 1 |
Top |
Cell-cell communication analysis |
| Identification of potential cell-cell interactions between two cell types and their ligand-receptor pairs for different disease states |
| Ligand | Receptor | LRpair | Pathway | Tissue | Disease Stage |
| Page: 1 |
Top |
Single-cell gene regulatory network inference analysis |
| Find out the significant the regulons (TFs) and the target genes of each regulon across cell types for different disease states |
| TF | Cell Type | Tissue | Disease Stage | Target Gene | RSS | Regulon Activity |
| ∗The dot plots of a searched regulon are shown for all cell subpopulations in each disease state of each tissue based on the regulon specific score inferred using pySCENIC and by calculating the average expression. |
| Page: 1 |
Top |
Somatic mutation of malignant transformation related genes |
| Annotation of somatic variants for genes involved in malignant transformation |
| Hugo Symbol | Variant Class | Variant Classification | dbSNP RS | HGVSc | HGVSp | HGVSp Short | SWISSPROT | BIOTYPE | SIFT | PolyPhen | Tumor Sample Barcode | Tissue | Histology | Sex | Age | Stage | Therapy Types | Drugs | Outcome |
| COA6 | SNV | Missense_Mutation | c.277G>A | p.Asp93Asn | p.D93N | protein_coding | deleterious(0.01) | probably_damaging(1) | TCGA-AC-A23H-01 | Breast | breast invasive carcinoma | Female | >=65 | I/II | Unknown | Unknown | PD | ||
| COA6 | SNV | Missense_Mutation | novel | c.392G>A | p.Arg131Lys | p.R131K | protein_coding | tolerated(0.3) | benign(0.239) | TCGA-BH-A18J-01 | Breast | breast invasive carcinoma | Female | <65 | III/IV | Unknown | Unknown | PD | |
| COA6 | SNV | Missense_Mutation | novel | c.386N>T | p.Asp129Val | p.D129V | protein_coding | deleterious(0.02) | benign(0.439) | TCGA-E2-A15G-01 | Breast | breast invasive carcinoma | Female | >=65 | I/II | Hormone Therapy | arimidex | SD | |
| COA6 | SNV | Missense_Mutation | c.352N>A | p.Ser118Thr | p.S118T | protein_coding | deleterious(0.05) | benign(0.07) | TCGA-GM-A2DH-01 | Breast | breast invasive carcinoma | Female | <65 | I/II | Chemotherapy | taxol | CR | ||
| COA6 | SNV | Missense_Mutation | rs754467006 | c.88N>C | p.Glu30Gln | p.E30Q | protein_coding | deleterious_low_confidence(0) | benign(0.009) | TCGA-JX-A3Q0-01 | Cervix | cervical & endocervical cancer | Female | <65 | III/IV | Unknown | Unknown | SD | |
| COA6 | SNV | Missense_Mutation | c.302N>G | p.Glu101Gly | p.E101G | protein_coding | deleterious(0.01) | benign(0.07) | TCGA-NH-A5IV-01 | Colorectum | colon adenocarcinoma | Female | >=65 | I/II | Unknown | Unknown | SD | ||
| COA6 | deletion | Frame_Shift_Del | c.266delN | p.Ala91ProfsTer9 | p.A91Pfs*9 | protein_coding | TCGA-G4-6320-01 | Colorectum | colon adenocarcinoma | Male | >=65 | III/IV | Chemotherapy | oxaliplatin | SD | ||||
| COA6 | SNV | Missense_Mutation | novel | c.146T>G | p.Leu49Trp | p.L49W | protein_coding | deleterious_low_confidence(0) | probably_damaging(0.967) | TCGA-AX-A2HC-01 | Endometrium | uterine corpus endometrioid carcinoma | Female | <65 | III/IV | Chemotherapy | paclitaxel | PD | |
| COA6 | SNV | Missense_Mutation | novel | c.322N>A | p.Gln108Lys | p.Q108K | protein_coding | tolerated(0.4) | benign(0.013) | TCGA-QS-A5YQ-01 | Endometrium | uterine corpus endometrioid carcinoma | Female | <65 | III/IV | Chemotherapy | cisplatin | CR | |
| COA6 | deletion | Frame_Shift_Del | c.266delN | p.Ala91ProfsTer9 | p.A91Pfs*9 | protein_coding | TCGA-EC-A1QX-01 | Endometrium | uterine corpus endometrioid carcinoma | Female | >=65 | I/II | Chemotherapy | cyclophosphamide | PD |
| Page: 1 2 |
Top |
Related drugs of malignant transformation related genes |
| Identification of chemicals and drugs interact with genes involved in malignant transfromation |
| (DGIdb 4.0) |
| Entrez ID | Symbol | Category | Interaction Types | Drug Claim Name | Drug Name | PMIDs |
| Page: 1 |

Copyright 2023-Present -The University of Texas Health Science Center at Houston |