
|
|||||
|
 | |
| |
| |
| |
| |
| |
|
Gene: COA3 |
Gene summary for COA3 |
| Gene information | Species | Human | Gene symbol | COA3 | Gene ID | 28958 |
| Gene name | cytochrome c oxidase assembly factor 3 | |
| Gene Alias | CCDC56 | |
| Cytomap | 17q21.2 | |
| Gene Type | protein-coding | GO ID | GO:0006412 | UniProtAcc | A0A024R1X4 |
Top |
Malignant transformation analysis |
| Identification of the aberrant gene expression in precancerous and cancerous lesions by comparing the gene expression of stem-like cells in diseased tissues with normal stem cells |
| Entrez ID | Symbol | Replicates | Species | Organ | Tissue | Adj P-value | Log2FC | Malignancy |
| 28958 | COA3 | GSM4909281 | Human | Breast | IDC | 1.01e-02 | 2.35e-01 | 0.21 |
| 28958 | COA3 | GSM4909286 | Human | Breast | IDC | 1.13e-07 | 1.83e-01 | 0.1081 |
| 28958 | COA3 | GSM4909296 | Human | Breast | IDC | 2.03e-02 | -1.04e-01 | 0.1524 |
| 28958 | COA3 | GSM4909297 | Human | Breast | IDC | 1.93e-09 | 1.18e-03 | 0.1517 |
| 28958 | COA3 | GSM4909301 | Human | Breast | IDC | 9.29e-15 | 5.22e-01 | 0.1577 |
| 28958 | COA3 | GSM4909306 | Human | Breast | IDC | 1.68e-06 | 4.07e-01 | 0.1564 |
| 28958 | COA3 | GSM4909307 | Human | Breast | IDC | 1.12e-13 | 5.17e-01 | 0.1569 |
| 28958 | COA3 | GSM4909308 | Human | Breast | IDC | 1.29e-19 | 5.49e-01 | 0.158 |
| 28958 | COA3 | GSM4909311 | Human | Breast | IDC | 1.35e-19 | -3.10e-02 | 0.1534 |
| 28958 | COA3 | GSM4909312 | Human | Breast | IDC | 1.30e-08 | 1.53e-01 | 0.1552 |
| 28958 | COA3 | GSM4909313 | Human | Breast | IDC | 3.70e-02 | 8.74e-02 | 0.0391 |
| 28958 | COA3 | GSM4909319 | Human | Breast | IDC | 2.91e-31 | 2.78e-01 | 0.1563 |
| 28958 | COA3 | GSM4909320 | Human | Breast | IDC | 4.18e-08 | 2.97e-01 | 0.1575 |
| 28958 | COA3 | GSM4909321 | Human | Breast | IDC | 4.24e-14 | 3.34e-01 | 0.1559 |
| 28958 | COA3 | brca2 | Human | Breast | Precancer | 9.00e-11 | 3.04e-01 | -0.024 |
| 28958 | COA3 | NCCBC14 | Human | Breast | DCIS | 1.80e-04 | -4.38e-02 | 0.2021 |
| 28958 | COA3 | NCCBC2 | Human | Breast | DCIS | 4.41e-02 | -1.09e-01 | 0.1554 |
| 28958 | COA3 | NCCBC5 | Human | Breast | DCIS | 2.61e-08 | -7.60e-02 | 0.2046 |
| 28958 | COA3 | P1 | Human | Breast | IDC | 1.82e-10 | -2.74e-01 | 0.1527 |
| 28958 | COA3 | P2 | Human | Breast | IDC | 3.14e-02 | 2.21e-01 | 0.21 |
| Page: 1 2 3 4 5 6 7 8 9 10 11 |
| Tissue | Expression Dynamics | Abbreviation |
| Breast |  | IDC: Invasive ductal carcinoma |
| DCIS: Ductal carcinoma in situ | ||
| Precancer(BRCA1-mut): Precancerous lesion from BRCA1 mutation carriers | ||
| Colorectum (GSE201348) |  | FAP: Familial adenomatous polyposis |
| CRC: Colorectal cancer | ||
| Colorectum (HTA11) | 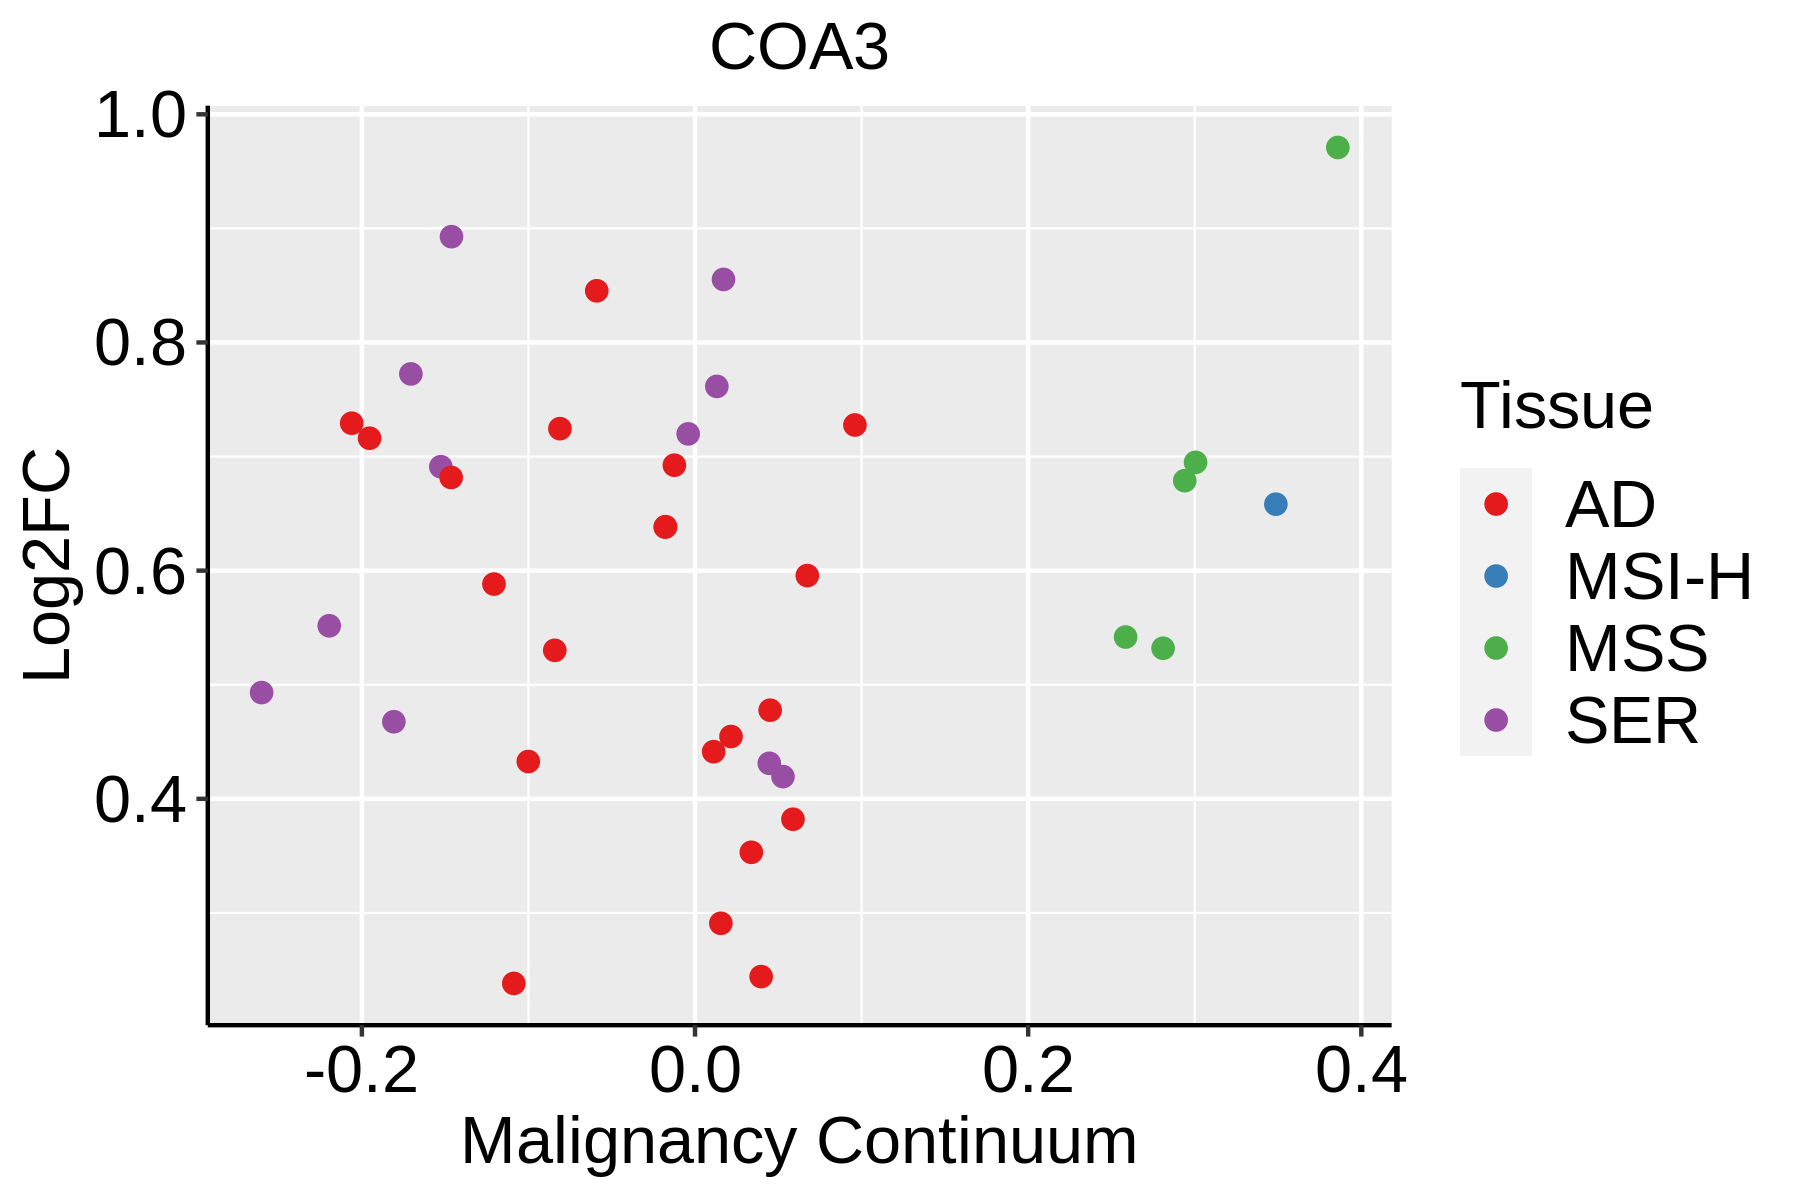 | AD: Adenomas |
| SER: Sessile serrated lesions | ||
| MSI-H: Microsatellite-high colorectal cancer | ||
| MSS: Microsatellite stable colorectal cancer | ||
| Endometrium |  | AEH: Atypical endometrial hyperplasia |
| EEC: Endometrioid Cancer | ||
| Esophagus | 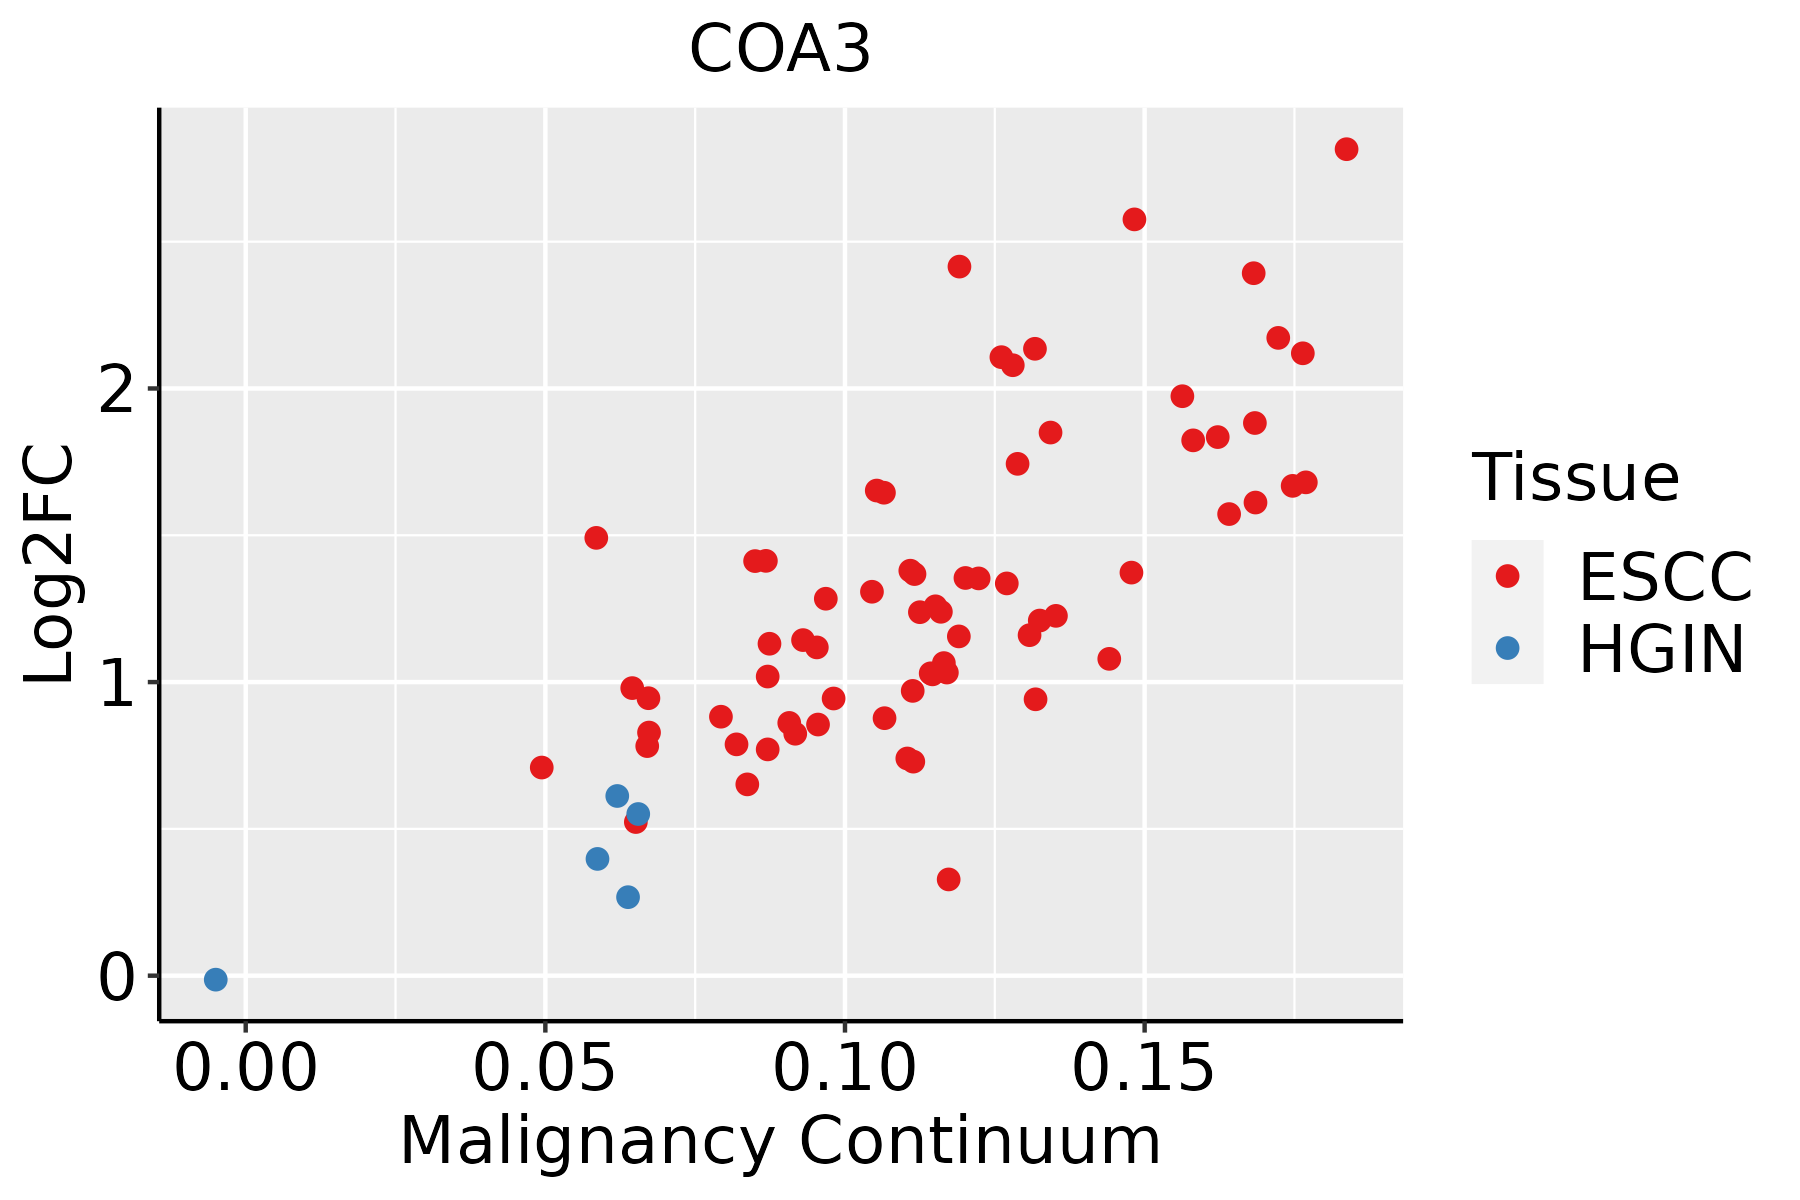 | ESCC: Esophageal squamous cell carcinoma |
| HGIN: High-grade intraepithelial neoplasias | ||
| LGIN: Low-grade intraepithelial neoplasias | ||
| Liver | 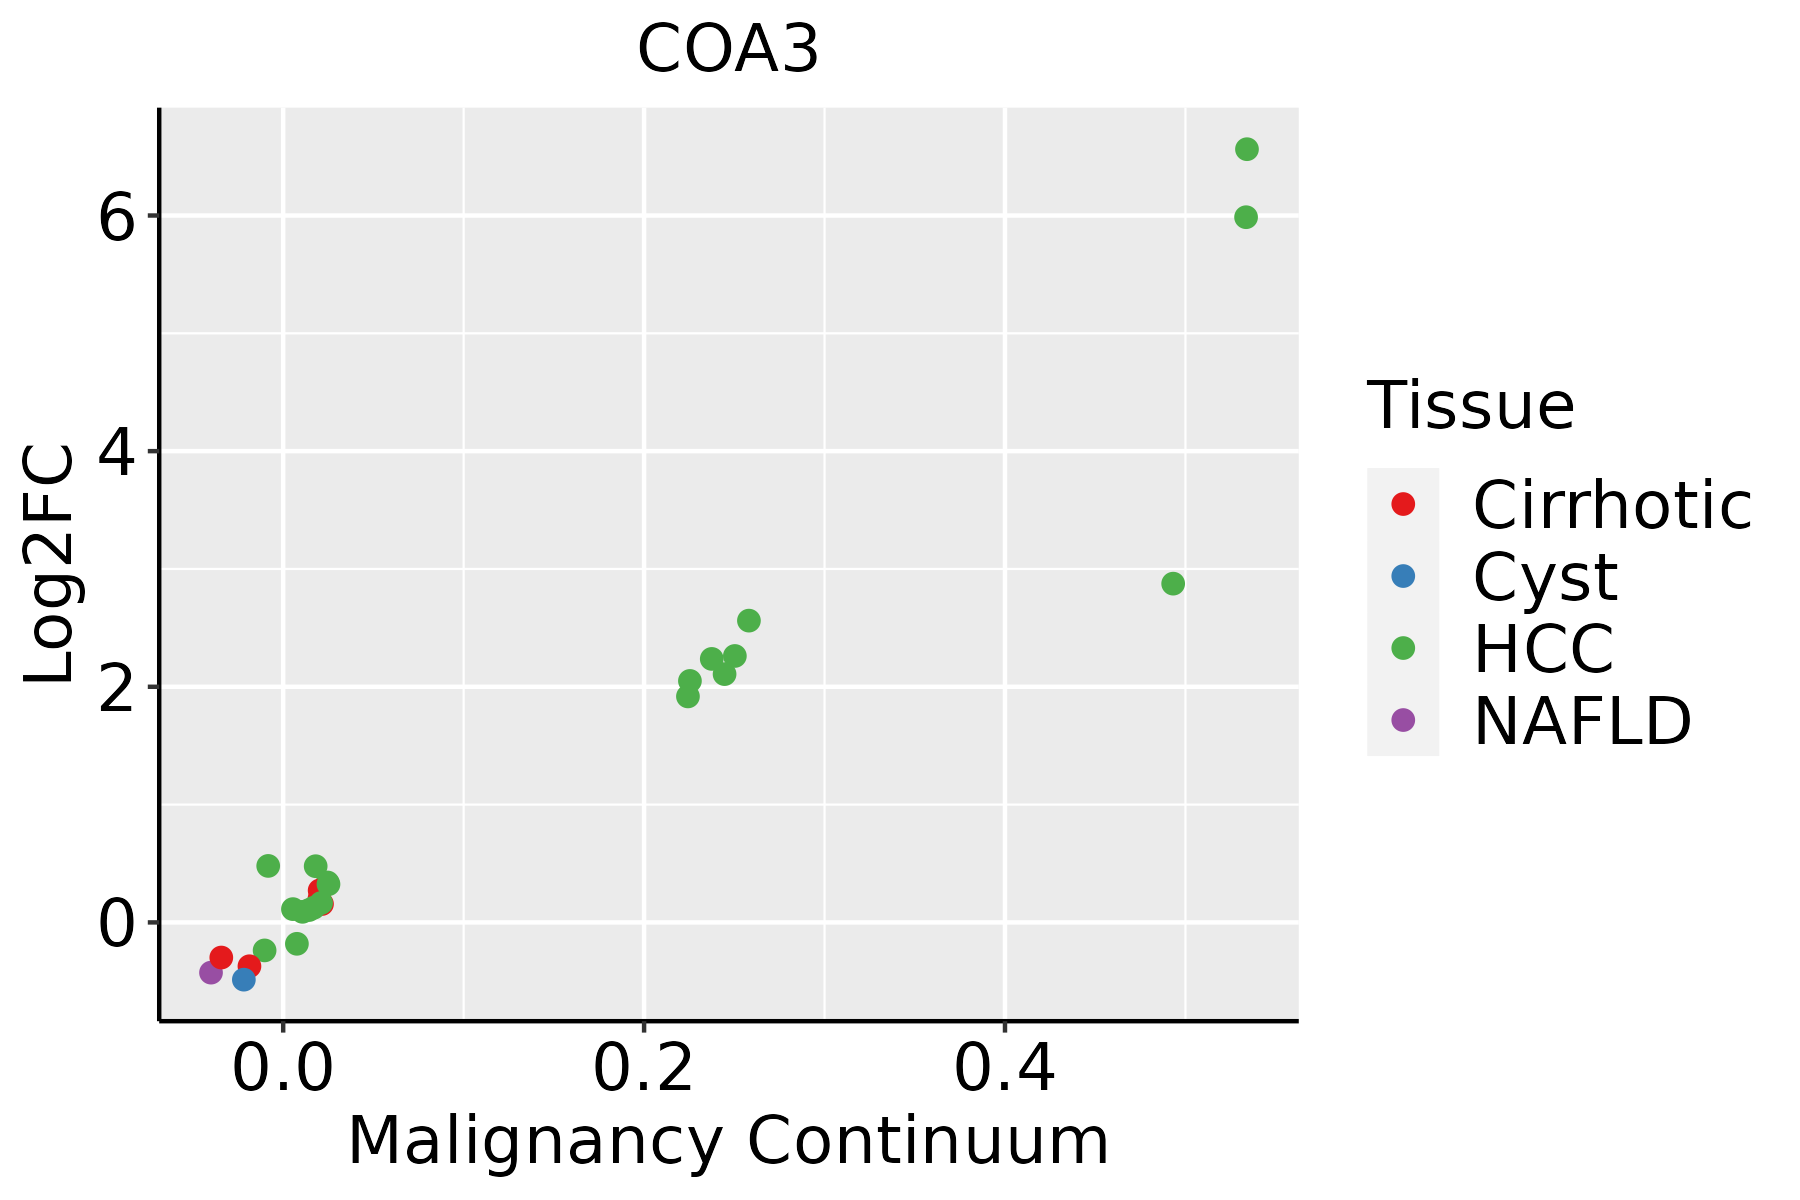 | HCC: Hepatocellular carcinoma |
| NAFLD: Non-alcoholic fatty liver disease | ||
| Oral Cavity |  | EOLP: Erosive Oral lichen planus |
| LP: leukoplakia | ||
| NEOLP: Non-erosive oral lichen planus | ||
| OSCC: Oral squamous cell carcinoma | ||
| Prostate | 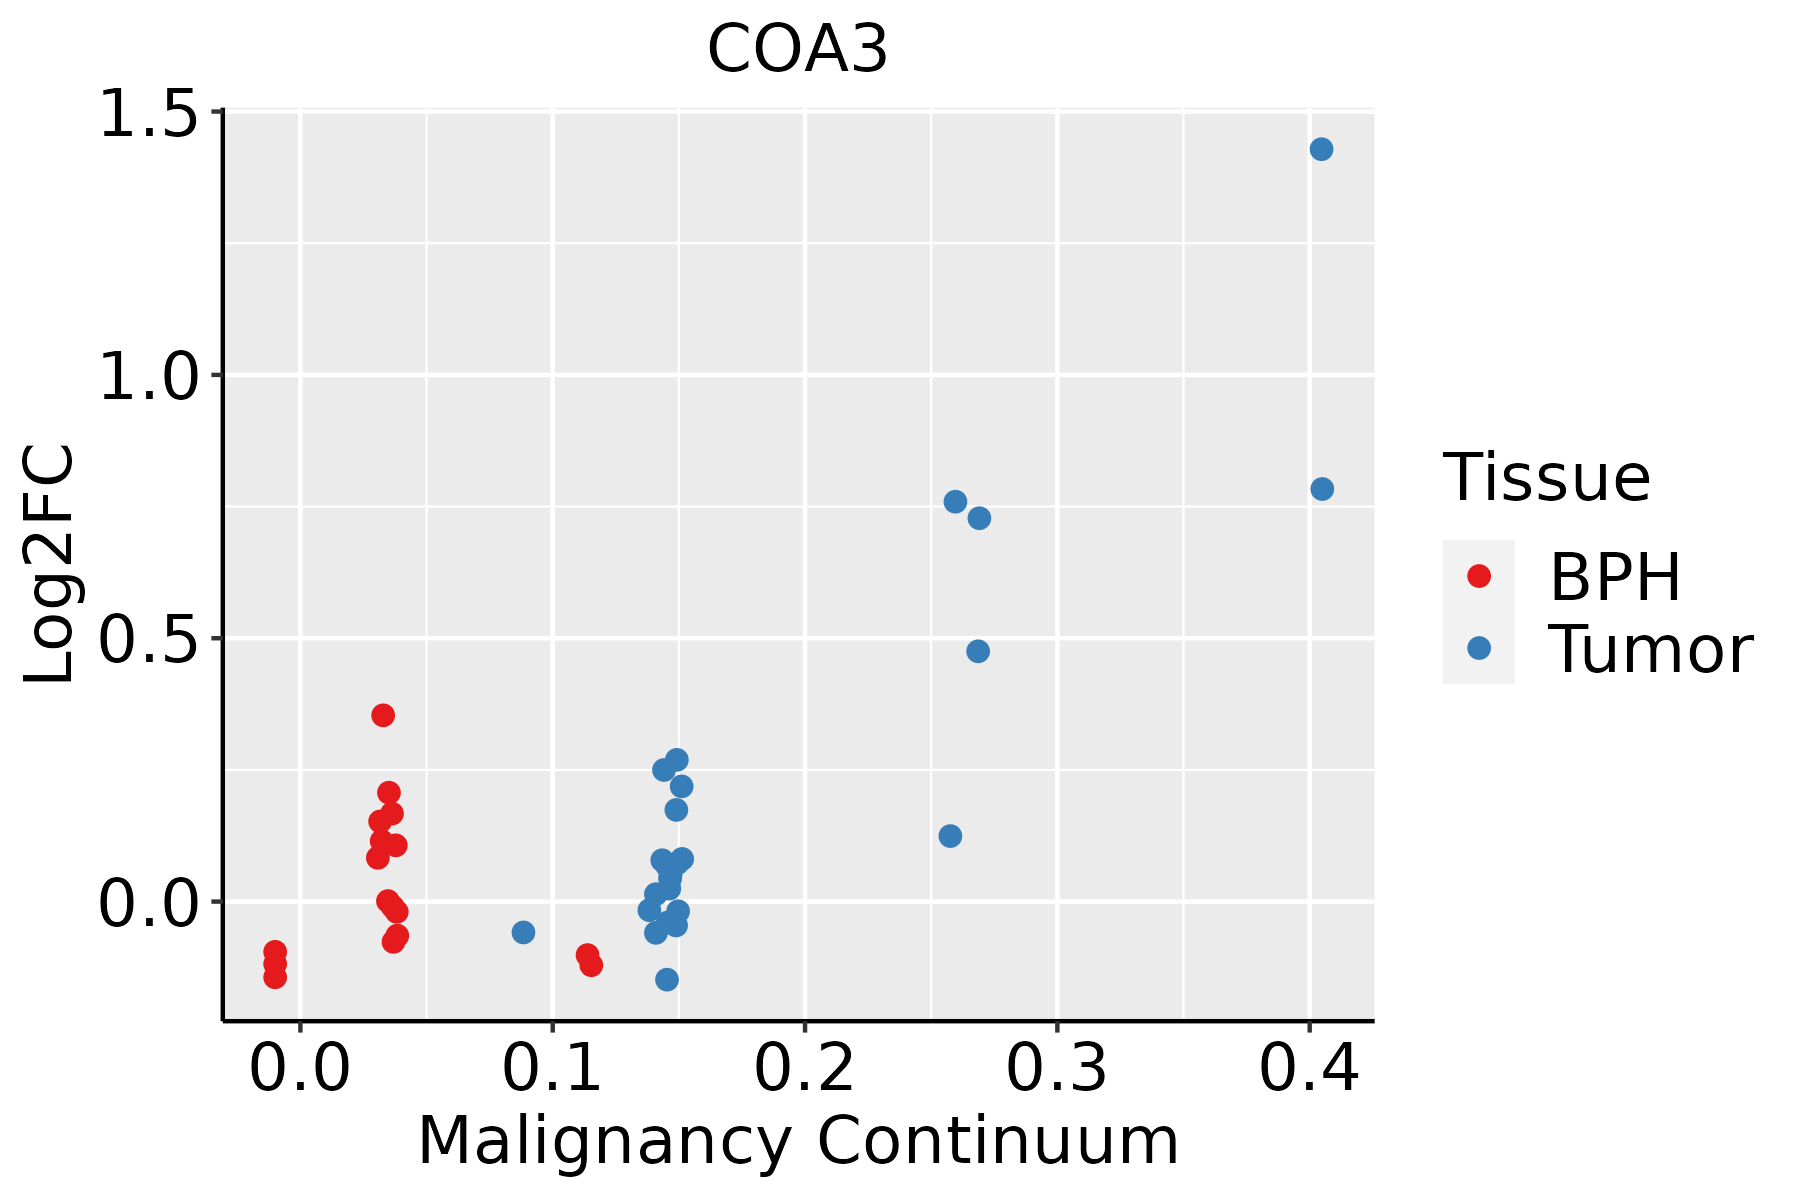 | BPH: Benign Prostatic Hyperplasia |
| Skin | 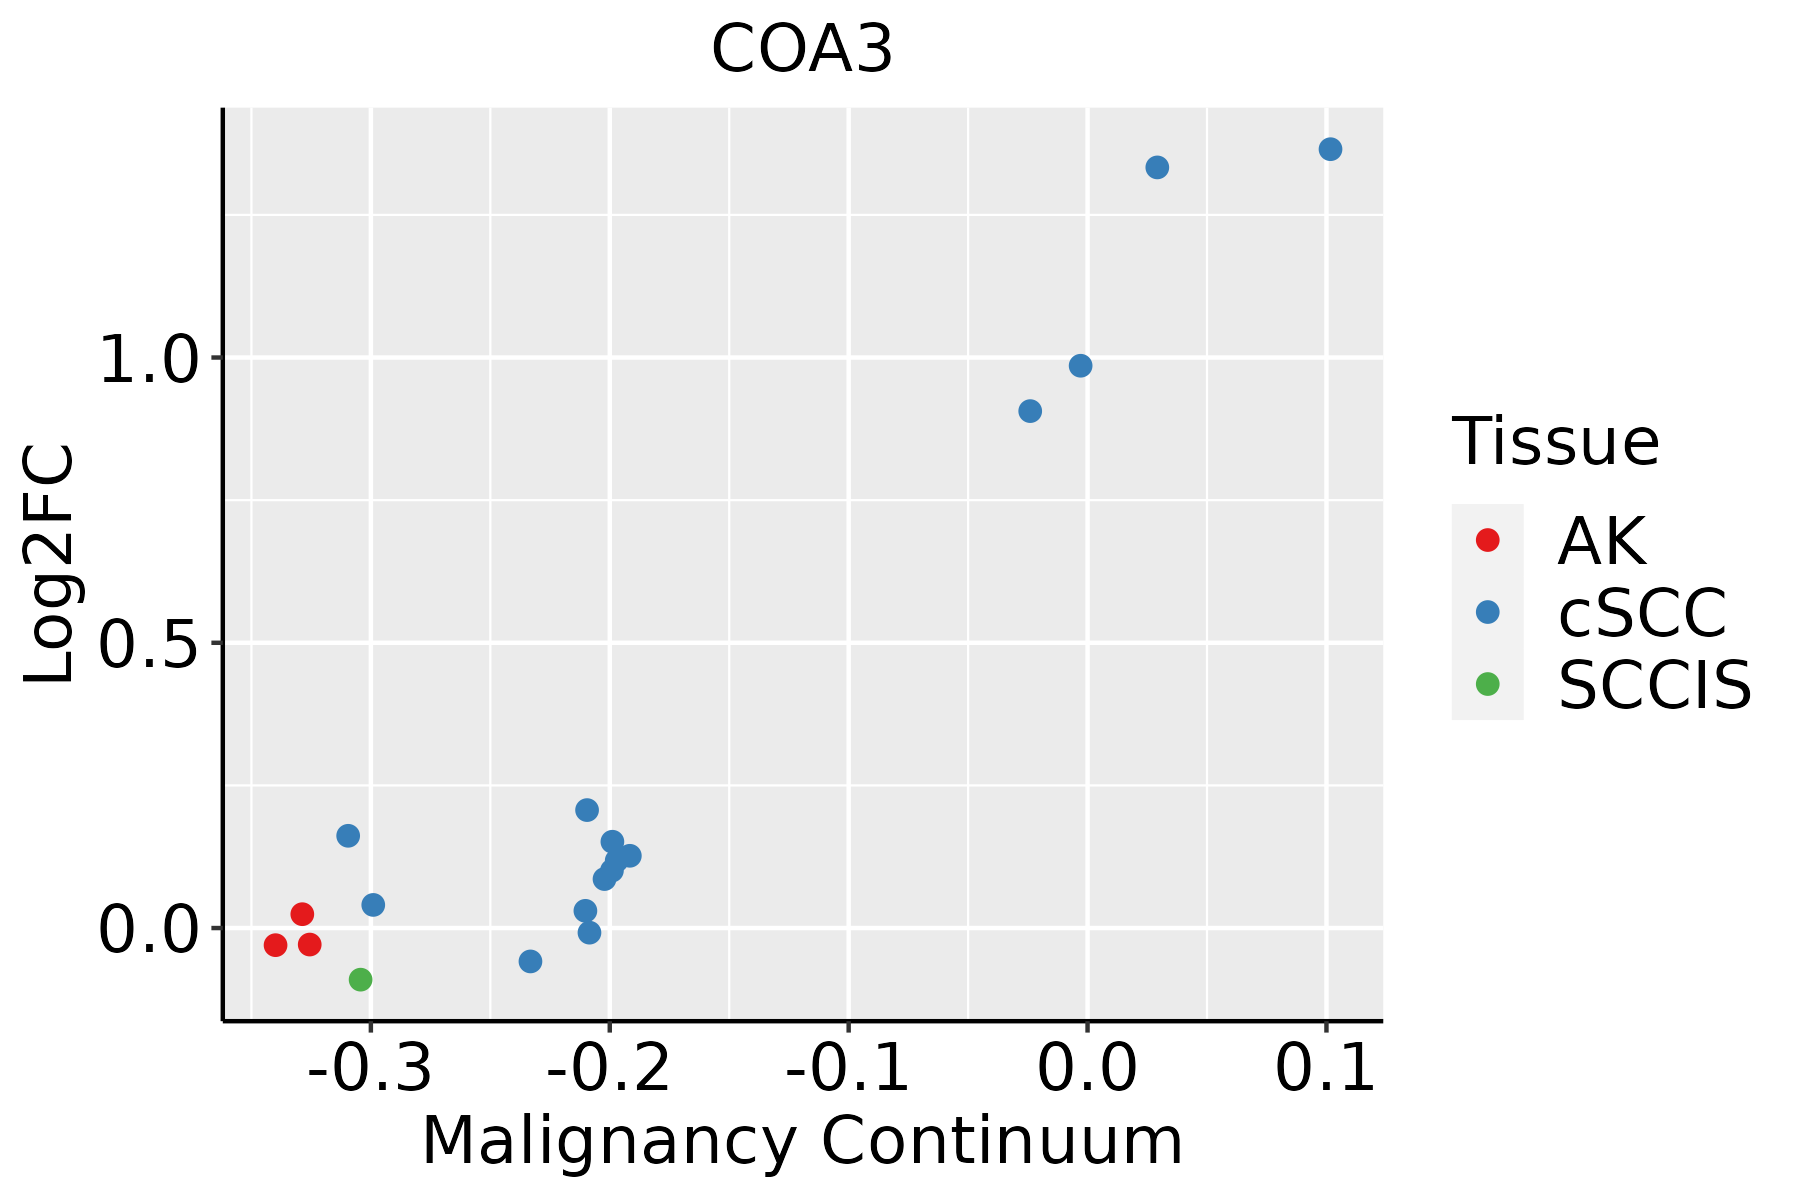 | AK: Actinic keratosis |
| cSCC: Cutaneous squamous cell carcinoma | ||
| SCCIS:squamous cell carcinoma in situ | ||
| Thyroid | 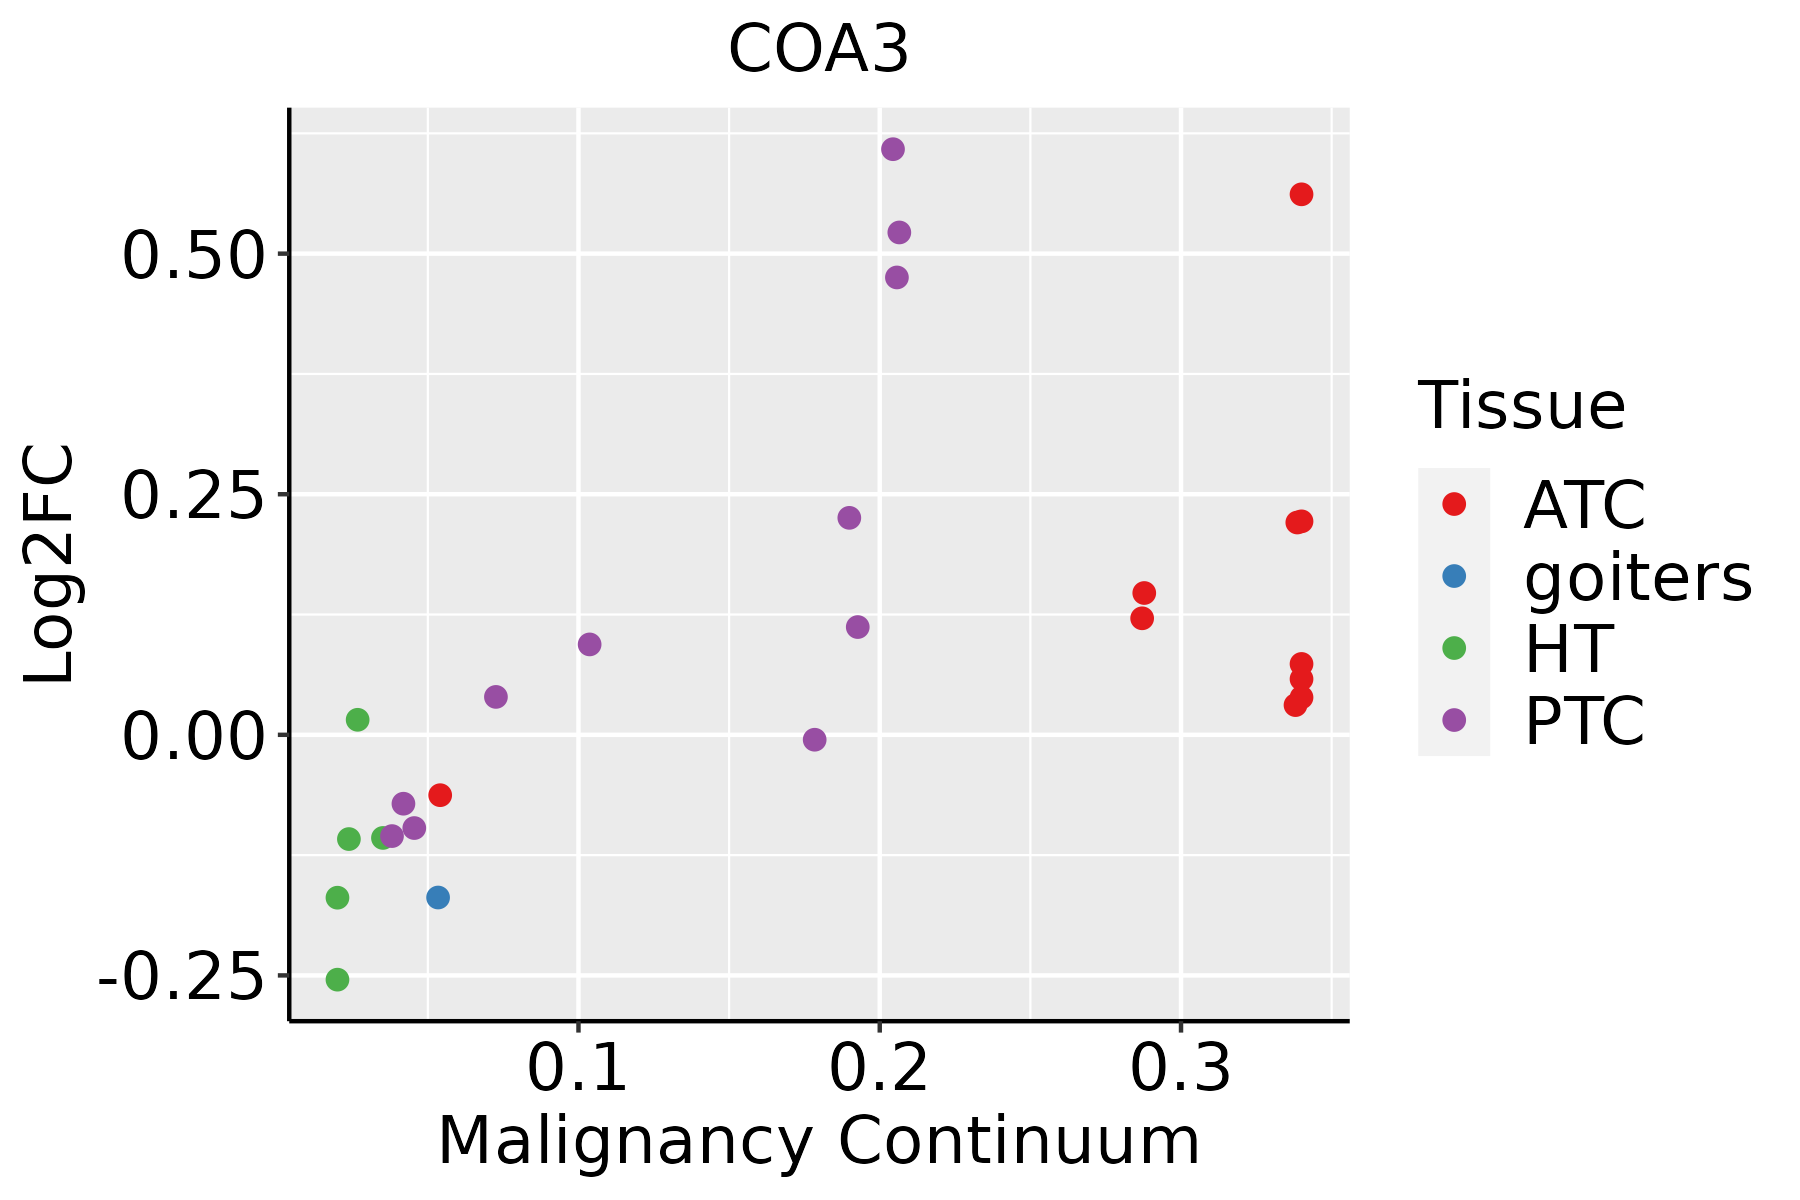 | ATC: Anaplastic thyroid cancer |
| HT: Hashimoto's thyroiditis | ||
| PTC: Papillary thyroid cancer |
| ∗log2FC in expression of this searched gene in stem-like cells from each diseased tissue sample relative to stem-like cells in normal samples in each tissue plotted against the malignancy continuum. Samples are colored based on if they are from different disease stage. |
Top |
Malignant transformation related pathway analysis |
| Find out the enriched GO biological processes and KEGG pathways involved in transition from healthy to precancer to cancer |
| Tissue | Disease Stage | Enriched GO biological Processes |
| Colorectum | AD |  |
| Colorectum | SER |  |
| Colorectum | MSS |  |
| Colorectum | MSI-H |  |
| Colorectum | FAP |  |
| ∗Top 15 enriched GO BP terms are showed in the bar plot of each disease state in each tissue. Each row represents a significant GO biological process which is colored according to the -log10(p.adjust). |
| Page: 1 2 3 4 5 6 7 8 9 |
| GO ID | Tissue | Disease Stage | Description | Gene Ratio | Bg Ratio | pvalue | p.adjust | Count |
| GO:00064179 | Breast | Precancer | regulation of translation | 67/1080 | 468/18723 | 4.71e-12 | 7.64e-10 | 67 |
| GO:00457279 | Breast | Precancer | positive regulation of translation | 32/1080 | 136/18723 | 5.89e-12 | 9.27e-10 | 32 |
| GO:00342509 | Breast | Precancer | positive regulation of cellular amide metabolic process | 33/1080 | 162/18723 | 1.72e-10 | 1.77e-08 | 33 |
| GO:00331088 | Breast | Precancer | mitochondrial respiratory chain complex assembly | 24/1080 | 93/18723 | 3.39e-10 | 3.16e-08 | 24 |
| GO:003310813 | Breast | IDC | mitochondrial respiratory chain complex assembly | 28/1434 | 93/18723 | 1.54e-10 | 1.83e-08 | 28 |
| GO:000641714 | Breast | IDC | regulation of translation | 74/1434 | 468/18723 | 1.67e-09 | 1.53e-07 | 74 |
| GO:004572714 | Breast | IDC | positive regulation of translation | 33/1434 | 136/18723 | 1.92e-09 | 1.73e-07 | 33 |
| GO:003425014 | Breast | IDC | positive regulation of cellular amide metabolic process | 35/1434 | 162/18723 | 1.63e-08 | 1.16e-06 | 35 |
| GO:00325432 | Breast | IDC | mitochondrial translation | 13/1434 | 76/18723 | 4.81e-03 | 3.67e-02 | 13 |
| GO:003310823 | Breast | DCIS | mitochondrial respiratory chain complex assembly | 28/1390 | 93/18723 | 7.50e-11 | 9.43e-09 | 28 |
| GO:000641724 | Breast | DCIS | regulation of translation | 72/1390 | 468/18723 | 2.46e-09 | 2.17e-07 | 72 |
| GO:004572724 | Breast | DCIS | positive regulation of translation | 32/1390 | 136/18723 | 3.56e-09 | 3.10e-07 | 32 |
| GO:003425023 | Breast | DCIS | positive regulation of cellular amide metabolic process | 34/1390 | 162/18723 | 2.60e-08 | 1.73e-06 | 34 |
| GO:003254311 | Breast | DCIS | mitochondrial translation | 13/1390 | 76/18723 | 3.70e-03 | 2.99e-02 | 13 |
| GO:00085446 | Cervix | CC | epidermis development | 83/2311 | 324/18723 | 3.91e-11 | 8.54e-09 | 83 |
| GO:00435884 | Cervix | CC | skin development | 71/2311 | 263/18723 | 8.04e-11 | 1.46e-08 | 71 |
| GO:00302164 | Cervix | CC | keratinocyte differentiation | 42/2311 | 139/18723 | 1.74e-08 | 1.28e-06 | 42 |
| GO:00099137 | Cervix | CC | epidermal cell differentiation | 53/2311 | 202/18723 | 5.48e-08 | 3.25e-06 | 53 |
| GO:00456822 | Cervix | CC | regulation of epidermis development | 22/2311 | 65/18723 | 5.56e-06 | 1.38e-04 | 22 |
| GO:00456042 | Cervix | CC | regulation of epidermal cell differentiation | 20/2311 | 58/18723 | 1.07e-05 | 2.33e-04 | 20 |
| Page: 1 2 3 4 5 6 7 8 9 10 11 12 13 14 15 16 17 18 19 20 21 22 |
| Pathway ID | Tissue | Disease Stage | Description | Gene Ratio | Bg Ratio | pvalue | p.adjust | qvalue | Count |
| hsa0471418 | Breast | Precancer | Thermogenesis | 68/684 | 232/8465 | 4.40e-22 | 1.26e-20 | 9.69e-21 | 68 |
| hsa0471419 | Breast | Precancer | Thermogenesis | 68/684 | 232/8465 | 4.40e-22 | 1.26e-20 | 9.69e-21 | 68 |
| hsa0471424 | Breast | IDC | Thermogenesis | 75/867 | 232/8465 | 8.41e-21 | 3.04e-19 | 2.27e-19 | 75 |
| hsa0471434 | Breast | IDC | Thermogenesis | 75/867 | 232/8465 | 8.41e-21 | 3.04e-19 | 2.27e-19 | 75 |
| hsa0471443 | Breast | DCIS | Thermogenesis | 74/846 | 232/8465 | 8.72e-21 | 3.13e-19 | 2.30e-19 | 74 |
| hsa0471453 | Breast | DCIS | Thermogenesis | 74/846 | 232/8465 | 8.72e-21 | 3.13e-19 | 2.30e-19 | 74 |
| hsa04714 | Colorectum | AD | Thermogenesis | 120/2092 | 232/8465 | 2.76e-19 | 1.16e-17 | 7.37e-18 | 120 |
| hsa047141 | Colorectum | AD | Thermogenesis | 120/2092 | 232/8465 | 2.76e-19 | 1.16e-17 | 7.37e-18 | 120 |
| hsa047142 | Colorectum | SER | Thermogenesis | 106/1580 | 232/8465 | 1.15e-21 | 6.34e-20 | 4.61e-20 | 106 |
| hsa047143 | Colorectum | SER | Thermogenesis | 106/1580 | 232/8465 | 1.15e-21 | 6.34e-20 | 4.61e-20 | 106 |
| hsa047144 | Colorectum | MSS | Thermogenesis | 113/1875 | 232/8465 | 1.52e-19 | 4.62e-18 | 2.83e-18 | 113 |
| hsa047145 | Colorectum | MSS | Thermogenesis | 113/1875 | 232/8465 | 1.52e-19 | 4.62e-18 | 2.83e-18 | 113 |
| hsa047146 | Colorectum | MSI-H | Thermogenesis | 56/797 | 232/8465 | 1.79e-11 | 4.14e-10 | 3.47e-10 | 56 |
| hsa047147 | Colorectum | MSI-H | Thermogenesis | 56/797 | 232/8465 | 1.79e-11 | 4.14e-10 | 3.47e-10 | 56 |
| hsa0471426 | Endometrium | AEH | Thermogenesis | 85/1197 | 232/8465 | 3.44e-18 | 9.33e-17 | 6.83e-17 | 85 |
| hsa04714111 | Endometrium | AEH | Thermogenesis | 85/1197 | 232/8465 | 3.44e-18 | 9.33e-17 | 6.83e-17 | 85 |
| hsa0471427 | Endometrium | EEC | Thermogenesis | 85/1237 | 232/8465 | 2.79e-17 | 7.05e-16 | 5.26e-16 | 85 |
| hsa0471436 | Endometrium | EEC | Thermogenesis | 85/1237 | 232/8465 | 2.79e-17 | 7.05e-16 | 5.26e-16 | 85 |
| hsa0471439 | Esophagus | HGIN | Thermogenesis | 91/1383 | 232/8465 | 1.97e-17 | 5.36e-16 | 4.25e-16 | 91 |
| hsa04714114 | Esophagus | HGIN | Thermogenesis | 91/1383 | 232/8465 | 1.97e-17 | 5.36e-16 | 4.25e-16 | 91 |
| Page: 1 2 |
Top |
Cell-cell communication analysis |
| Identification of potential cell-cell interactions between two cell types and their ligand-receptor pairs for different disease states |
| Ligand | Receptor | LRpair | Pathway | Tissue | Disease Stage |
| Page: 1 |
Top |
Single-cell gene regulatory network inference analysis |
| Find out the significant the regulons (TFs) and the target genes of each regulon across cell types for different disease states |
| TF | Cell Type | Tissue | Disease Stage | Target Gene | RSS | Regulon Activity |
| ∗The dot plots of a searched regulon are shown for all cell subpopulations in each disease state of each tissue based on the regulon specific score inferred using pySCENIC and by calculating the average expression. |
| Page: 1 |
Top |
Somatic mutation of malignant transformation related genes |
| Annotation of somatic variants for genes involved in malignant transformation |
| Hugo Symbol | Variant Class | Variant Classification | dbSNP RS | HGVSc | HGVSp | HGVSp Short | SWISSPROT | BIOTYPE | SIFT | PolyPhen | Tumor Sample Barcode | Tissue | Histology | Sex | Age | Stage | Therapy Types | Drugs | Outcome |
| COA3 | SNV | Missense_Mutation | novel | c.31G>C | p.Asp11His | p.D11H | Q9Y2R0 | protein_coding | deleterious_low_confidence(0.02) | possibly_damaging(0.771) | TCGA-JW-A5VL-01 | Cervix | cervical & endocervical cancer | Female | <65 | I/II | Unknown | Unknown | SD |
| COA3 | SNV | Missense_Mutation | novel | c.4N>A | p.Ala2Thr | p.A2T | Q9Y2R0 | protein_coding | deleterious_low_confidence(0.01) | benign(0.047) | TCGA-AJ-A3EL-01 | Endometrium | uterine corpus endometrioid carcinoma | Female | <65 | I/II | Unknown | Unknown | SD |
| COA3 | SNV | Missense_Mutation | novel | c.35N>A | p.Ser12Tyr | p.S12Y | Q9Y2R0 | protein_coding | deleterious_low_confidence(0.04) | benign(0.12) | TCGA-EO-A22X-01 | Endometrium | uterine corpus endometrioid carcinoma | Female | <65 | III/IV | Unspecific | Carboplatin | Complete Response |
| COA3 | SNV | Missense_Mutation | novel | c.61N>G | p.Gln21Glu | p.Q21E | Q9Y2R0 | protein_coding | tolerated(0.22) | benign(0.138) | TCGA-58-8393-01 | Lung | lung squamous cell carcinoma | Female | >=65 | I/II | Unknown | Unknown | SD |
| Page: 1 |
Top |
Related drugs of malignant transformation related genes |
| Identification of chemicals and drugs interact with genes involved in malignant transfromation |
| (DGIdb 4.0) |
| Entrez ID | Symbol | Category | Interaction Types | Drug Claim Name | Drug Name | PMIDs |
| Page: 1 |

Copyright 2023-Present -The University of Texas Health Science Center at Houston |