
|
|||||
|
 | |
| |
| |
| |
| |
| |
|
Gene: CNTRL |
Gene summary for CNTRL |
| Gene information | Species | Human | Gene symbol | CNTRL | Gene ID | 11064 |
| Gene name | centriolin | |
| Gene Alias | CEP1 | |
| Cytomap | 9q33.2 | |
| Gene Type | protein-coding | GO ID | GO:0001568 | UniProtAcc | B2RP65 |
Top |
Malignant transformation analysis |
| Identification of the aberrant gene expression in precancerous and cancerous lesions by comparing the gene expression of stem-like cells in diseased tissues with normal stem cells |
| Entrez ID | Symbol | Replicates | Species | Organ | Tissue | Adj P-value | Log2FC | Malignancy |
| 11064 | CNTRL | C21 | Human | Oral cavity | OSCC | 8.28e-06 | 2.07e-01 | 0.2678 |
| 11064 | CNTRL | C30 | Human | Oral cavity | OSCC | 9.16e-13 | 5.45e-01 | 0.3055 |
| 11064 | CNTRL | C38 | Human | Oral cavity | OSCC | 3.56e-06 | 5.67e-01 | 0.172 |
| 11064 | CNTRL | C43 | Human | Oral cavity | OSCC | 2.36e-07 | 4.91e-02 | 0.1704 |
| 11064 | CNTRL | C46 | Human | Oral cavity | OSCC | 3.05e-12 | 1.70e-01 | 0.1673 |
| 11064 | CNTRL | C08 | Human | Oral cavity | OSCC | 1.16e-06 | 1.01e-01 | 0.1919 |
| 11064 | CNTRL | EOLP-1 | Human | Oral cavity | EOLP | 4.35e-15 | 3.02e-01 | -0.0202 |
| 11064 | CNTRL | NEOLP-2 | Human | Oral cavity | NEOLP | 2.50e-04 | 1.47e-01 | -0.0196 |
| 11064 | CNTRL | NEOLP-3 | Human | Oral cavity | NEOLP | 3.87e-03 | 1.50e-01 | -0.0191 |
| 11064 | CNTRL | SYSMH1 | Human | Oral cavity | OSCC | 2.53e-07 | 1.07e-01 | 0.1127 |
| 11064 | CNTRL | SYSMH2 | Human | Oral cavity | OSCC | 1.45e-08 | 2.13e-01 | 0.2326 |
| 11064 | CNTRL | SYSMH3 | Human | Oral cavity | OSCC | 3.86e-09 | 1.82e-01 | 0.2442 |
| 11064 | CNTRL | HTA12-23-1 | Human | Pancreas | PDAC | 4.22e-05 | 6.43e-01 | 0.3405 |
| 11064 | CNTRL | HTA12-26-1 | Human | Pancreas | PDAC | 2.53e-09 | 5.90e-01 | 0.3728 |
| 11064 | CNTRL | HTA12-29-1 | Human | Pancreas | PDAC | 4.91e-14 | 4.19e-01 | 0.3722 |
| 11064 | CNTRL | GSM5252126_BPH283PrGF_Via | Human | Prostate | BPH | 1.42e-07 | 5.46e-02 | -0.1771 |
| 11064 | CNTRL | GSM5252131_BPH340PrSF_Via | Human | Prostate | BPH | 1.70e-02 | 2.03e-02 | -0.2126 |
| 11064 | CNTRL | 048752_1579-all-cells | Human | Prostate | BPH | 7.72e-04 | 1.79e-01 | 0.1008 |
| 11064 | CNTRL | 052095_1628-all-cells | Human | Prostate | BPH | 7.08e-04 | 1.84e-01 | 0.1032 |
| 11064 | CNTRL | Dong_P1 | Human | Prostate | Tumor | 1.00e-10 | 4.13e-02 | 0.035 |
| Page: 1 2 3 |
| Tissue | Expression Dynamics | Abbreviation |
| Oral Cavity | 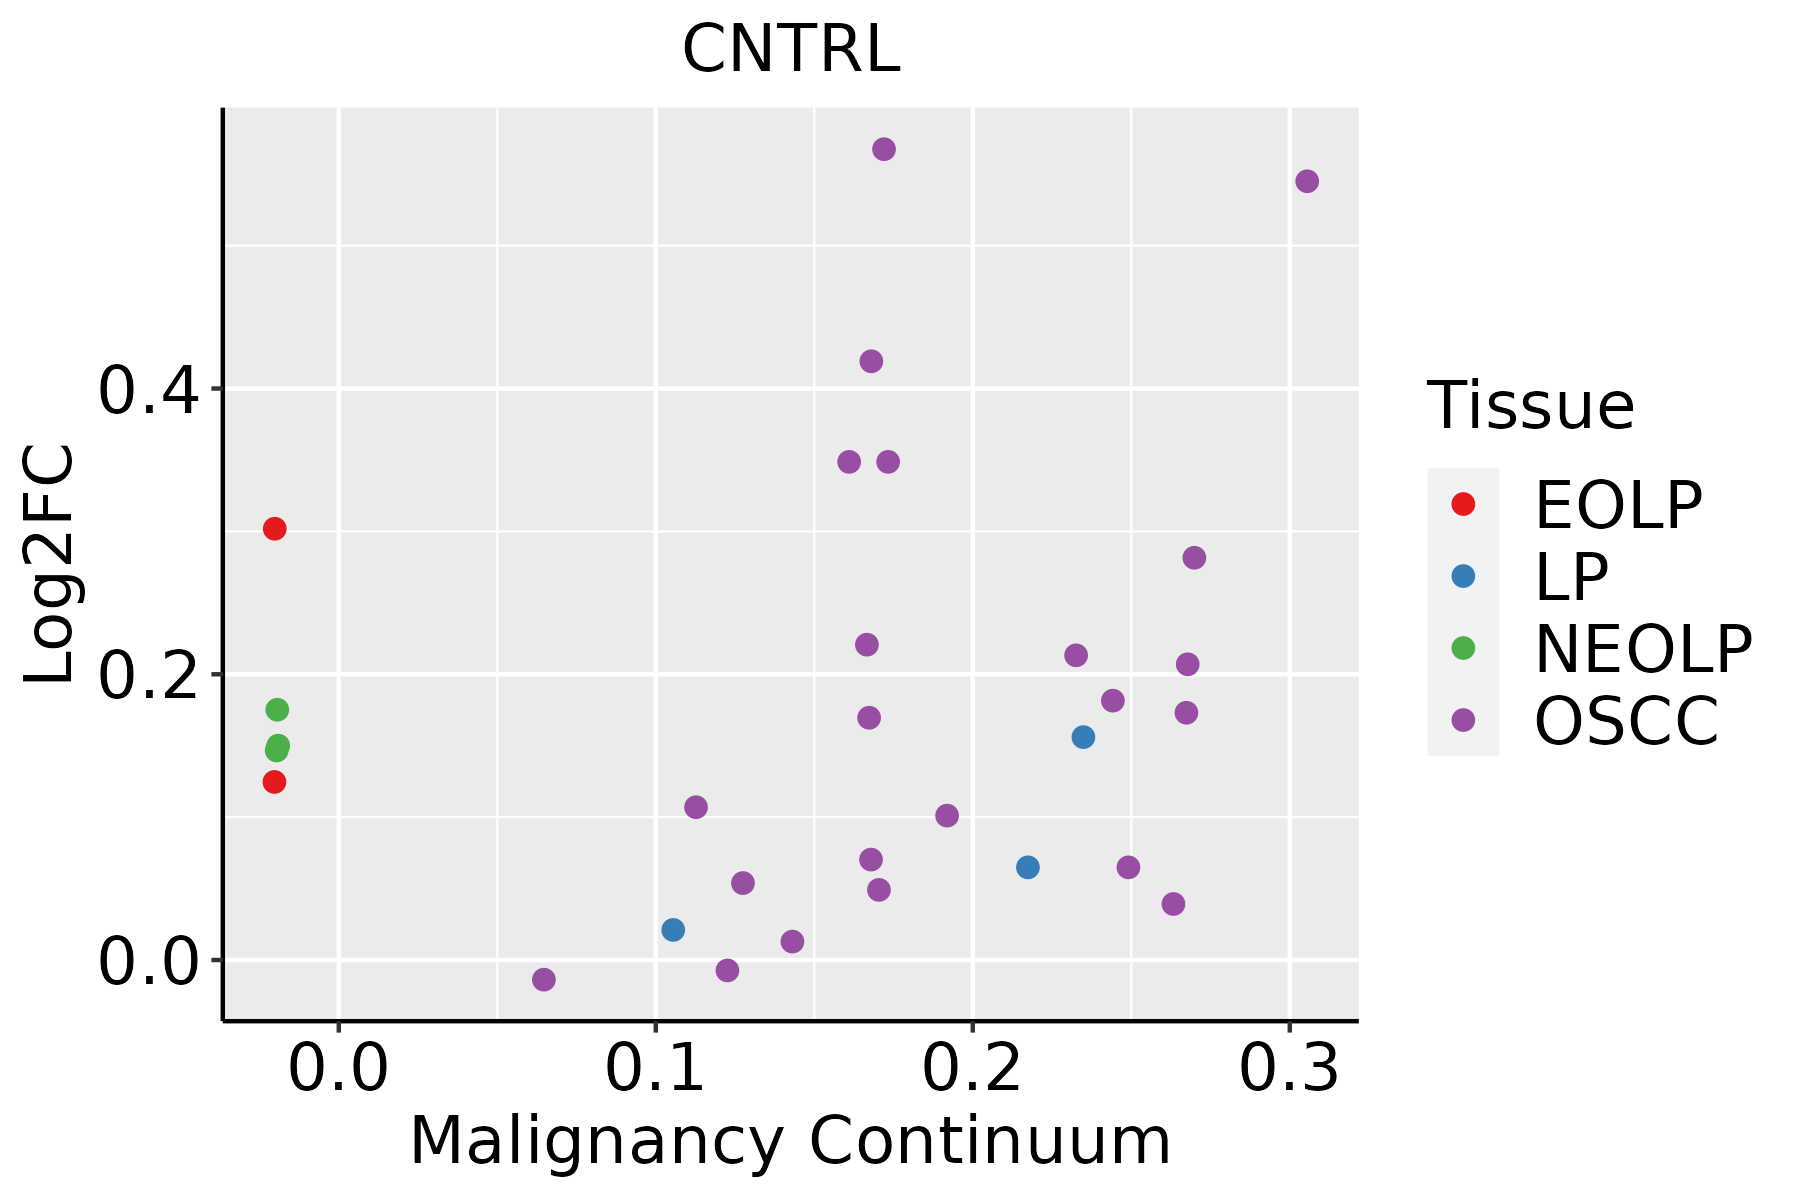 | EOLP: Erosive Oral lichen planus |
| LP: leukoplakia | ||
| NEOLP: Non-erosive oral lichen planus | ||
| OSCC: Oral squamous cell carcinoma | ||
| Prostate |  | BPH: Benign Prostatic Hyperplasia |
| Skin |  | AK: Actinic keratosis |
| cSCC: Cutaneous squamous cell carcinoma | ||
| SCCIS:squamous cell carcinoma in situ | ||
| Thyroid | 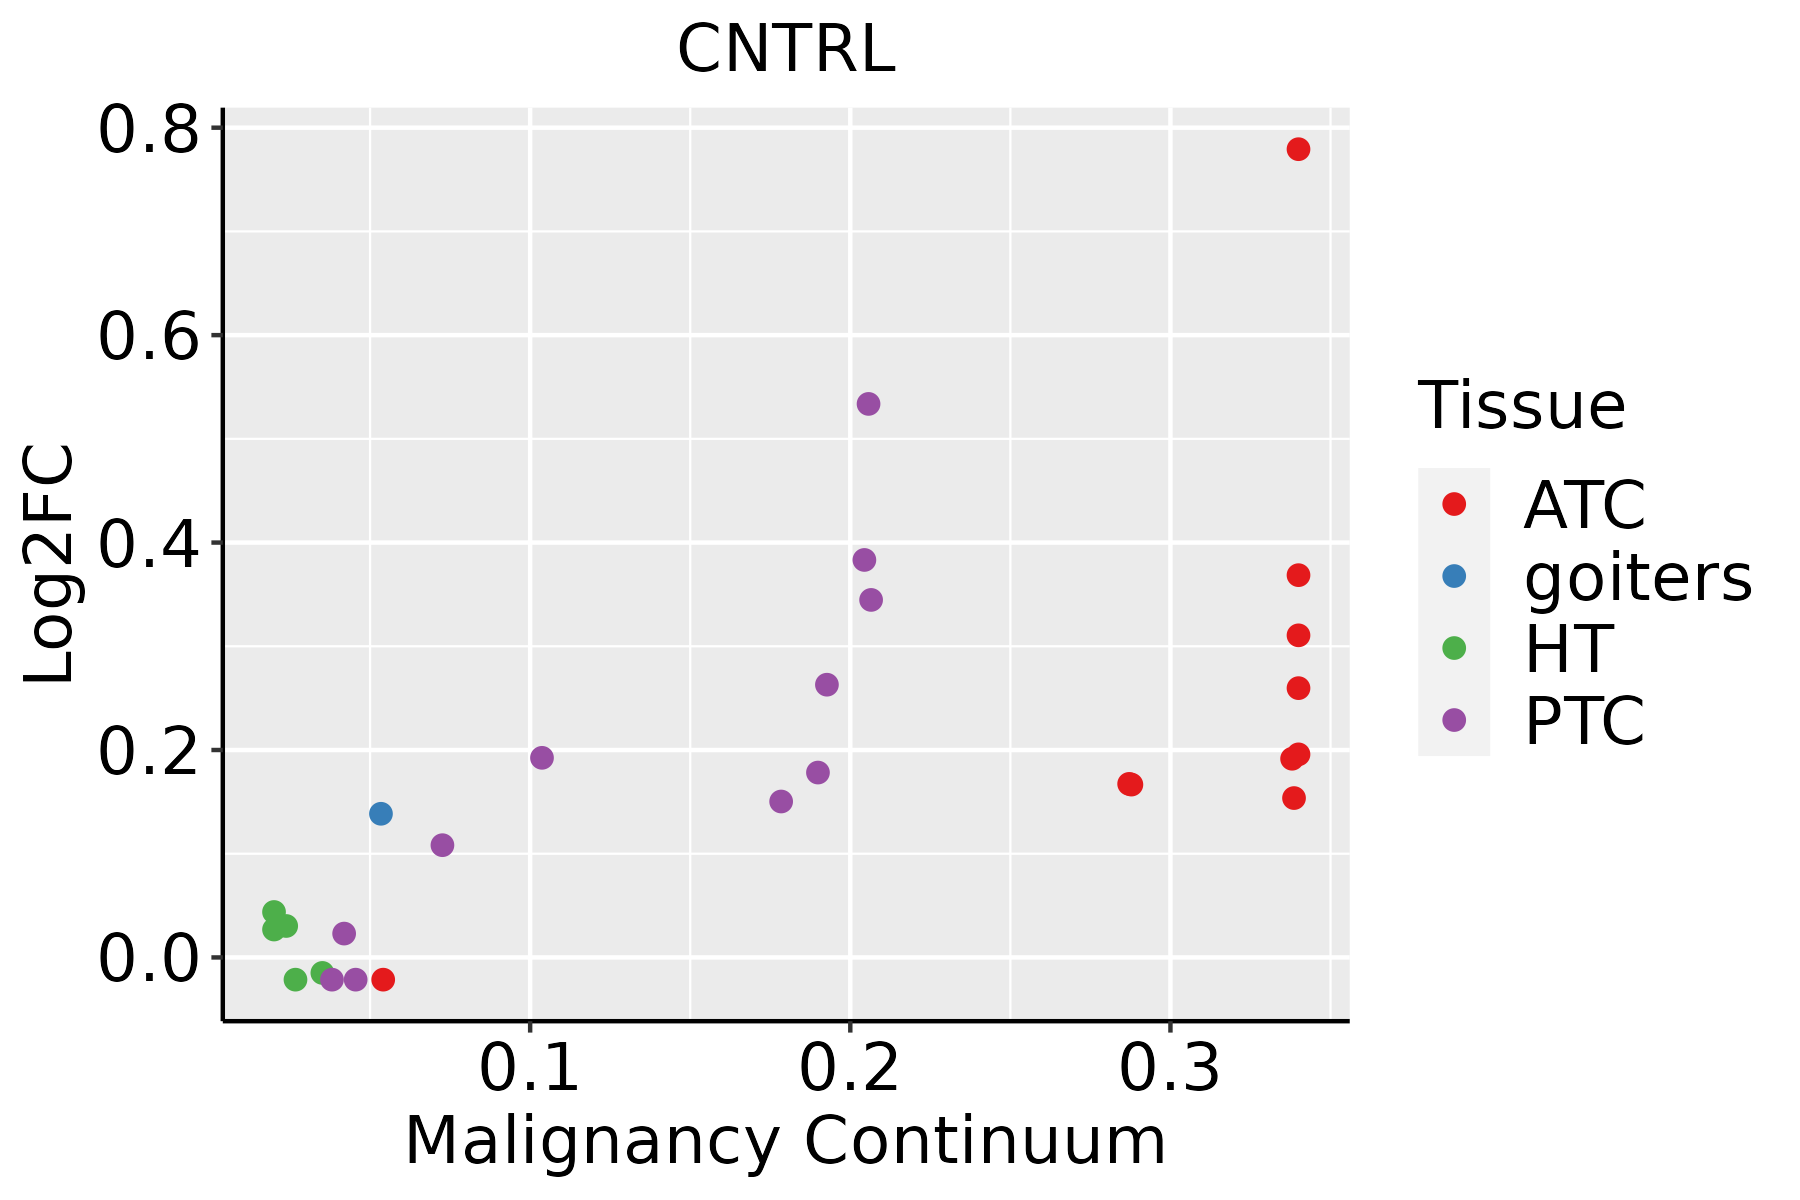 | ATC: Anaplastic thyroid cancer |
| HT: Hashimoto's thyroiditis | ||
| PTC: Papillary thyroid cancer |
| ∗log2FC in expression of this searched gene in stem-like cells from each diseased tissue sample relative to stem-like cells in normal samples in each tissue plotted against the malignancy continuum. Samples are colored based on if they are from different disease stage. |
Top |
Malignant transformation related pathway analysis |
| Find out the enriched GO biological processes and KEGG pathways involved in transition from healthy to precancer to cancer |
| Tissue | Disease Stage | Enriched GO biological Processes |
| Colorectum | AD |  |
| Colorectum | SER |  |
| Colorectum | MSS |  |
| Colorectum | MSI-H |  |
| Colorectum | FAP |  |
| ∗Top 15 enriched GO BP terms are showed in the bar plot of each disease state in each tissue. Each row represents a significant GO biological process which is colored according to the -log10(p.adjust). |
| Page: 1 2 3 4 5 6 7 8 9 |
| GO ID | Tissue | Disease Stage | Description | Gene Ratio | Bg Ratio | pvalue | p.adjust | Count |
| GO:00016558 | Oral cavity | OSCC | urogenital system development | 160/7305 | 338/18723 | 1.03e-03 | 5.31e-03 | 160 |
| GO:000165514 | Oral cavity | NEOLP | urogenital system development | 58/2005 | 338/18723 | 1.97e-04 | 2.13e-03 | 58 |
| GO:00032312 | Oral cavity | NEOLP | cardiac ventricle development | 27/2005 | 123/18723 | 2.14e-04 | 2.27e-03 | 27 |
| GO:0060840 | Oral cavity | NEOLP | artery development | 23/2005 | 100/18723 | 3.00e-04 | 2.97e-03 | 23 |
| GO:00032814 | Oral cavity | NEOLP | ventricular septum development | 17/2005 | 71/18723 | 1.10e-03 | 8.28e-03 | 17 |
| GO:00032053 | Oral cavity | NEOLP | cardiac chamber development | 30/2005 | 161/18723 | 1.78e-03 | 1.22e-02 | 30 |
| GO:00720017 | Oral cavity | NEOLP | renal system development | 47/2005 | 302/18723 | 5.60e-03 | 2.97e-02 | 47 |
| GO:00032793 | Oral cavity | NEOLP | cardiac septum development | 20/2005 | 103/18723 | 6.01e-03 | 3.13e-02 | 20 |
| GO:00018226 | Oral cavity | NEOLP | kidney development | 45/2005 | 293/18723 | 8.36e-03 | 4.08e-02 | 45 |
| GO:00016557 | Prostate | BPH | urogenital system development | 88/3107 | 338/18723 | 6.05e-06 | 8.83e-05 | 88 |
| GO:00720016 | Prostate | BPH | renal system development | 76/3107 | 302/18723 | 8.55e-05 | 8.09e-04 | 76 |
| GO:00018225 | Prostate | BPH | kidney development | 74/3107 | 293/18723 | 9.31e-05 | 8.76e-04 | 74 |
| GO:00032813 | Prostate | BPH | ventricular septum development | 23/3107 | 71/18723 | 7.95e-04 | 5.21e-03 | 23 |
| GO:0003231 | Prostate | BPH | cardiac ventricle development | 34/3107 | 123/18723 | 1.37e-03 | 8.20e-03 | 34 |
| GO:00032792 | Prostate | BPH | cardiac septum development | 29/3107 | 103/18723 | 2.20e-03 | 1.22e-02 | 29 |
| GO:00032052 | Prostate | BPH | cardiac chamber development | 41/3107 | 161/18723 | 2.63e-03 | 1.41e-02 | 41 |
| GO:000165513 | Prostate | Tumor | urogenital system development | 90/3246 | 338/18723 | 1.08e-05 | 1.56e-04 | 90 |
| GO:000182213 | Prostate | Tumor | kidney development | 74/3246 | 293/18723 | 3.68e-04 | 2.87e-03 | 74 |
| GO:007200113 | Prostate | Tumor | renal system development | 75/3246 | 302/18723 | 5.74e-04 | 4.13e-03 | 75 |
| GO:00032311 | Prostate | Tumor | cardiac ventricle development | 36/3246 | 123/18723 | 7.31e-04 | 5.08e-03 | 36 |
| Page: 1 2 3 |
| Pathway ID | Tissue | Disease Stage | Description | Gene Ratio | Bg Ratio | pvalue | p.adjust | qvalue | Count |
| Page: 1 |
Top |
Cell-cell communication analysis |
| Identification of potential cell-cell interactions between two cell types and their ligand-receptor pairs for different disease states |
| Ligand | Receptor | LRpair | Pathway | Tissue | Disease Stage |
| Page: 1 |
Top |
Single-cell gene regulatory network inference analysis |
| Find out the significant the regulons (TFs) and the target genes of each regulon across cell types for different disease states |
| TF | Cell Type | Tissue | Disease Stage | Target Gene | RSS | Regulon Activity |
| ∗The dot plots of a searched regulon are shown for all cell subpopulations in each disease state of each tissue based on the regulon specific score inferred using pySCENIC and by calculating the average expression. |
| Page: 1 |
Top |
Somatic mutation of malignant transformation related genes |
| Annotation of somatic variants for genes involved in malignant transformation |
| Hugo Symbol | Variant Class | Variant Classification | dbSNP RS | HGVSc | HGVSp | HGVSp Short | SWISSPROT | BIOTYPE | SIFT | PolyPhen | Tumor Sample Barcode | Tissue | Histology | Sex | Age | Stage | Therapy Types | Drugs | Outcome |
| CNTRL | SNV | Missense_Mutation | novel | c.3655N>A | p.Asp1219Asn | p.D1219N | Q7Z7A1 | protein_coding | tolerated(0.24) | benign(0.321) | TCGA-A2-A0CR-01 | Breast | breast invasive carcinoma | Female | <65 | I/II | Chemotherapy | adriamycin | CR |
| CNTRL | SNV | Missense_Mutation | novel | c.728A>C | p.His243Pro | p.H243P | Q7Z7A1 | protein_coding | deleterious(0) | probably_damaging(0.994) | TCGA-A2-A1G0-01 | Breast | breast invasive carcinoma | Female | <65 | I/II | Chemotherapy | taxotere | SD |
| CNTRL | SNV | Missense_Mutation | novel | c.728A>C | p.His243Pro | p.H243P | Q7Z7A1 | protein_coding | deleterious(0) | probably_damaging(0.994) | TCGA-A7-A26G-01 | Breast | breast invasive carcinoma | Female | <65 | I/II | Chemotherapy | taxotere | SD |
| CNTRL | SNV | Missense_Mutation | rs776657382 | c.487N>A | p.Glu163Lys | p.E163K | Q7Z7A1 | protein_coding | deleterious(0) | possibly_damaging(0.763) | TCGA-AC-A23H-01 | Breast | breast invasive carcinoma | Female | >=65 | I/II | Unknown | Unknown | PD |
| CNTRL | SNV | Missense_Mutation | c.1390N>A | p.Glu464Lys | p.E464K | Q7Z7A1 | protein_coding | deleterious(0) | probably_damaging(0.985) | TCGA-AC-A23H-01 | Breast | breast invasive carcinoma | Female | >=65 | I/II | Unknown | Unknown | PD | |
| CNTRL | SNV | Missense_Mutation | c.1681N>C | p.Glu561Gln | p.E561Q | Q7Z7A1 | protein_coding | deleterious(0.01) | probably_damaging(0.994) | TCGA-AC-A23H-01 | Breast | breast invasive carcinoma | Female | >=65 | I/II | Unknown | Unknown | PD | |
| CNTRL | SNV | Missense_Mutation | novel | c.665N>A | p.Ser222Tyr | p.S222Y | Q7Z7A1 | protein_coding | deleterious(0) | possibly_damaging(0.692) | TCGA-AN-A046-01 | Breast | breast invasive carcinoma | Female | >=65 | I/II | Unknown | Unknown | SD |
| CNTRL | SNV | Missense_Mutation | novel | c.4982N>C | p.Val1661Ala | p.V1661A | Q7Z7A1 | protein_coding | tolerated(0.66) | benign(0.014) | TCGA-AN-A046-01 | Breast | breast invasive carcinoma | Female | >=65 | I/II | Unknown | Unknown | SD |
| CNTRL | SNV | Missense_Mutation | c.6775N>G | p.Gln2259Glu | p.Q2259E | Q7Z7A1 | protein_coding | deleterious(0) | benign(0.097) | TCGA-AO-A124-01 | Breast | breast invasive carcinoma | Female | <65 | I/II | Chemotherapy | doxorubicin | SD | |
| CNTRL | SNV | Missense_Mutation | rs141853553 | c.6697N>T | p.Arg2233Cys | p.R2233C | Q7Z7A1 | protein_coding | deleterious(0) | probably_damaging(0.959) | TCGA-B6-A0I2-01 | Breast | breast invasive carcinoma | Female | <65 | I/II | Unknown | Unknown | SD |
| Page: 1 2 3 4 5 6 7 8 9 10 11 12 13 14 15 16 17 18 19 |
Top |
Related drugs of malignant transformation related genes |
| Identification of chemicals and drugs interact with genes involved in malignant transfromation |
| (DGIdb 4.0) |
| Entrez ID | Symbol | Category | Interaction Types | Drug Claim Name | Drug Name | PMIDs |
| Page: 1 |

Copyright 2023-Present -The University of Texas Health Science Center at Houston |