
|
|||||
|
 | |
| |
| |
| |
| |
| |
|
Gene: CNTNAP3 |
Gene summary for CNTNAP3 |
| Gene information | Species | Human | Gene symbol | CNTNAP3 | Gene ID | 79937 |
| Gene name | contactin associated protein family member 3 | |
| Gene Alias | CASPR3 | |
| Cytomap | 9p12 | |
| Gene Type | protein-coding | GO ID | GO:0007155 | UniProtAcc | Q9BZ76 |
Top |
Malignant transformation analysis |
| Identification of the aberrant gene expression in precancerous and cancerous lesions by comparing the gene expression of stem-like cells in diseased tissues with normal stem cells |
| Entrez ID | Symbol | Replicates | Species | Organ | Tissue | Adj P-value | Log2FC | Malignancy |
| 79937 | CNTNAP3 | P4_S8_cSCC | Human | Skin | cSCC | 3.72e-14 | 2.62e-01 | -0.3095 |
| 79937 | CNTNAP3 | P1_cSCC | Human | Skin | cSCC | 4.55e-06 | 1.87e-01 | 0.0292 |
| 79937 | CNTNAP3 | cSCC_p4 | Human | Skin | cSCC | 7.06e-05 | 1.86e-01 | -0.2022 |
| Page: 1 |
| Tissue | Expression Dynamics | Abbreviation |
| Skin | 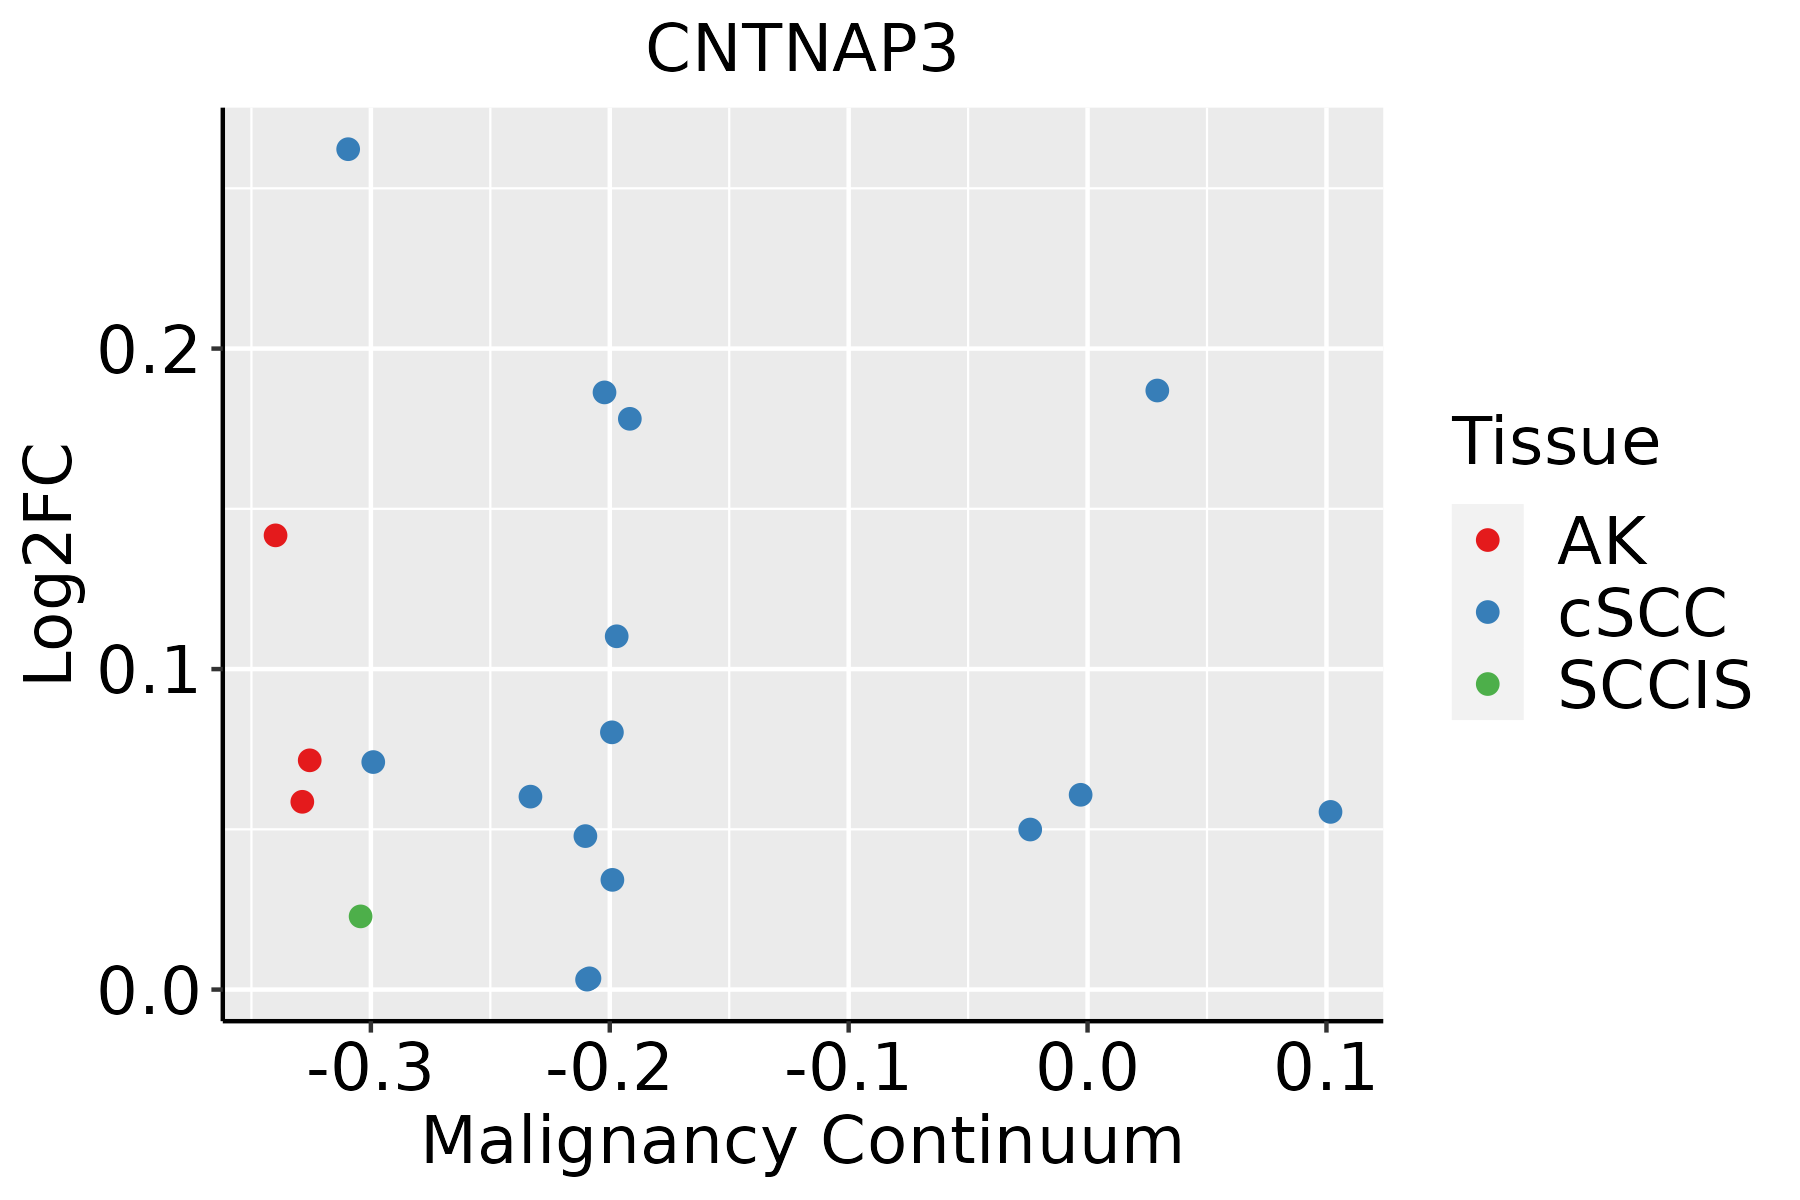 | AK: Actinic keratosis |
| cSCC: Cutaneous squamous cell carcinoma | ||
| SCCIS:squamous cell carcinoma in situ |
| ∗log2FC in expression of this searched gene in stem-like cells from each diseased tissue sample relative to stem-like cells in normal samples in each tissue plotted against the malignancy continuum. Samples are colored based on if they are from different disease stage. |
Top |
Malignant transformation related pathway analysis |
| Find out the enriched GO biological processes and KEGG pathways involved in transition from healthy to precancer to cancer |
| Tissue | Disease Stage | Enriched GO biological Processes |
| Colorectum | AD |  |
| Colorectum | SER |  |
| Colorectum | MSS |  |
| Colorectum | MSI-H |  |
| Colorectum | FAP |  |
| ∗Top 15 enriched GO BP terms are showed in the bar plot of each disease state in each tissue. Each row represents a significant GO biological process which is colored according to the -log10(p.adjust). |
| Page: 1 2 3 4 5 6 7 8 9 |
| GO ID | Tissue | Disease Stage | Description | Gene Ratio | Bg Ratio | pvalue | p.adjust | Count |
| Page: 1 |
| Pathway ID | Tissue | Disease Stage | Description | Gene Ratio | Bg Ratio | pvalue | p.adjust | qvalue | Count |
| Page: 1 |
Top |
Cell-cell communication analysis |
| Identification of potential cell-cell interactions between two cell types and their ligand-receptor pairs for different disease states |
| Ligand | Receptor | LRpair | Pathway | Tissue | Disease Stage |
| Page: 1 |
Top |
Single-cell gene regulatory network inference analysis |
| Find out the significant the regulons (TFs) and the target genes of each regulon across cell types for different disease states |
| TF | Cell Type | Tissue | Disease Stage | Target Gene | RSS | Regulon Activity |
| ∗The dot plots of a searched regulon are shown for all cell subpopulations in each disease state of each tissue based on the regulon specific score inferred using pySCENIC and by calculating the average expression. |
| Page: 1 |
Top |
Somatic mutation of malignant transformation related genes |
| Annotation of somatic variants for genes involved in malignant transformation |
| Hugo Symbol | Variant Class | Variant Classification | dbSNP RS | HGVSc | HGVSp | HGVSp Short | SWISSPROT | BIOTYPE | SIFT | PolyPhen | Tumor Sample Barcode | Tissue | Histology | Sex | Age | Stage | Therapy Types | Drugs | Outcome |
| CNTNAP3 | SNV | Missense_Mutation | c.3694G>C | p.Glu1232Gln | p.E1232Q | Q9BZ76 | protein_coding | tolerated(0.1) | benign(0.288) | TCGA-A1-A0SI-01 | Breast | breast invasive carcinoma | Female | <65 | I/II | Unknown | Unknown | SD | |
| CNTNAP3 | SNV | Missense_Mutation | rs201209922 | c.2357G>A | p.Arg786His | p.R786H | Q9BZ76 | protein_coding | tolerated(0.66) | benign(0.001) | TCGA-A8-A0A9-01 | Breast | breast invasive carcinoma | Female | >=65 | I/II | Hormone Therapy | anastrozole | SD |
| CNTNAP3 | SNV | Missense_Mutation | novel | c.3379N>A | p.Val1127Ile | p.V1127I | Q9BZ76 | protein_coding | tolerated(0.06) | benign(0.035) | TCGA-AC-A2QH-01 | Breast | breast invasive carcinoma | Female | <65 | I/II | Chemotherapy | cytoxan | CR |
| CNTNAP3 | SNV | Missense_Mutation | novel | c.3046N>A | p.Glu1016Lys | p.E1016K | Q9BZ76 | protein_coding | deleterious(0.01) | benign(0.285) | TCGA-AN-A046-01 | Breast | breast invasive carcinoma | Female | >=65 | I/II | Unknown | Unknown | SD |
| CNTNAP3 | SNV | Missense_Mutation | novel | c.3160N>A | p.Leu1054Ile | p.L1054I | Q9BZ76 | protein_coding | tolerated(0.23) | possibly_damaging(0.513) | TCGA-AN-A0FY-01 | Breast | breast invasive carcinoma | Female | <65 | I/II | Unknown | Unknown | SD |
| CNTNAP3 | SNV | Missense_Mutation | c.1701N>A | p.Asp567Glu | p.D567E | Q9BZ76 | protein_coding | deleterious(0.02) | benign(0.065) | TCGA-BH-A0BZ-01 | Breast | breast invasive carcinoma | Female | <65 | III/IV | Chemotherapy | doxorubicin | CR | |
| CNTNAP3 | SNV | Missense_Mutation | novel | c.2836N>A | p.Glu946Lys | p.E946K | Q9BZ76 | protein_coding | deleterious(0.01) | benign(0.206) | TCGA-D8-A27G-01 | Breast | breast invasive carcinoma | Female | >=65 | I/II | Unknown | Unknown | SD |
| CNTNAP3 | insertion | Frame_Shift_Ins | novel | c.1820_1821insGCCC | p.Ile607MetfsTer3 | p.I607Mfs*3 | Q9BZ76 | protein_coding | TCGA-AR-A0TY-01 | Breast | breast invasive carcinoma | Female | <65 | I/II | Unspecific | Paclitaxel | PD | ||
| CNTNAP3 | SNV | Missense_Mutation | novel | c.3211N>A | p.Ala1071Thr | p.A1071T | Q9BZ76 | protein_coding | tolerated(0.47) | benign(0.037) | TCGA-2W-A8YY-01 | Cervix | cervical & endocervical cancer | Female | <65 | I/II | Chemotherapy | cisplatin | CR |
| CNTNAP3 | SNV | Missense_Mutation | novel | c.3835N>A | p.Glu1279Lys | p.E1279K | Q9BZ76 | protein_coding | deleterious(0.02) | benign(0.27) | TCGA-C5-A1ME-01 | Cervix | cervical & endocervical cancer | Female | <65 | I/II | Unknown | Unknown | SD |
| Page: 1 2 3 4 5 6 7 8 9 10 11 |
Top |
Related drugs of malignant transformation related genes |
| Identification of chemicals and drugs interact with genes involved in malignant transfromation |
| (DGIdb 4.0) |
| Entrez ID | Symbol | Category | Interaction Types | Drug Claim Name | Drug Name | PMIDs |
| Page: 1 |

Copyright 2023-Present -The University of Texas Health Science Center at Houston |