
|
|||||
|
 | |
| |
| |
| |
| |
| |
|
Gene: CNTN3 |
Gene summary for CNTN3 |
| Gene information | Species | Human | Gene symbol | CNTN3 | Gene ID | 5067 |
| Gene name | contactin 3 | |
| Gene Alias | BIG-1 | |
| Cytomap | 3p12.3 | |
| Gene Type | protein-coding | GO ID | GO:0007155 | UniProtAcc | Q9P232 |
Top |
Malignant transformation analysis |
| Identification of the aberrant gene expression in precancerous and cancerous lesions by comparing the gene expression of stem-like cells in diseased tissues with normal stem cells |
| Entrez ID | Symbol | Replicates | Species | Organ | Tissue | Adj P-value | Log2FC | Malignancy |
| 5067 | CNTN3 | HTA11_3410_2000001011 | Human | Colorectum | AD | 1.14e-23 | -6.96e-01 | 0.0155 |
| 5067 | CNTN3 | HTA11_2487_2000001011 | Human | Colorectum | SER | 1.05e-13 | -7.54e-01 | -0.1808 |
| 5067 | CNTN3 | HTA11_2951_2000001011 | Human | Colorectum | AD | 3.00e-04 | -8.29e-01 | 0.0216 |
| 5067 | CNTN3 | HTA11_78_2000001011 | Human | Colorectum | AD | 2.22e-03 | -4.28e-01 | -0.1088 |
| 5067 | CNTN3 | HTA11_3361_2000001011 | Human | Colorectum | AD | 6.99e-11 | -7.47e-01 | -0.1207 |
| 5067 | CNTN3 | HTA11_696_2000001011 | Human | Colorectum | AD | 1.18e-20 | -5.96e-01 | -0.1464 |
| 5067 | CNTN3 | HTA11_866_2000001011 | Human | Colorectum | AD | 7.49e-05 | -3.62e-01 | -0.1001 |
| 5067 | CNTN3 | HTA11_1391_2000001011 | Human | Colorectum | AD | 6.15e-05 | -4.57e-01 | -0.059 |
| 5067 | CNTN3 | HTA11_5212_2000001011 | Human | Colorectum | AD | 2.61e-04 | -7.46e-01 | -0.2061 |
| 5067 | CNTN3 | HTA11_5216_2000001011 | Human | Colorectum | SER | 9.33e-05 | -8.61e-01 | -0.1462 |
| 5067 | CNTN3 | HTA11_546_2000001011 | Human | Colorectum | AD | 9.75e-04 | -5.46e-01 | -0.0842 |
| 5067 | CNTN3 | HTA11_866_3004761011 | Human | Colorectum | AD | 7.15e-21 | -7.49e-01 | 0.096 |
| 5067 | CNTN3 | HTA11_9408_2000001011 | Human | Colorectum | AD | 1.79e-02 | -8.00e-01 | 0.0451 |
| 5067 | CNTN3 | HTA11_8622_2000001021 | Human | Colorectum | SER | 3.07e-05 | -7.77e-01 | 0.0528 |
| 5067 | CNTN3 | HTA11_10711_2000001011 | Human | Colorectum | AD | 6.65e-04 | -4.77e-01 | 0.0338 |
| 5067 | CNTN3 | HTA11_7696_3000711011 | Human | Colorectum | AD | 7.81e-20 | -5.78e-01 | 0.0674 |
| 5067 | CNTN3 | HTA11_6818_2000001011 | Human | Colorectum | AD | 7.75e-03 | -6.17e-01 | 0.0112 |
| 5067 | CNTN3 | HTA11_11156_2000001011 | Human | Colorectum | AD | 2.99e-02 | -8.64e-01 | 0.0397 |
| 5067 | CNTN3 | HTA11_6818_2000001021 | Human | Colorectum | AD | 3.55e-09 | -6.84e-01 | 0.0588 |
| 5067 | CNTN3 | HTA11_99999970781_79442 | Human | Colorectum | MSS | 3.42e-56 | -9.27e-01 | 0.294 |
| Page: 1 2 3 |
| Tissue | Expression Dynamics | Abbreviation |
| Colorectum (GSE201348) | 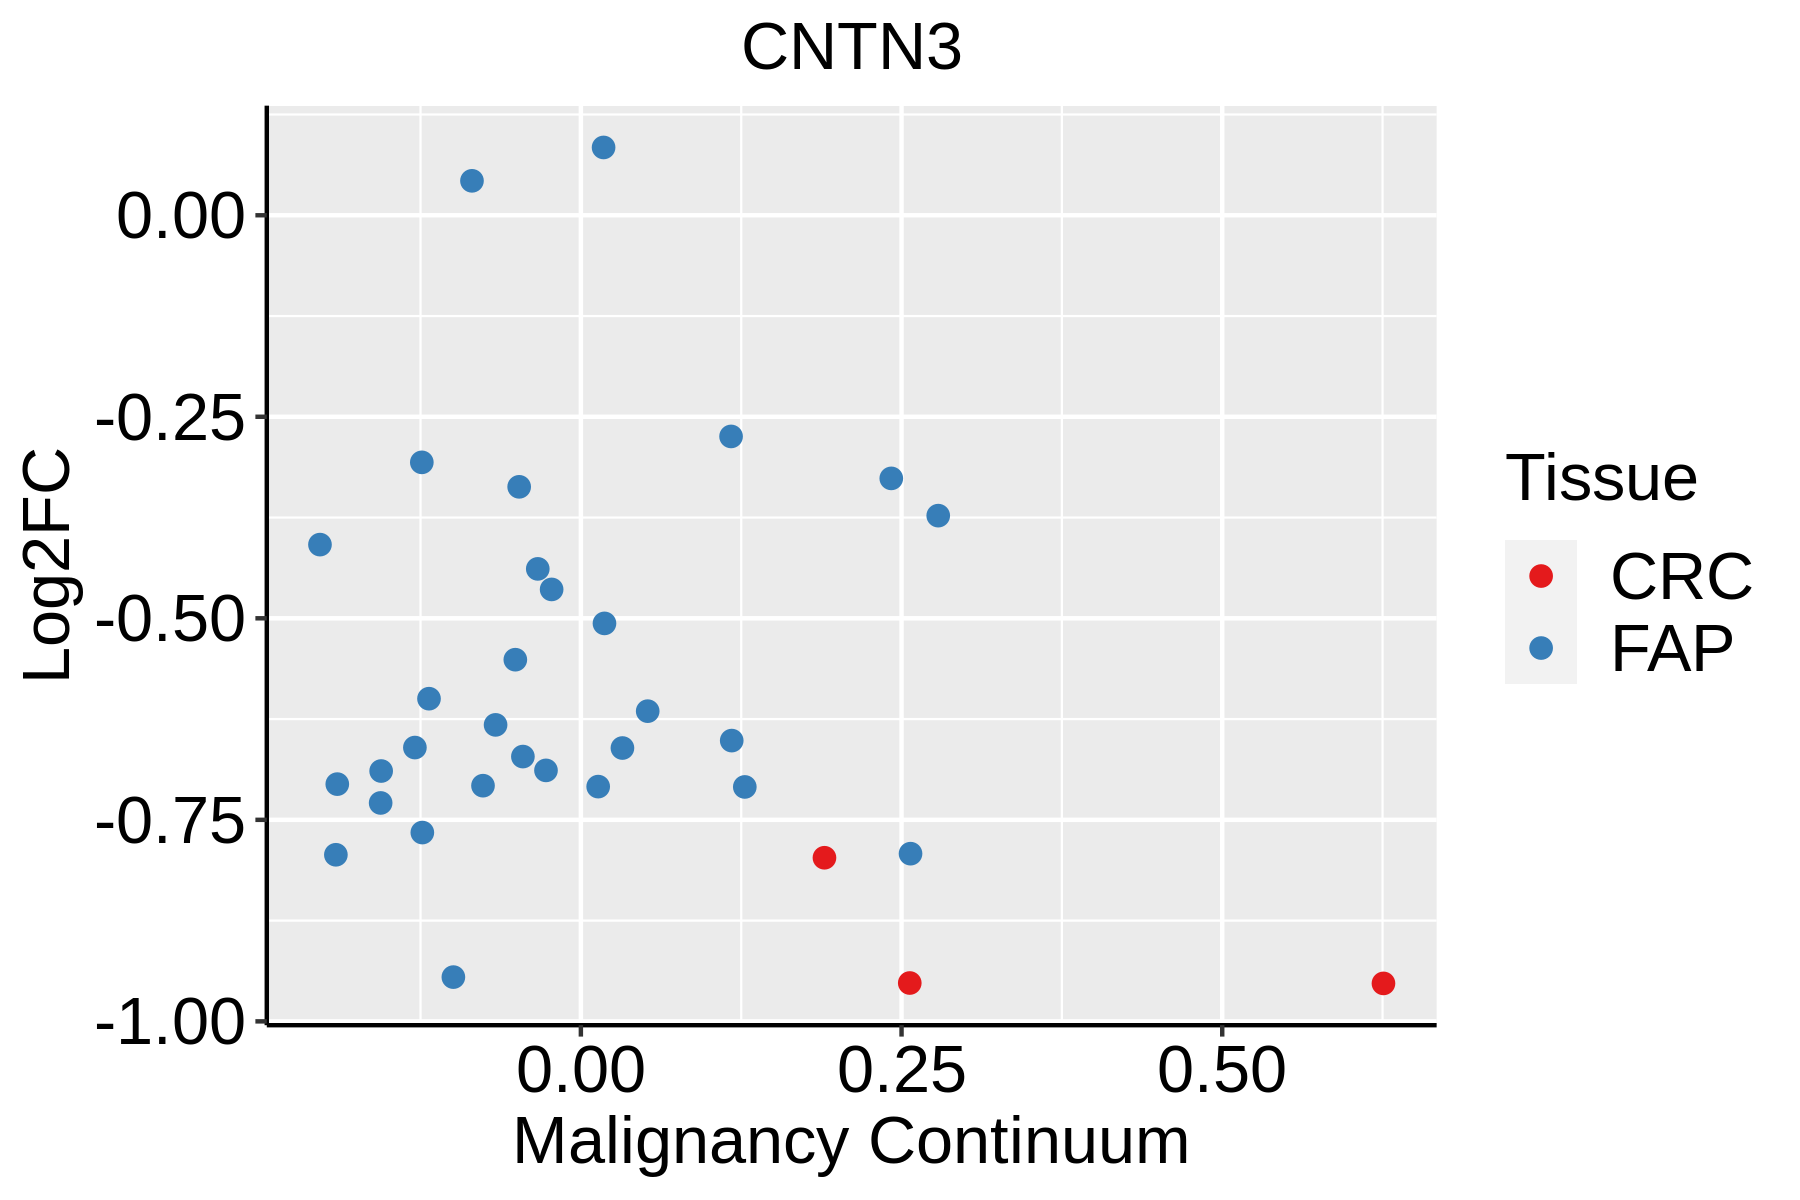 | FAP: Familial adenomatous polyposis |
| CRC: Colorectal cancer | ||
| Colorectum (HTA11) |  | AD: Adenomas |
| SER: Sessile serrated lesions | ||
| MSI-H: Microsatellite-high colorectal cancer | ||
| MSS: Microsatellite stable colorectal cancer |
| ∗log2FC in expression of this searched gene in stem-like cells from each diseased tissue sample relative to stem-like cells in normal samples in each tissue plotted against the malignancy continuum. Samples are colored based on if they are from different disease stage. |
Top |
Malignant transformation related pathway analysis |
| Find out the enriched GO biological processes and KEGG pathways involved in transition from healthy to precancer to cancer |
| Tissue | Disease Stage | Enriched GO biological Processes |
| Colorectum | AD |  |
| Colorectum | SER |  |
| Colorectum | MSS |  |
| Colorectum | MSI-H |  |
| Colorectum | FAP |  |
| ∗Top 15 enriched GO BP terms are showed in the bar plot of each disease state in each tissue. Each row represents a significant GO biological process which is colored according to the -log10(p.adjust). |
| Page: 1 2 3 4 5 6 7 8 9 |
| GO ID | Tissue | Disease Stage | Description | Gene Ratio | Bg Ratio | pvalue | p.adjust | Count |
| Page: 1 |
| Pathway ID | Tissue | Disease Stage | Description | Gene Ratio | Bg Ratio | pvalue | p.adjust | qvalue | Count |
| Page: 1 |
Top |
Cell-cell communication analysis |
| Identification of potential cell-cell interactions between two cell types and their ligand-receptor pairs for different disease states |
| Ligand | Receptor | LRpair | Pathway | Tissue | Disease Stage |
| Page: 1 |
Top |
Single-cell gene regulatory network inference analysis |
| Find out the significant the regulons (TFs) and the target genes of each regulon across cell types for different disease states |
| TF | Cell Type | Tissue | Disease Stage | Target Gene | RSS | Regulon Activity |
| ∗The dot plots of a searched regulon are shown for all cell subpopulations in each disease state of each tissue based on the regulon specific score inferred using pySCENIC and by calculating the average expression. |
| Page: 1 |
Top |
Somatic mutation of malignant transformation related genes |
| Annotation of somatic variants for genes involved in malignant transformation |
| Hugo Symbol | Variant Class | Variant Classification | dbSNP RS | HGVSc | HGVSp | HGVSp Short | SWISSPROT | BIOTYPE | SIFT | PolyPhen | Tumor Sample Barcode | Tissue | Histology | Sex | Age | Stage | Therapy Types | Drugs | Outcome |
| CNTN3 | SNV | Missense_Mutation | c.1580N>A | p.Pro527Gln | p.P527Q | Q9P232 | protein_coding | deleterious(0) | probably_damaging(0.961) | TCGA-A7-A0DB-01 | Breast | breast invasive carcinoma | Female | <65 | I/II | Hormone Therapy | arimidex | SD | |
| CNTN3 | SNV | Missense_Mutation | c.3082T>C | p.Trp1028Arg | p.W1028R | Q9P232 | protein_coding | deleterious_low_confidence(0) | possibly_damaging(0.497) | TCGA-A8-A08R-01 | Breast | breast invasive carcinoma | Female | <65 | I/II | Unknown | Unknown | SD | |
| CNTN3 | SNV | Missense_Mutation | c.1951N>A | p.Glu651Lys | p.E651K | Q9P232 | protein_coding | deleterious(0) | possibly_damaging(0.483) | TCGA-AC-A23H-01 | Breast | breast invasive carcinoma | Female | >=65 | I/II | Unknown | Unknown | PD | |
| CNTN3 | SNV | Missense_Mutation | novel | c.2860N>G | p.Asn954Asp | p.N954D | Q9P232 | protein_coding | deleterious(0.04) | benign(0.001) | TCGA-AN-A046-01 | Breast | breast invasive carcinoma | Female | >=65 | I/II | Unknown | Unknown | SD |
| CNTN3 | SNV | Missense_Mutation | novel | c.1982N>A | p.Thr661Asn | p.T661N | Q9P232 | protein_coding | deleterious(0) | probably_damaging(0.991) | TCGA-AN-A0FV-01 | Breast | breast invasive carcinoma | Female | <65 | I/II | Unknown | Unknown | SD |
| CNTN3 | SNV | Missense_Mutation | novel | c.207T>G | p.Ile69Met | p.I69M | Q9P232 | protein_coding | deleterious(0.01) | possibly_damaging(0.516) | TCGA-AR-A2LK-01 | Breast | breast invasive carcinoma | Female | <65 | III/IV | Hormone Therapy | anastrozole | PD |
| CNTN3 | SNV | Missense_Mutation | rs147790729 | c.1985T>C | p.Val662Ala | p.V662A | Q9P232 | protein_coding | tolerated(0.23) | benign(0.168) | TCGA-B6-A0RL-01 | Breast | breast invasive carcinoma | Female | <65 | I/II | Unknown | Unknown | SD |
| CNTN3 | SNV | Missense_Mutation | rs143508019 | c.2848N>A | p.Val950Ile | p.V950I | Q9P232 | protein_coding | tolerated(0.2) | benign(0) | TCGA-BH-A18G-01 | Breast | breast invasive carcinoma | Female | >=65 | I/II | Unknown | Unknown | SD |
| CNTN3 | insertion | In_Frame_Ins | novel | c.2363_2364insTTTAAT | p.Pro788_Phe789insLeuIle | p.P788_F789insLI | Q9P232 | protein_coding | TCGA-AR-A0U0-01 | Breast | breast invasive carcinoma | Female | >=65 | I/II | Unknown | Unknown | SD | ||
| CNTN3 | deletion | Frame_Shift_Del | c.2945delA | p.Asp982ValfsTer13 | p.D982Vfs*13 | Q9P232 | protein_coding | TCGA-E9-A22H-01 | Breast | breast invasive carcinoma | Female | <65 | I/II | Chemotherapy | doxorubicin | SD |
| Page: 1 2 3 4 5 6 7 8 9 10 11 12 13 14 15 16 17 18 19 |
Top |
Related drugs of malignant transformation related genes |
| Identification of chemicals and drugs interact with genes involved in malignant transfromation |
| (DGIdb 4.0) |
| Entrez ID | Symbol | Category | Interaction Types | Drug Claim Name | Drug Name | PMIDs |
| Page: 1 |

Copyright 2023-Present -The University of Texas Health Science Center at Houston |