
|
|||||
|
 | |
| |
| |
| |
| |
| |
|
Gene: CNTLN |
Gene summary for CNTLN |
| Gene information | Species | Human | Gene symbol | CNTLN | Gene ID | 54875 |
| Gene name | centlein | |
| Gene Alias | C9orf101 | |
| Cytomap | 9p22.2 | |
| Gene Type | protein-coding | GO ID | GO:0000226 | UniProtAcc | Q9NXG0 |
Top |
Malignant transformation analysis |
| Identification of the aberrant gene expression in precancerous and cancerous lesions by comparing the gene expression of stem-like cells in diseased tissues with normal stem cells |
| Entrez ID | Symbol | Replicates | Species | Organ | Tissue | Adj P-value | Log2FC | Malignancy |
| 54875 | CNTLN | LZE8T | Human | Esophagus | ESCC | 8.79e-04 | 9.89e-02 | 0.067 |
| 54875 | CNTLN | LZE21D1 | Human | Esophagus | HGIN | 2.52e-02 | 3.17e-01 | 0.0632 |
| 54875 | CNTLN | LZE24T | Human | Esophagus | ESCC | 2.12e-13 | 3.40e-01 | 0.0596 |
| 54875 | CNTLN | LZE21T | Human | Esophagus | ESCC | 4.41e-05 | 2.54e-01 | 0.0655 |
| 54875 | CNTLN | P1T-E | Human | Esophagus | ESCC | 4.58e-09 | 3.70e-01 | 0.0875 |
| 54875 | CNTLN | P2T-E | Human | Esophagus | ESCC | 6.99e-33 | 5.27e-01 | 0.1177 |
| 54875 | CNTLN | P4T-E | Human | Esophagus | ESCC | 5.76e-08 | 2.46e-01 | 0.1323 |
| 54875 | CNTLN | P5T-E | Human | Esophagus | ESCC | 1.75e-06 | 1.42e-01 | 0.1327 |
| 54875 | CNTLN | P8T-E | Human | Esophagus | ESCC | 3.59e-08 | 2.07e-01 | 0.0889 |
| 54875 | CNTLN | P9T-E | Human | Esophagus | ESCC | 1.71e-04 | 1.37e-01 | 0.1131 |
| 54875 | CNTLN | P10T-E | Human | Esophagus | ESCC | 5.38e-18 | 3.11e-01 | 0.116 |
| 54875 | CNTLN | P11T-E | Human | Esophagus | ESCC | 1.66e-10 | 4.69e-01 | 0.1426 |
| 54875 | CNTLN | P12T-E | Human | Esophagus | ESCC | 1.27e-15 | 2.78e-01 | 0.1122 |
| 54875 | CNTLN | P15T-E | Human | Esophagus | ESCC | 1.15e-08 | 1.52e-01 | 0.1149 |
| 54875 | CNTLN | P16T-E | Human | Esophagus | ESCC | 4.42e-11 | 1.74e-01 | 0.1153 |
| 54875 | CNTLN | P17T-E | Human | Esophagus | ESCC | 7.11e-14 | 3.27e-01 | 0.1278 |
| 54875 | CNTLN | P20T-E | Human | Esophagus | ESCC | 3.65e-09 | 2.22e-01 | 0.1124 |
| 54875 | CNTLN | P21T-E | Human | Esophagus | ESCC | 6.21e-05 | 2.95e-02 | 0.1617 |
| 54875 | CNTLN | P22T-E | Human | Esophagus | ESCC | 7.16e-20 | 2.94e-01 | 0.1236 |
| 54875 | CNTLN | P23T-E | Human | Esophagus | ESCC | 7.24e-10 | 1.97e-01 | 0.108 |
| Page: 1 2 3 4 5 |
| Tissue | Expression Dynamics | Abbreviation |
| Esophagus |  | ESCC: Esophageal squamous cell carcinoma |
| HGIN: High-grade intraepithelial neoplasias | ||
| LGIN: Low-grade intraepithelial neoplasias | ||
| Liver | 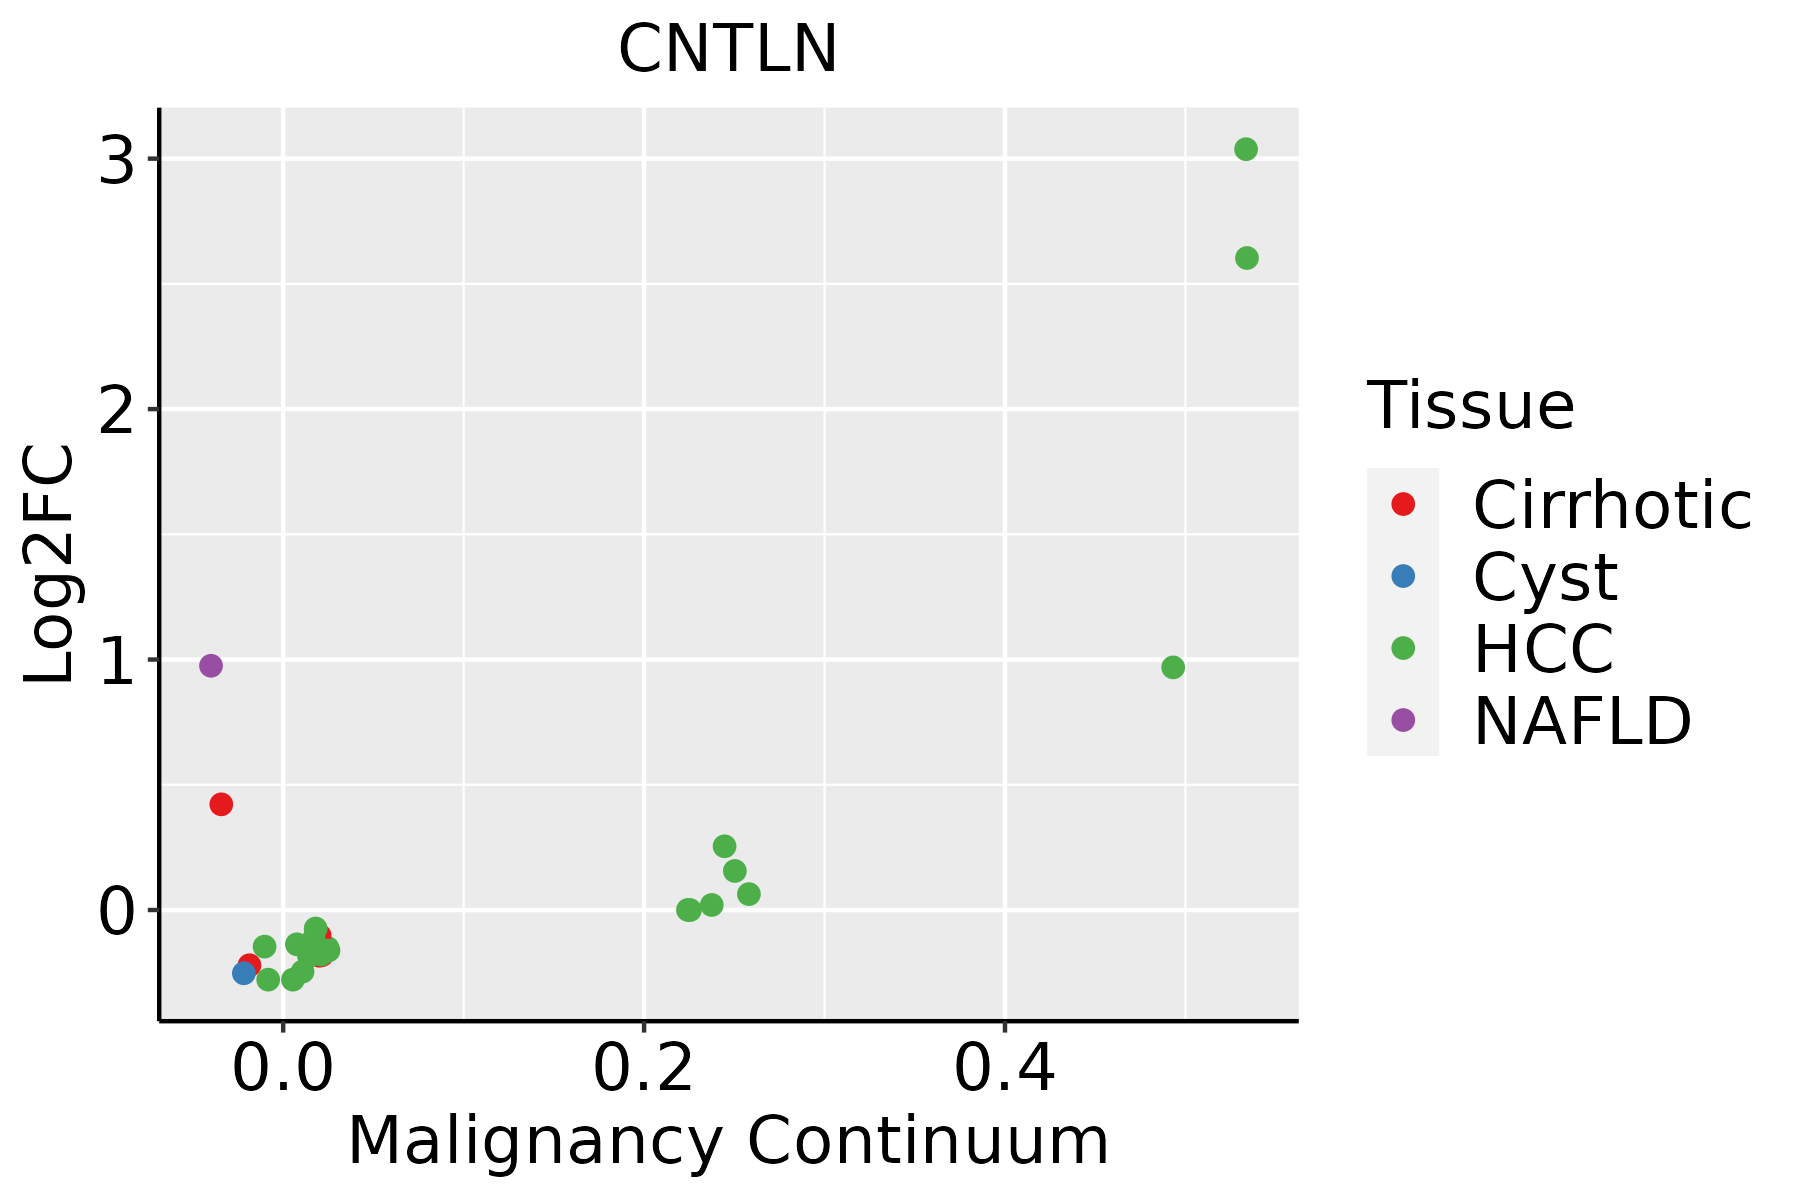 | HCC: Hepatocellular carcinoma |
| NAFLD: Non-alcoholic fatty liver disease | ||
| Oral Cavity |  | EOLP: Erosive Oral lichen planus |
| LP: leukoplakia | ||
| NEOLP: Non-erosive oral lichen planus | ||
| OSCC: Oral squamous cell carcinoma | ||
| Thyroid | 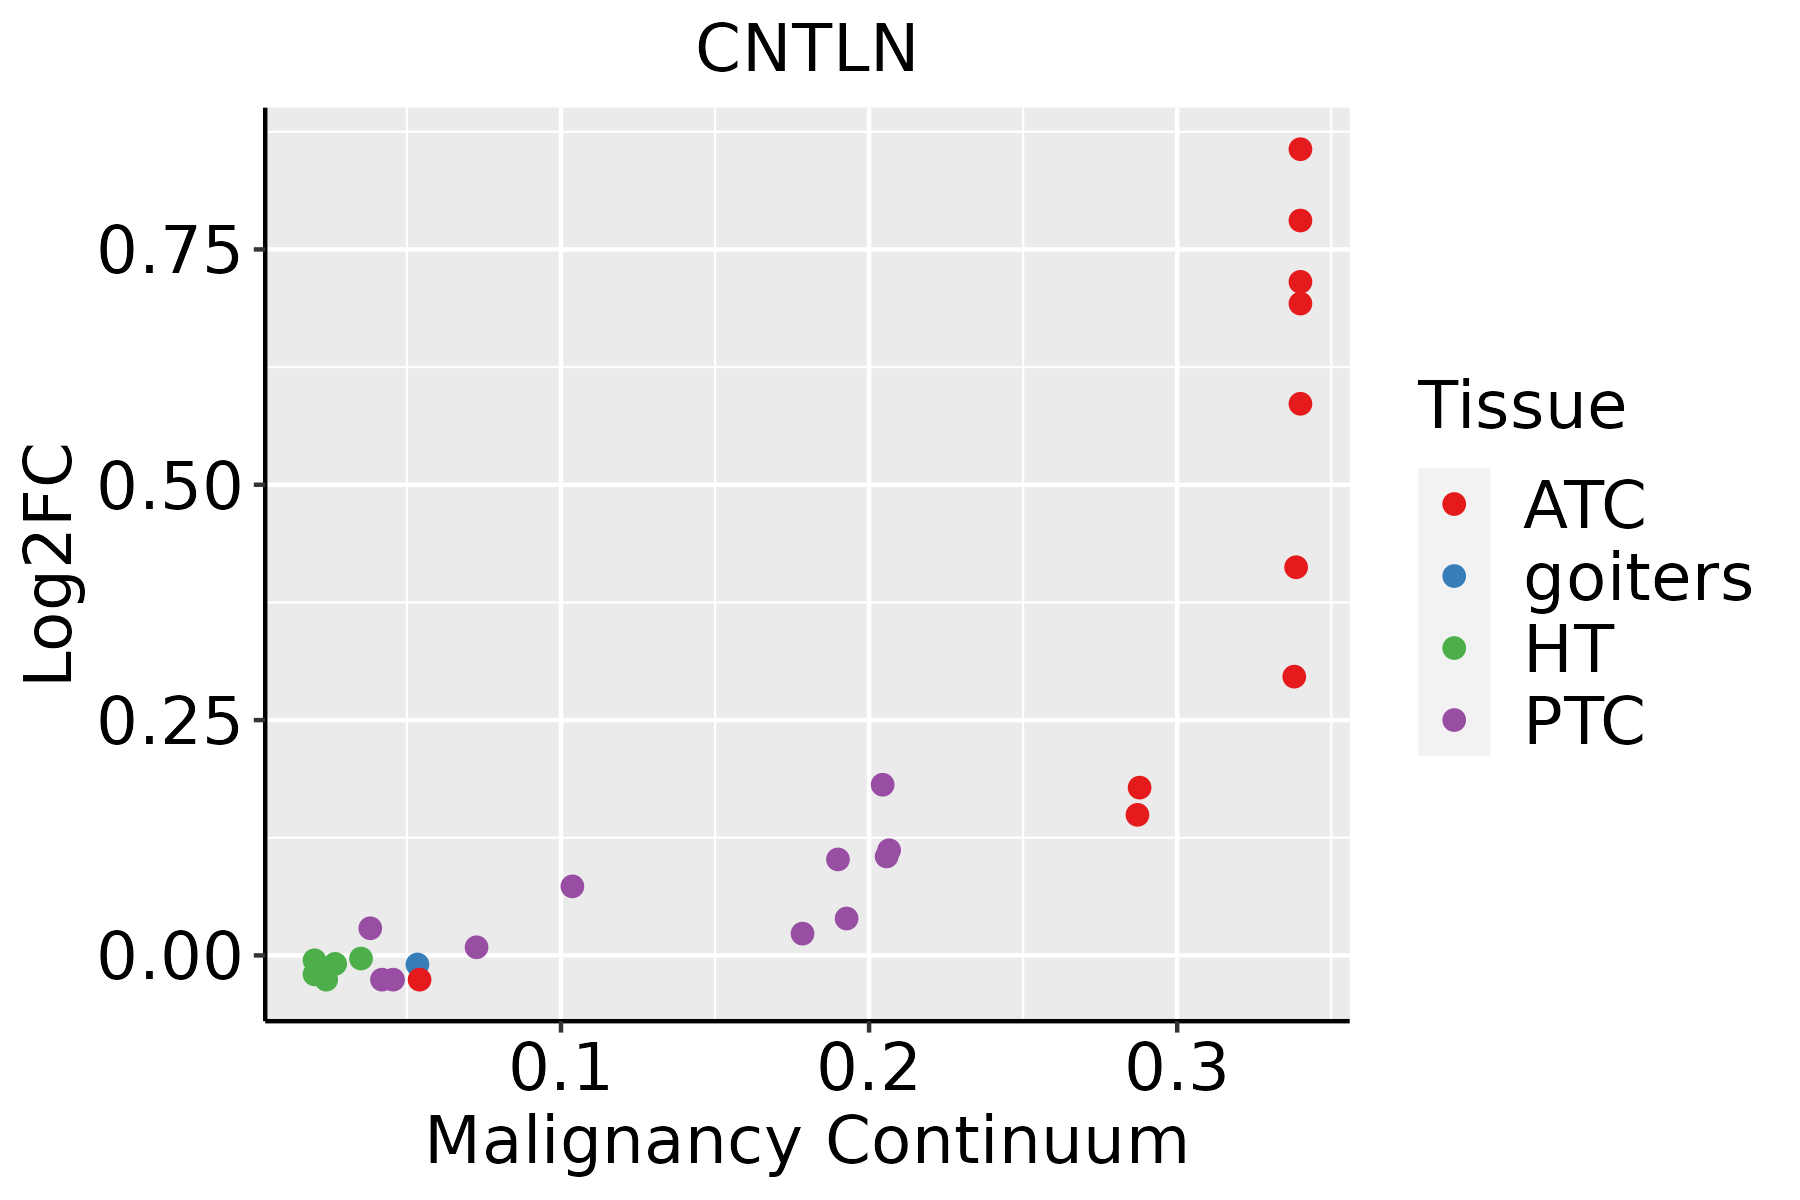 | ATC: Anaplastic thyroid cancer |
| HT: Hashimoto's thyroiditis | ||
| PTC: Papillary thyroid cancer |
| ∗log2FC in expression of this searched gene in stem-like cells from each diseased tissue sample relative to stem-like cells in normal samples in each tissue plotted against the malignancy continuum. Samples are colored based on if they are from different disease stage. |
Top |
Malignant transformation related pathway analysis |
| Find out the enriched GO biological processes and KEGG pathways involved in transition from healthy to precancer to cancer |
| Tissue | Disease Stage | Enriched GO biological Processes |
| Colorectum | AD |  |
| Colorectum | SER |  |
| Colorectum | MSS |  |
| Colorectum | MSI-H |  |
| Colorectum | FAP |  |
| ∗Top 15 enriched GO BP terms are showed in the bar plot of each disease state in each tissue. Each row represents a significant GO biological process which is colored according to the -log10(p.adjust). |
| Page: 1 2 3 4 5 6 7 8 9 |
| GO ID | Tissue | Disease Stage | Description | Gene Ratio | Bg Ratio | pvalue | p.adjust | Count |
| GO:00070982 | Esophagus | ESCC | centrosome cycle | 85/8552 | 130/18723 | 4.41e-06 | 4.69e-05 | 85 |
| GO:00310233 | Esophagus | ESCC | microtubule organizing center organization | 92/8552 | 143/18723 | 5.04e-06 | 5.31e-05 | 92 |
| GO:0010457 | Esophagus | ESCC | centriole-centriole cohesion | 12/8552 | 14/18723 | 2.51e-03 | 1.08e-02 | 12 |
| GO:0031023 | Liver | HCC | microtubule organizing center organization | 82/7958 | 143/18723 | 2.38e-04 | 1.79e-03 | 82 |
| GO:0007098 | Liver | HCC | centrosome cycle | 75/7958 | 130/18723 | 3.33e-04 | 2.34e-03 | 75 |
| GO:00070981 | Oral cavity | OSCC | centrosome cycle | 66/7305 | 130/18723 | 4.17e-03 | 1.70e-02 | 66 |
| GO:00310232 | Oral cavity | OSCC | microtubule organizing center organization | 70/7305 | 143/18723 | 9.71e-03 | 3.44e-02 | 70 |
| GO:00310235 | Thyroid | PTC | microtubule organizing center organization | 65/5968 | 143/18723 | 4.48e-04 | 2.96e-03 | 65 |
| GO:00070984 | Thyroid | PTC | centrosome cycle | 59/5968 | 130/18723 | 8.39e-04 | 5.16e-03 | 59 |
| GO:003102311 | Thyroid | ATC | microtubule organizing center organization | 71/6293 | 143/18723 | 5.11e-05 | 3.99e-04 | 71 |
| GO:000709811 | Thyroid | ATC | centrosome cycle | 65/6293 | 130/18723 | 7.95e-05 | 5.97e-04 | 65 |
| Page: 1 |
| Pathway ID | Tissue | Disease Stage | Description | Gene Ratio | Bg Ratio | pvalue | p.adjust | qvalue | Count |
| Page: 1 |
Top |
Cell-cell communication analysis |
| Identification of potential cell-cell interactions between two cell types and their ligand-receptor pairs for different disease states |
| Ligand | Receptor | LRpair | Pathway | Tissue | Disease Stage |
| Page: 1 |
Top |
Single-cell gene regulatory network inference analysis |
| Find out the significant the regulons (TFs) and the target genes of each regulon across cell types for different disease states |
| TF | Cell Type | Tissue | Disease Stage | Target Gene | RSS | Regulon Activity |
| ∗The dot plots of a searched regulon are shown for all cell subpopulations in each disease state of each tissue based on the regulon specific score inferred using pySCENIC and by calculating the average expression. |
| Page: 1 |
Top |
Somatic mutation of malignant transformation related genes |
| Annotation of somatic variants for genes involved in malignant transformation |
| Hugo Symbol | Variant Class | Variant Classification | dbSNP RS | HGVSc | HGVSp | HGVSp Short | SWISSPROT | BIOTYPE | SIFT | PolyPhen | Tumor Sample Barcode | Tissue | Histology | Sex | Age | Stage | Therapy Types | Drugs | Outcome |
| CNTLN | SNV | Missense_Mutation | c.3818C>A | p.Ala1273Asp | p.A1273D | Q9NXG0 | protein_coding | deleterious(0) | possibly_damaging(0.564) | TCGA-A2-A0EY-01 | Breast | breast invasive carcinoma | Female | <65 | I/II | Chemotherapy | adriamycin | SD | |
| CNTLN | SNV | Missense_Mutation | novel | c.3066N>C | p.Gln1022His | p.Q1022H | Q9NXG0 | protein_coding | deleterious(0.02) | probably_damaging(0.997) | TCGA-A8-A06P-01 | Breast | breast invasive carcinoma | Female | <65 | III/IV | Unspecific | SD | |
| CNTLN | SNV | Missense_Mutation | c.4172A>G | p.Lys1391Arg | p.K1391R | Q9NXG0 | protein_coding | tolerated(0.29) | benign(0.015) | TCGA-A8-A07W-01 | Breast | breast invasive carcinoma | Female | >=65 | III/IV | Hormone Therapy | exemestane | SD | |
| CNTLN | SNV | Missense_Mutation | c.648N>T | p.Lys216Asn | p.K216N | Q9NXG0 | protein_coding | tolerated(0.1) | benign(0.009) | TCGA-A8-A09A-01 | Breast | breast invasive carcinoma | Female | <65 | I/II | Hormone Therapy | tamoxiphen | SD | |
| CNTLN | SNV | Missense_Mutation | novel | c.1819N>T | p.Asp607Tyr | p.D607Y | Q9NXG0 | protein_coding | deleterious(0) | probably_damaging(0.999) | TCGA-AN-A046-01 | Breast | breast invasive carcinoma | Female | >=65 | I/II | Unknown | Unknown | SD |
| CNTLN | SNV | Missense_Mutation | c.813N>C | p.Leu271Phe | p.L271F | Q9NXG0 | protein_coding | deleterious(0.01) | benign(0.014) | TCGA-AN-A0FX-01 | Breast | breast invasive carcinoma | Female | <65 | I/II | Unknown | Unknown | SD | |
| CNTLN | SNV | Missense_Mutation | rs201402782 | c.634N>C | p.Glu212Gln | p.E212Q | Q9NXG0 | protein_coding | tolerated(1) | benign(0) | TCGA-AO-A03T-01 | Breast | breast invasive carcinoma | Female | <65 | I/II | Chemotherapy | cyclophosphamide | SD |
| CNTLN | SNV | Missense_Mutation | c.464N>T | p.Ser155Phe | p.S155F | Q9NXG0 | protein_coding | deleterious(0) | possibly_damaging(0.667) | TCGA-AO-A0J3-01 | Breast | breast invasive carcinoma | Female | >=65 | I/II | Chemotherapy | cyclophosphamide | SD | |
| CNTLN | SNV | Missense_Mutation | c.2704N>C | p.Asp902His | p.D902H | Q9NXG0 | protein_coding | deleterious(0.01) | benign(0.024) | TCGA-AO-A0J6-01 | Breast | breast invasive carcinoma | Female | <65 | I/II | Chemotherapy | doxorubicin | SD | |
| CNTLN | SNV | Missense_Mutation | c.3026N>G | p.Val1009Gly | p.V1009G | Q9NXG0 | protein_coding | deleterious(0) | benign(0.118) | TCGA-AR-A255-01 | Breast | breast invasive carcinoma | Female | <65 | I/II | Targeted Molecular therapy | trastuzumab | SD |
| Page: 1 2 3 4 5 6 7 8 9 10 11 12 13 14 15 16 17 18 19 20 |
Top |
Related drugs of malignant transformation related genes |
| Identification of chemicals and drugs interact with genes involved in malignant transfromation |
| (DGIdb 4.0) |
| Entrez ID | Symbol | Category | Interaction Types | Drug Claim Name | Drug Name | PMIDs |
| Page: 1 |

Copyright 2023-Present -The University of Texas Health Science Center at Houston |