
|
|||||
|
 | |
| |
| |
| |
| |
| |
|
Gene: CNRIP1 |
Gene summary for CNRIP1 |
| Gene information | Species | Human | Gene symbol | CNRIP1 | Gene ID | 25927 |
| Gene name | cannabinoid receptor interacting protein 1 | |
| Gene Alias | C2orf32 | |
| Cytomap | 2p14 | |
| Gene Type | protein-coding | GO ID | GO:0007154 | UniProtAcc | Q96F85 |
Top |
Malignant transformation analysis |
| Identification of the aberrant gene expression in precancerous and cancerous lesions by comparing the gene expression of stem-like cells in diseased tissues with normal stem cells |
| Entrez ID | Symbol | Replicates | Species | Organ | Tissue | Adj P-value | Log2FC | Malignancy |
| 25927 | CNRIP1 | ATC11 | Human | Thyroid | ATC | 5.35e-04 | 2.81e-01 | 0.3386 |
| 25927 | CNRIP1 | ATC12 | Human | Thyroid | ATC | 4.05e-02 | 4.87e-02 | 0.34 |
| 25927 | CNRIP1 | ATC13 | Human | Thyroid | ATC | 1.04e-27 | 4.13e-01 | 0.34 |
| 25927 | CNRIP1 | ATC2 | Human | Thyroid | ATC | 9.94e-09 | 5.87e-01 | 0.34 |
| 25927 | CNRIP1 | ATC3 | Human | Thyroid | ATC | 6.30e-07 | 3.35e-01 | 0.338 |
| 25927 | CNRIP1 | ATC5 | Human | Thyroid | ATC | 6.67e-24 | 4.60e-01 | 0.34 |
| Page: 1 |
| Tissue | Expression Dynamics | Abbreviation |
| Thyroid | 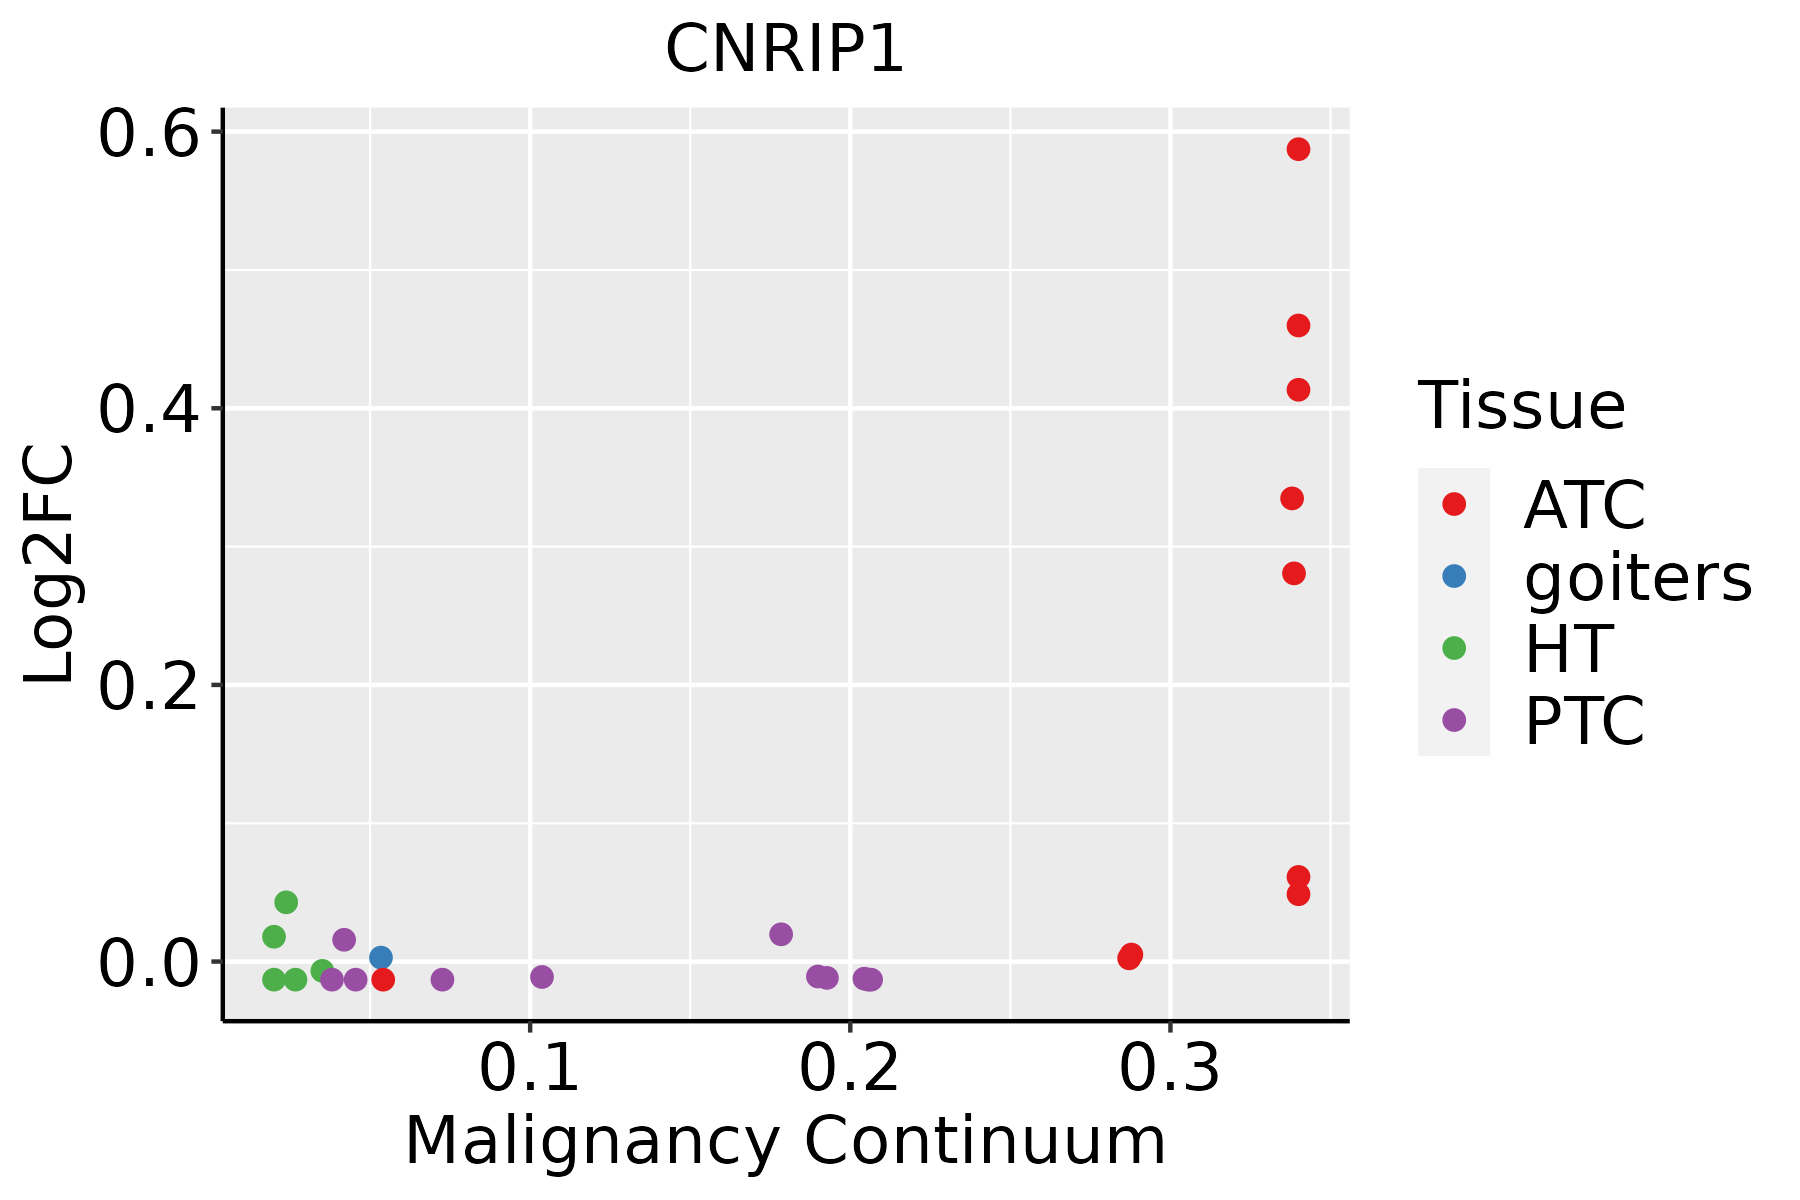 | ATC: Anaplastic thyroid cancer |
| HT: Hashimoto's thyroiditis | ||
| PTC: Papillary thyroid cancer |
| ∗log2FC in expression of this searched gene in stem-like cells from each diseased tissue sample relative to stem-like cells in normal samples in each tissue plotted against the malignancy continuum. Samples are colored based on if they are from different disease stage. |
Top |
Malignant transformation related pathway analysis |
| Find out the enriched GO biological processes and KEGG pathways involved in transition from healthy to precancer to cancer |
| Tissue | Disease Stage | Enriched GO biological Processes |
| Colorectum | AD |  |
| Colorectum | SER |  |
| Colorectum | MSS |  |
| Colorectum | MSI-H |  |
| Colorectum | FAP |  |
| ∗Top 15 enriched GO BP terms are showed in the bar plot of each disease state in each tissue. Each row represents a significant GO biological process which is colored according to the -log10(p.adjust). |
| Page: 1 2 3 4 5 6 7 8 9 |
| GO ID | Tissue | Disease Stage | Description | Gene Ratio | Bg Ratio | pvalue | p.adjust | Count |
| Page: 1 |
| Pathway ID | Tissue | Disease Stage | Description | Gene Ratio | Bg Ratio | pvalue | p.adjust | qvalue | Count |
| Page: 1 |
Top |
Cell-cell communication analysis |
| Identification of potential cell-cell interactions between two cell types and their ligand-receptor pairs for different disease states |
| Ligand | Receptor | LRpair | Pathway | Tissue | Disease Stage |
| Page: 1 |
Top |
Single-cell gene regulatory network inference analysis |
| Find out the significant the regulons (TFs) and the target genes of each regulon across cell types for different disease states |
| TF | Cell Type | Tissue | Disease Stage | Target Gene | RSS | Regulon Activity |
| ∗The dot plots of a searched regulon are shown for all cell subpopulations in each disease state of each tissue based on the regulon specific score inferred using pySCENIC and by calculating the average expression. |
| Page: 1 |
Top |
Somatic mutation of malignant transformation related genes |
| Annotation of somatic variants for genes involved in malignant transformation |
| Hugo Symbol | Variant Class | Variant Classification | dbSNP RS | HGVSc | HGVSp | HGVSp Short | SWISSPROT | BIOTYPE | SIFT | PolyPhen | Tumor Sample Barcode | Tissue | Histology | Sex | Age | Stage | Therapy Types | Drugs | Outcome |
| CNRIP1 | SNV | Missense_Mutation | c.382N>C | p.Glu128Gln | p.E128Q | Q96F85 | protein_coding | deleterious_low_confidence(0) | benign(0.031) | TCGA-D8-A1JA-01 | Breast | breast invasive carcinoma | Female | <65 | III/IV | Chemotherapy | adriamycin | PD | |
| CNRIP1 | SNV | Missense_Mutation | c.145G>C | p.Glu49Gln | p.E49Q | Q96F85 | protein_coding | tolerated(0.14) | possibly_damaging(0.583) | TCGA-GM-A2D9-01 | Breast | breast invasive carcinoma | Female | >=65 | I/II | Hormone Therapy | arimidex | SD | |
| CNRIP1 | SNV | Missense_Mutation | novel | c.433T>C | p.Tyr145His | p.Y145H | Q96F85 | protein_coding | deleterious(0) | probably_damaging(0.918) | TCGA-2W-A8YY-01 | Cervix | cervical & endocervical cancer | Female | <65 | I/II | Chemotherapy | cisplatin | CR |
| CNRIP1 | SNV | Missense_Mutation | rs373164214 | c.290N>T | p.Thr97Met | p.T97M | Q96F85 | protein_coding | deleterious(0) | probably_damaging(0.999) | TCGA-AA-3488-01 | Colorectum | colon adenocarcinoma | Male | <65 | III/IV | Unknown | Unknown | PD |
| CNRIP1 | SNV | Missense_Mutation | rs139324099 | c.304C>T | p.Arg102Trp | p.R102W | Q96F85 | protein_coding | deleterious(0) | probably_damaging(0.999) | TCGA-AA-3984-01 | Colorectum | colon adenocarcinoma | Female | <65 | I/II | Unknown | Unknown | SD |
| CNRIP1 | SNV | Missense_Mutation | novel | c.269N>G | p.Asp90Gly | p.D90G | Q96F85 | protein_coding | deleterious(0.03) | possibly_damaging(0.495) | TCGA-AZ-4315-01 | Colorectum | colon adenocarcinoma | Male | <65 | I/II | Unknown | Unknown | SD |
| CNRIP1 | SNV | Missense_Mutation | rs748240304 | c.91N>T | p.Arg31Cys | p.R31C | Q96F85 | protein_coding | deleterious(0) | probably_damaging(0.998) | TCGA-CK-5913-01 | Colorectum | colon adenocarcinoma | Female | <65 | I/II | Unknown | Unknown | SD |
| CNRIP1 | SNV | Missense_Mutation | novel | c.245N>T | p.Arg82Ile | p.R82I | Q96F85 | protein_coding | tolerated(0.18) | benign(0.022) | TCGA-A5-A0G2-01 | Endometrium | uterine corpus endometrioid carcinoma | Female | <65 | III/IV | Unknown | Unknown | SD |
| CNRIP1 | SNV | Missense_Mutation | rs377749015 | c.257N>T | p.Thr86Met | p.T86M | Q96F85 | protein_coding | deleterious(0.01) | possibly_damaging(0.71) | TCGA-A5-A0VP-01 | Endometrium | uterine corpus endometrioid carcinoma | Female | >=65 | I/II | Unknown | Unknown | SD |
| CNRIP1 | SNV | Missense_Mutation | novel | c.25N>T | p.Arg9Cys | p.R9C | Q96F85 | protein_coding | deleterious(0) | possibly_damaging(0.649) | TCGA-AJ-A3EL-01 | Endometrium | uterine corpus endometrioid carcinoma | Female | <65 | I/II | Unknown | Unknown | SD |
| Page: 1 2 3 |
Top |
Related drugs of malignant transformation related genes |
| Identification of chemicals and drugs interact with genes involved in malignant transfromation |
| (DGIdb 4.0) |
| Entrez ID | Symbol | Category | Interaction Types | Drug Claim Name | Drug Name | PMIDs |
| Page: 1 |

Copyright 2023-Present -The University of Texas Health Science Center at Houston |