
|
|||||
|
 | |
| |
| |
| |
| |
| |
|
Gene: CNPY4 |
Gene summary for CNPY4 |
| Gene information | Species | Human | Gene symbol | CNPY4 | Gene ID | 245812 |
| Gene name | canopy FGF signaling regulator 4 | |
| Gene Alias | PRAT4B | |
| Cytomap | 7q22.1 | |
| Gene Type | protein-coding | GO ID | GO:0008104 | UniProtAcc | Q8N129 |
Top |
Malignant transformation analysis |
| Identification of the aberrant gene expression in precancerous and cancerous lesions by comparing the gene expression of stem-like cells in diseased tissues with normal stem cells |
| Entrez ID | Symbol | Replicates | Species | Organ | Tissue | Adj P-value | Log2FC | Malignancy |
| 245812 | CNPY4 | LZE24T | Human | Esophagus | ESCC | 4.07e-02 | 1.31e-01 | 0.0596 |
| 245812 | CNPY4 | P2T-E | Human | Esophagus | ESCC | 6.20e-13 | 2.65e-01 | 0.1177 |
| 245812 | CNPY4 | P4T-E | Human | Esophagus | ESCC | 1.97e-10 | 2.86e-01 | 0.1323 |
| 245812 | CNPY4 | P5T-E | Human | Esophagus | ESCC | 9.29e-05 | 8.52e-02 | 0.1327 |
| 245812 | CNPY4 | P8T-E | Human | Esophagus | ESCC | 6.98e-07 | 1.52e-01 | 0.0889 |
| 245812 | CNPY4 | P9T-E | Human | Esophagus | ESCC | 1.62e-05 | 2.10e-01 | 0.1131 |
| 245812 | CNPY4 | P10T-E | Human | Esophagus | ESCC | 8.93e-06 | 1.66e-01 | 0.116 |
| 245812 | CNPY4 | P11T-E | Human | Esophagus | ESCC | 1.67e-08 | 3.10e-01 | 0.1426 |
| 245812 | CNPY4 | P12T-E | Human | Esophagus | ESCC | 3.18e-14 | 2.73e-01 | 0.1122 |
| 245812 | CNPY4 | P15T-E | Human | Esophagus | ESCC | 4.64e-06 | 1.75e-01 | 0.1149 |
| 245812 | CNPY4 | P16T-E | Human | Esophagus | ESCC | 4.56e-24 | 5.62e-01 | 0.1153 |
| 245812 | CNPY4 | P17T-E | Human | Esophagus | ESCC | 1.31e-04 | 2.26e-01 | 0.1278 |
| 245812 | CNPY4 | P19T-E | Human | Esophagus | ESCC | 3.48e-05 | 4.23e-01 | 0.1662 |
| 245812 | CNPY4 | P20T-E | Human | Esophagus | ESCC | 1.30e-11 | 2.73e-01 | 0.1124 |
| 245812 | CNPY4 | P21T-E | Human | Esophagus | ESCC | 1.54e-15 | 3.85e-01 | 0.1617 |
| 245812 | CNPY4 | P22T-E | Human | Esophagus | ESCC | 4.18e-11 | 2.06e-01 | 0.1236 |
| 245812 | CNPY4 | P23T-E | Human | Esophagus | ESCC | 8.90e-15 | 4.01e-01 | 0.108 |
| 245812 | CNPY4 | P24T-E | Human | Esophagus | ESCC | 8.98e-03 | 1.18e-01 | 0.1287 |
| 245812 | CNPY4 | P26T-E | Human | Esophagus | ESCC | 2.18e-08 | 2.09e-01 | 0.1276 |
| 245812 | CNPY4 | P27T-E | Human | Esophagus | ESCC | 1.93e-10 | 2.28e-01 | 0.1055 |
| Page: 1 2 3 |
| Tissue | Expression Dynamics | Abbreviation |
| Esophagus | 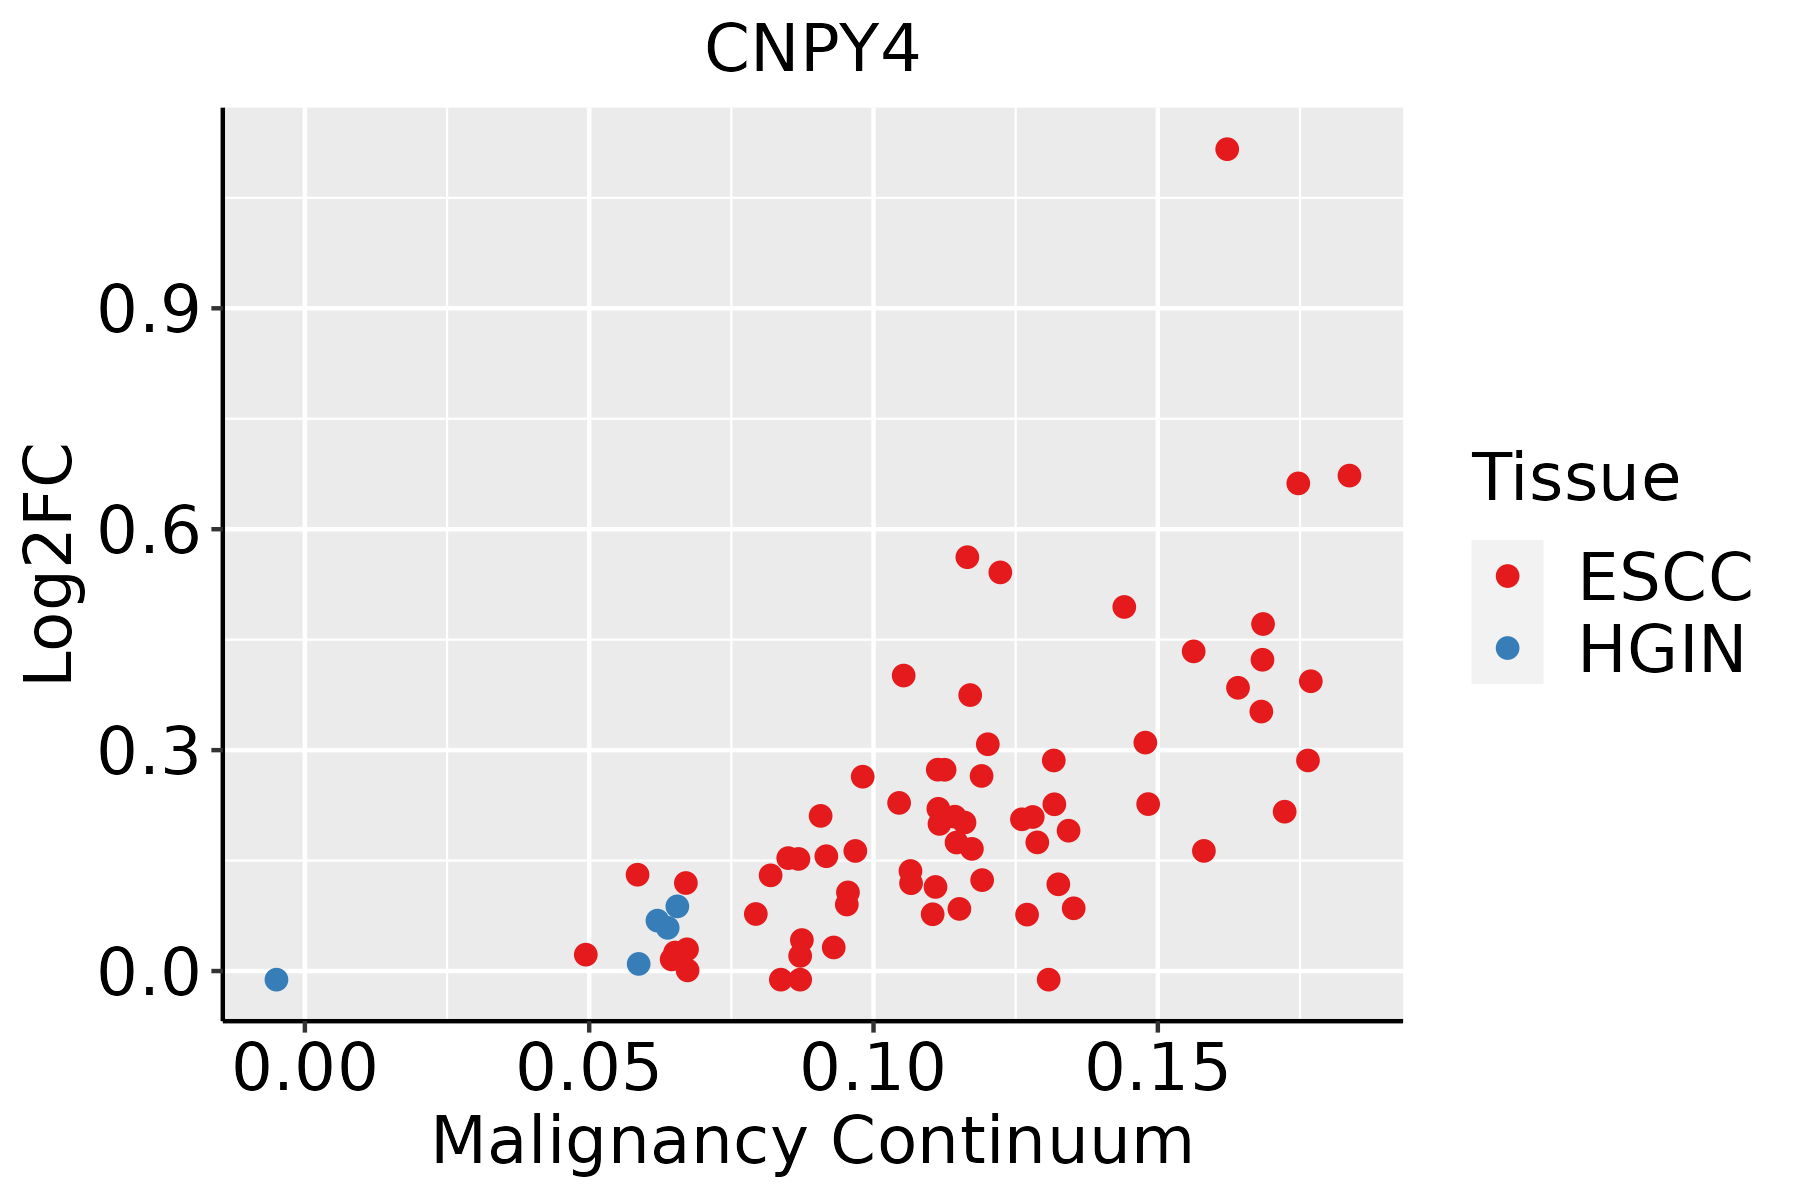 | ESCC: Esophageal squamous cell carcinoma |
| HGIN: High-grade intraepithelial neoplasias | ||
| LGIN: Low-grade intraepithelial neoplasias | ||
| Liver | 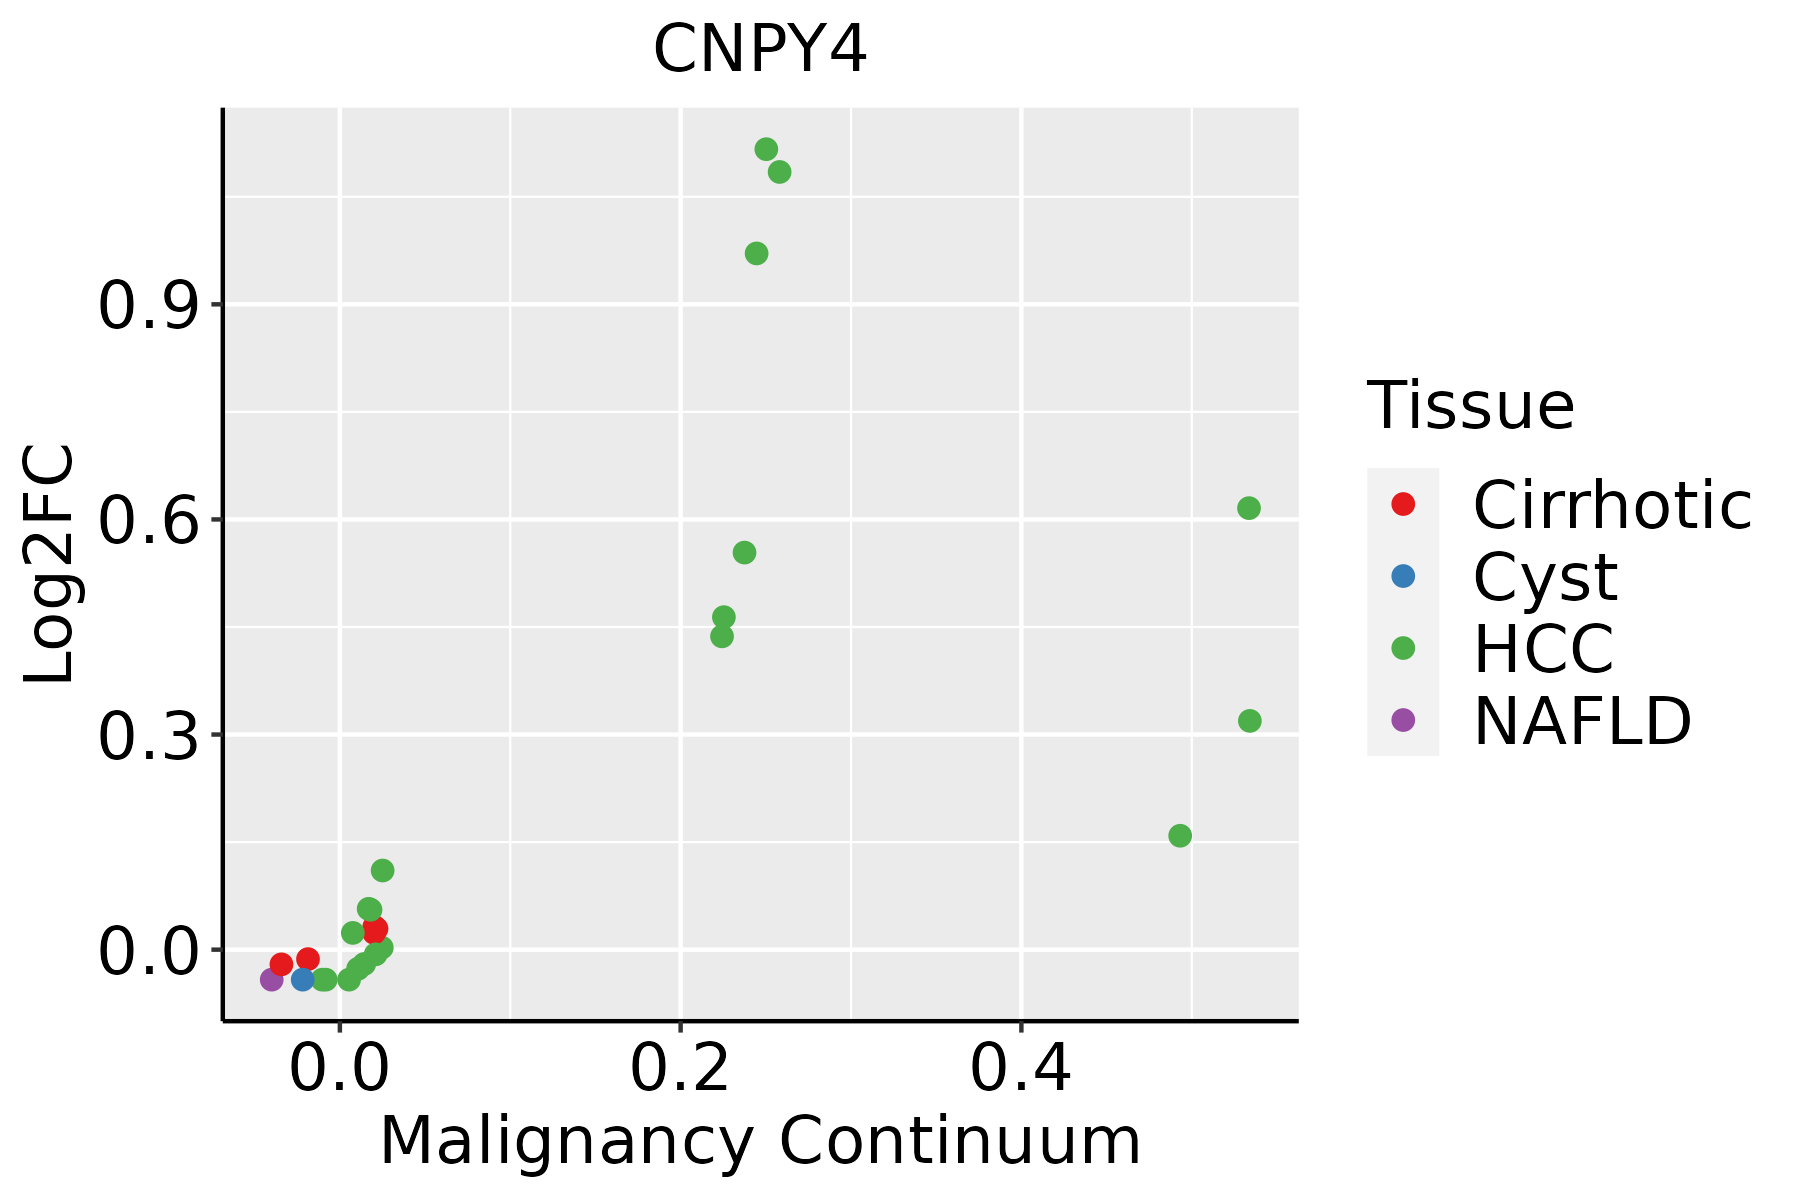 | HCC: Hepatocellular carcinoma |
| NAFLD: Non-alcoholic fatty liver disease |
| ∗log2FC in expression of this searched gene in stem-like cells from each diseased tissue sample relative to stem-like cells in normal samples in each tissue plotted against the malignancy continuum. Samples are colored based on if they are from different disease stage. |
Top |
Malignant transformation related pathway analysis |
| Find out the enriched GO biological processes and KEGG pathways involved in transition from healthy to precancer to cancer |
| Tissue | Disease Stage | Enriched GO biological Processes |
| Colorectum | AD |  |
| Colorectum | SER |  |
| Colorectum | MSS |  |
| Colorectum | MSI-H |  |
| Colorectum | FAP |  |
| ∗Top 15 enriched GO BP terms are showed in the bar plot of each disease state in each tissue. Each row represents a significant GO biological process which is colored according to the -log10(p.adjust). |
| Page: 1 2 3 4 5 6 7 8 9 |
| GO ID | Tissue | Disease Stage | Description | Gene Ratio | Bg Ratio | pvalue | p.adjust | Count |
| GO:1903829111 | Esophagus | ESCC | positive regulation of cellular protein localization | 199/8552 | 276/18723 | 2.99e-19 | 3.45e-17 | 199 |
| GO:0072659110 | Esophagus | ESCC | protein localization to plasma membrane | 193/8552 | 284/18723 | 1.95e-14 | 1.03e-12 | 193 |
| GO:199077819 | Esophagus | ESCC | protein localization to cell periphery | 217/8552 | 333/18723 | 4.08e-13 | 1.88e-11 | 217 |
| GO:190547519 | Esophagus | ESCC | regulation of protein localization to membrane | 117/8552 | 175/18723 | 1.14e-08 | 2.26e-07 | 117 |
| GO:190437519 | Esophagus | ESCC | regulation of protein localization to cell periphery | 85/8552 | 125/18723 | 3.63e-07 | 5.06e-06 | 85 |
| GO:1903076110 | Esophagus | ESCC | regulation of protein localization to plasma membrane | 72/8552 | 104/18723 | 9.74e-07 | 1.23e-05 | 72 |
| GO:190547719 | Esophagus | ESCC | positive regulation of protein localization to membrane | 73/8552 | 106/18723 | 1.13e-06 | 1.40e-05 | 73 |
| GO:190437719 | Esophagus | ESCC | positive regulation of protein localization to cell periphery | 47/8552 | 69/18723 | 1.37e-04 | 9.27e-04 | 47 |
| GO:190307817 | Esophagus | ESCC | positive regulation of protein localization to plasma membrane | 43/8552 | 62/18723 | 1.38e-04 | 9.35e-04 | 43 |
| GO:190382922 | Liver | HCC | positive regulation of cellular protein localization | 199/7958 | 276/18723 | 1.15e-23 | 2.62e-21 | 199 |
| GO:007265921 | Liver | HCC | protein localization to plasma membrane | 177/7958 | 284/18723 | 1.02e-11 | 4.18e-10 | 177 |
| GO:199077821 | Liver | HCC | protein localization to cell periphery | 200/7958 | 333/18723 | 6.07e-11 | 2.23e-09 | 200 |
| GO:190547511 | Liver | HCC | regulation of protein localization to membrane | 113/7958 | 175/18723 | 2.90e-09 | 7.78e-08 | 113 |
| GO:190437521 | Liver | HCC | regulation of protein localization to cell periphery | 83/7958 | 125/18723 | 5.60e-08 | 1.19e-06 | 83 |
| GO:190307621 | Liver | HCC | regulation of protein localization to plasma membrane | 69/7958 | 104/18723 | 7.58e-07 | 1.17e-05 | 69 |
| GO:190547711 | Liver | HCC | positive regulation of protein localization to membrane | 68/7958 | 106/18723 | 5.50e-06 | 6.82e-05 | 68 |
| GO:190437712 | Liver | HCC | positive regulation of protein localization to cell periphery | 45/7958 | 69/18723 | 1.16e-04 | 9.80e-04 | 45 |
| GO:190307812 | Liver | HCC | positive regulation of protein localization to plasma membrane | 40/7958 | 62/18723 | 3.84e-04 | 2.62e-03 | 40 |
| Page: 1 |
| Pathway ID | Tissue | Disease Stage | Description | Gene Ratio | Bg Ratio | pvalue | p.adjust | qvalue | Count |
| Page: 1 |
Top |
Cell-cell communication analysis |
| Identification of potential cell-cell interactions between two cell types and their ligand-receptor pairs for different disease states |
| Ligand | Receptor | LRpair | Pathway | Tissue | Disease Stage |
| Page: 1 |
Top |
Single-cell gene regulatory network inference analysis |
| Find out the significant the regulons (TFs) and the target genes of each regulon across cell types for different disease states |
| TF | Cell Type | Tissue | Disease Stage | Target Gene | RSS | Regulon Activity |
| ∗The dot plots of a searched regulon are shown for all cell subpopulations in each disease state of each tissue based on the regulon specific score inferred using pySCENIC and by calculating the average expression. |
| Page: 1 |
Top |
Somatic mutation of malignant transformation related genes |
| Annotation of somatic variants for genes involved in malignant transformation |
| Hugo Symbol | Variant Class | Variant Classification | dbSNP RS | HGVSc | HGVSp | HGVSp Short | SWISSPROT | BIOTYPE | SIFT | PolyPhen | Tumor Sample Barcode | Tissue | Histology | Sex | Age | Stage | Therapy Types | Drugs | Outcome |
| CNPY4 | SNV | Missense_Mutation | c.160N>G | p.Arg54Gly | p.R54G | Q8N129 | protein_coding | deleterious(0) | benign(0.361) | TCGA-GM-A2DO-01 | Breast | breast invasive carcinoma | Female | <65 | I/II | Hormone Therapy | tamoxiphen | CR | |
| CNPY4 | SNV | Missense_Mutation | c.205G>T | p.Asp69Tyr | p.D69Y | Q8N129 | protein_coding | deleterious(0) | probably_damaging(1) | TCGA-AG-A014-01 | Colorectum | rectum adenocarcinoma | Male | >=65 | I/II | Unknown | Unknown | SD | |
| CNPY4 | insertion | Frame_Shift_Ins | novel | c.41dupT | p.Leu14PhefsTer17 | p.L14Ffs*17 | Q8N129 | protein_coding | TCGA-G4-6588-01 | Colorectum | colon adenocarcinoma | Female | <65 | I/II | Unknown | Unknown | SD | ||
| CNPY4 | SNV | Missense_Mutation | novel | c.565C>T | p.Leu189Phe | p.L189F | Q8N129 | protein_coding | deleterious(0) | probably_damaging(0.999) | TCGA-A5-A0G1-01 | Endometrium | uterine corpus endometrioid carcinoma | Female | >=65 | I/II | Unknown | Unknown | SD |
| CNPY4 | SNV | Missense_Mutation | novel | c.565N>T | p.Leu189Phe | p.L189F | Q8N129 | protein_coding | deleterious(0) | probably_damaging(0.999) | TCGA-A5-A0GG-01 | Endometrium | uterine corpus endometrioid carcinoma | Female | >=65 | I/II | Unknown | Unknown | SD |
| CNPY4 | SNV | Missense_Mutation | novel | c.238A>C | p.Ser80Arg | p.S80R | Q8N129 | protein_coding | tolerated(0.69) | benign(0.226) | TCGA-A5-A2K5-01 | Endometrium | uterine corpus endometrioid carcinoma | Female | >=65 | I/II | Unknown | Unknown | SD |
| CNPY4 | SNV | Missense_Mutation | novel | c.322G>T | p.Gly108Cys | p.G108C | Q8N129 | protein_coding | deleterious(0) | probably_damaging(1) | TCGA-AP-A051-01 | Endometrium | uterine corpus endometrioid carcinoma | Female | >=65 | I/II | Unknown | Unknown | SD |
| CNPY4 | SNV | Missense_Mutation | novel | c.254N>T | p.Arg85Met | p.R85M | Q8N129 | protein_coding | deleterious(0) | probably_damaging(0.999) | TCGA-AP-A1DK-01 | Endometrium | uterine corpus endometrioid carcinoma | Female | <65 | I/II | Unknown | Unknown | SD |
| CNPY4 | SNV | Missense_Mutation | rs757977425 | c.526N>A | p.Glu176Lys | p.E176K | Q8N129 | protein_coding | tolerated(0.1) | benign(0.423) | TCGA-B5-A121-01 | Endometrium | uterine corpus endometrioid carcinoma | Female | <65 | III/IV | Unknown | Unknown | SD |
| CNPY4 | SNV | Missense_Mutation | novel | c.704C>T | p.Thr235Ile | p.T235I | Q8N129 | protein_coding | tolerated_low_confidence(0.14) | benign(0.003) | TCGA-B5-A3FC-01 | Endometrium | uterine corpus endometrioid carcinoma | Female | <65 | I/II | Unknown | Unknown | SD |
| Page: 1 2 3 |
Top |
Related drugs of malignant transformation related genes |
| Identification of chemicals and drugs interact with genes involved in malignant transfromation |
| (DGIdb 4.0) |
| Entrez ID | Symbol | Category | Interaction Types | Drug Claim Name | Drug Name | PMIDs |
| 245812 | CNPY4 | NA | Tumor necrosis factor alpha (TNF-alpha) inhibitors | 24776844 |
| Page: 1 |

Copyright 2023-Present -The University of Texas Health Science Center at Houston |