
|
|||||
|
 | |
| |
| |
| |
| |
| |
|
Gene: CNP |
Gene summary for CNP |
| Gene information | Species | Human | Gene symbol | CNP | Gene ID | 1267 |
| Gene name | 2',3'-cyclic nucleotide 3' phosphodiesterase | |
| Gene Alias | CNP1 | |
| Cytomap | 17q21.2 | |
| Gene Type | protein-coding | GO ID | GO:0000226 | UniProtAcc | A0A024R1T5 |
Top |
Malignant transformation analysis |
| Identification of the aberrant gene expression in precancerous and cancerous lesions by comparing the gene expression of stem-like cells in diseased tissues with normal stem cells |
| Entrez ID | Symbol | Replicates | Species | Organ | Tissue | Adj P-value | Log2FC | Malignancy |
| 1267 | CNP | LZE4T | Human | Esophagus | ESCC | 7.35e-12 | 1.88e-01 | 0.0811 |
| 1267 | CNP | LZE7T | Human | Esophagus | ESCC | 1.59e-07 | 3.32e-01 | 0.0667 |
| 1267 | CNP | LZE8T | Human | Esophagus | ESCC | 1.66e-08 | 1.97e-01 | 0.067 |
| 1267 | CNP | LZE20T | Human | Esophagus | ESCC | 8.72e-05 | 1.62e-01 | 0.0662 |
| 1267 | CNP | LZE22T | Human | Esophagus | ESCC | 2.75e-02 | 5.22e-01 | 0.068 |
| 1267 | CNP | LZE24T | Human | Esophagus | ESCC | 1.32e-17 | 5.20e-01 | 0.0596 |
| 1267 | CNP | LZE6T | Human | Esophagus | ESCC | 1.67e-04 | 1.06e-01 | 0.0845 |
| 1267 | CNP | P1T-E | Human | Esophagus | ESCC | 1.55e-14 | 4.55e-01 | 0.0875 |
| 1267 | CNP | P2T-E | Human | Esophagus | ESCC | 6.11e-36 | 6.70e-01 | 0.1177 |
| 1267 | CNP | P4T-E | Human | Esophagus | ESCC | 1.31e-26 | 7.12e-01 | 0.1323 |
| 1267 | CNP | P5T-E | Human | Esophagus | ESCC | 1.12e-18 | 3.27e-01 | 0.1327 |
| 1267 | CNP | P8T-E | Human | Esophagus | ESCC | 2.20e-19 | 3.24e-01 | 0.0889 |
| 1267 | CNP | P9T-E | Human | Esophagus | ESCC | 7.75e-18 | 3.65e-01 | 0.1131 |
| 1267 | CNP | P10T-E | Human | Esophagus | ESCC | 8.47e-15 | 3.08e-01 | 0.116 |
| 1267 | CNP | P11T-E | Human | Esophagus | ESCC | 2.88e-29 | 1.35e+00 | 0.1426 |
| 1267 | CNP | P12T-E | Human | Esophagus | ESCC | 3.03e-27 | 6.01e-01 | 0.1122 |
| 1267 | CNP | P15T-E | Human | Esophagus | ESCC | 2.02e-27 | 5.56e-01 | 0.1149 |
| 1267 | CNP | P16T-E | Human | Esophagus | ESCC | 1.26e-29 | 5.49e-01 | 0.1153 |
| 1267 | CNP | P17T-E | Human | Esophagus | ESCC | 1.36e-06 | 5.96e-01 | 0.1278 |
| 1267 | CNP | P19T-E | Human | Esophagus | ESCC | 2.58e-16 | 1.20e+00 | 0.1662 |
| Page: 1 2 3 4 5 6 |
| Tissue | Expression Dynamics | Abbreviation |
| Esophagus | 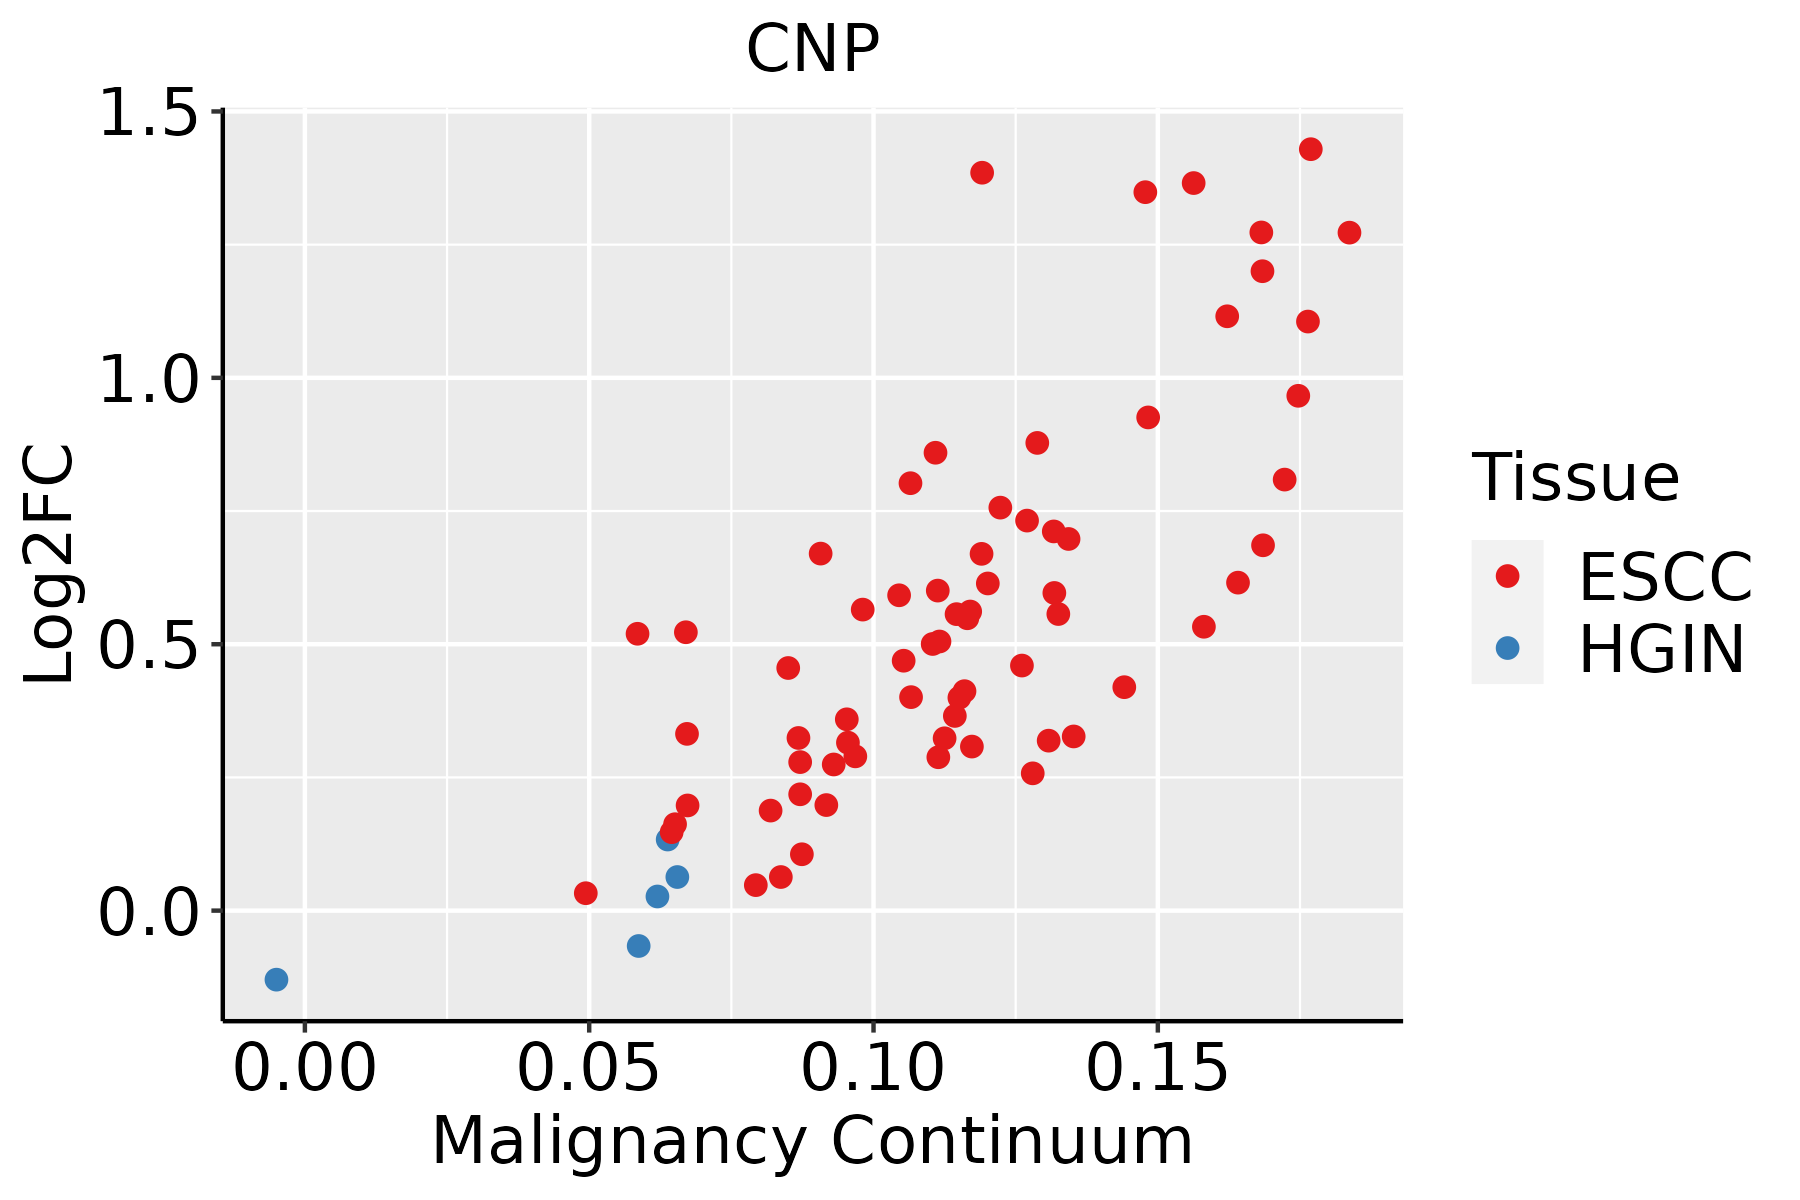 | ESCC: Esophageal squamous cell carcinoma |
| HGIN: High-grade intraepithelial neoplasias | ||
| LGIN: Low-grade intraepithelial neoplasias | ||
| Liver |  | HCC: Hepatocellular carcinoma |
| NAFLD: Non-alcoholic fatty liver disease | ||
| Oral Cavity | 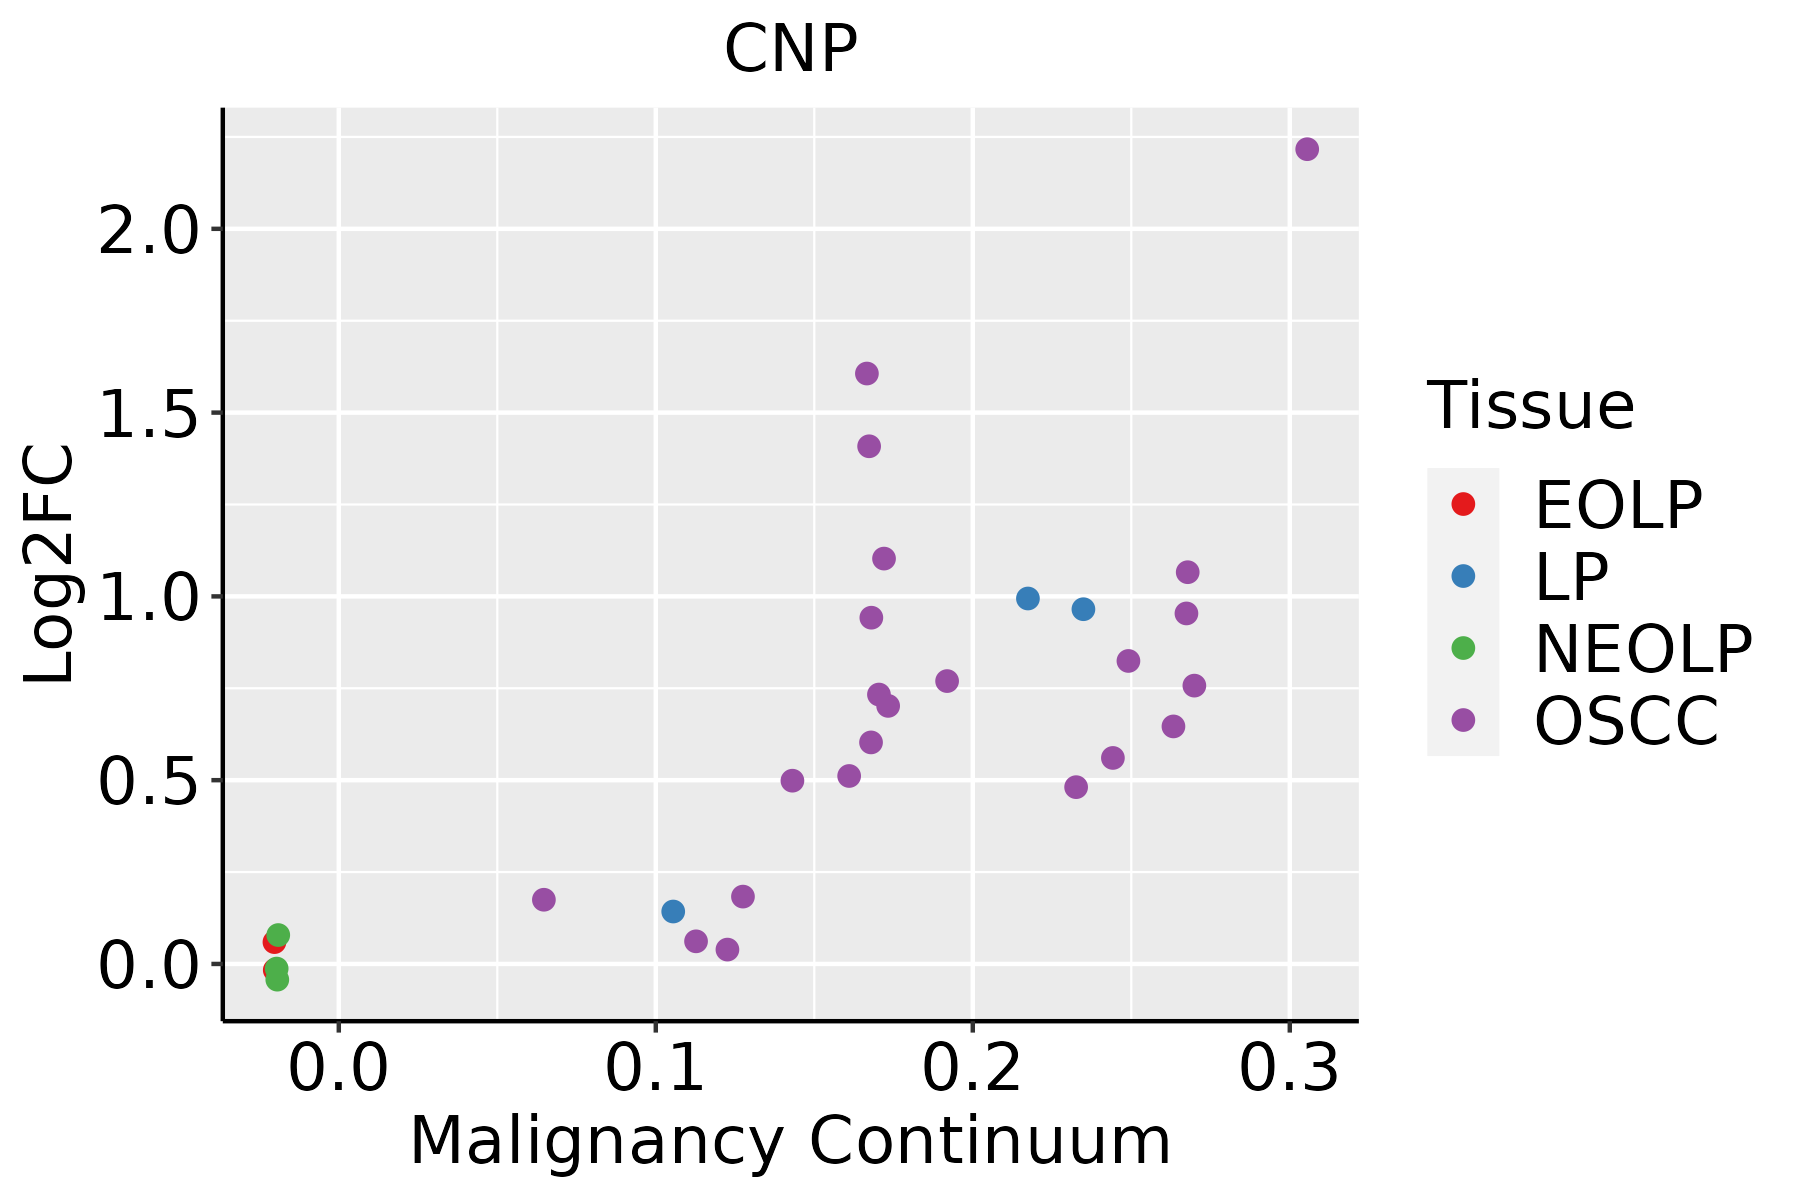 | EOLP: Erosive Oral lichen planus |
| LP: leukoplakia | ||
| NEOLP: Non-erosive oral lichen planus | ||
| OSCC: Oral squamous cell carcinoma | ||
| Skin | 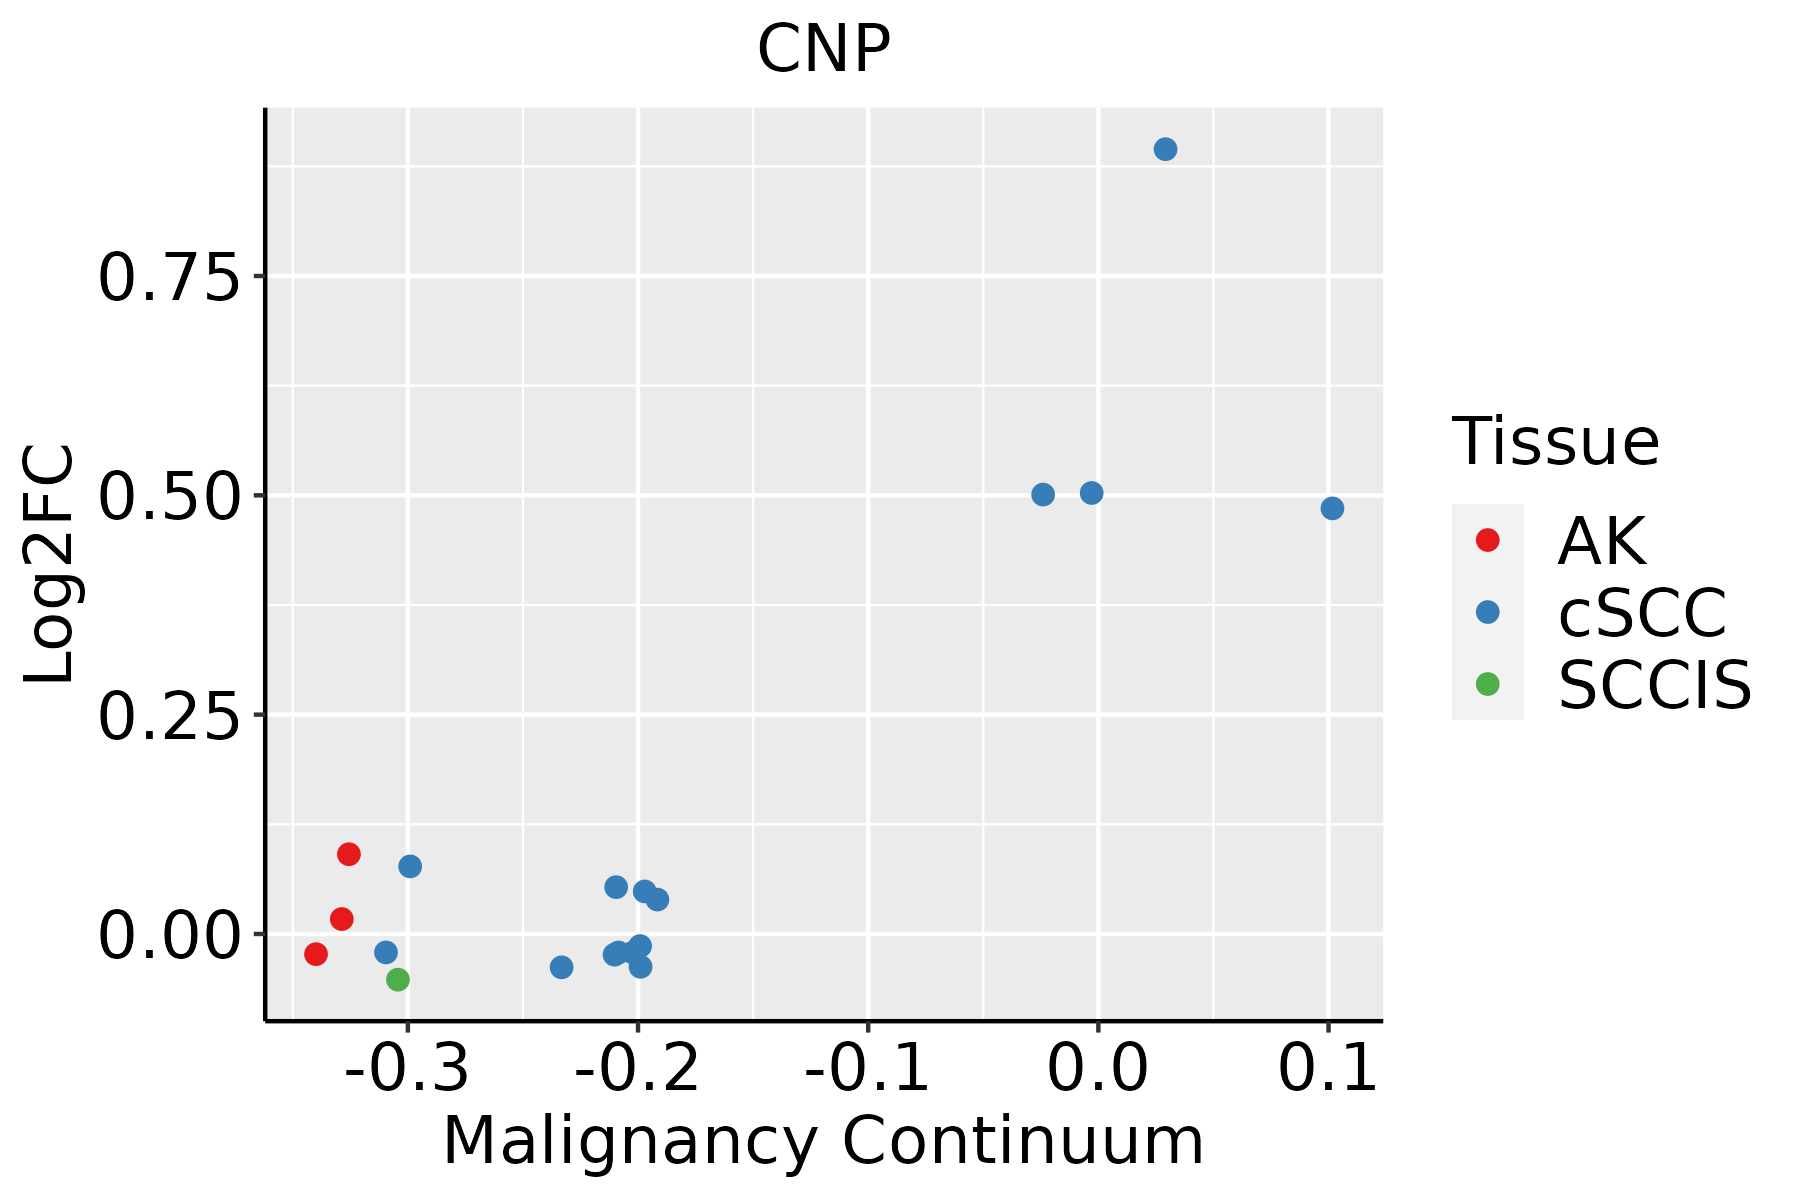 | AK: Actinic keratosis |
| cSCC: Cutaneous squamous cell carcinoma | ||
| SCCIS:squamous cell carcinoma in situ | ||
| Thyroid | 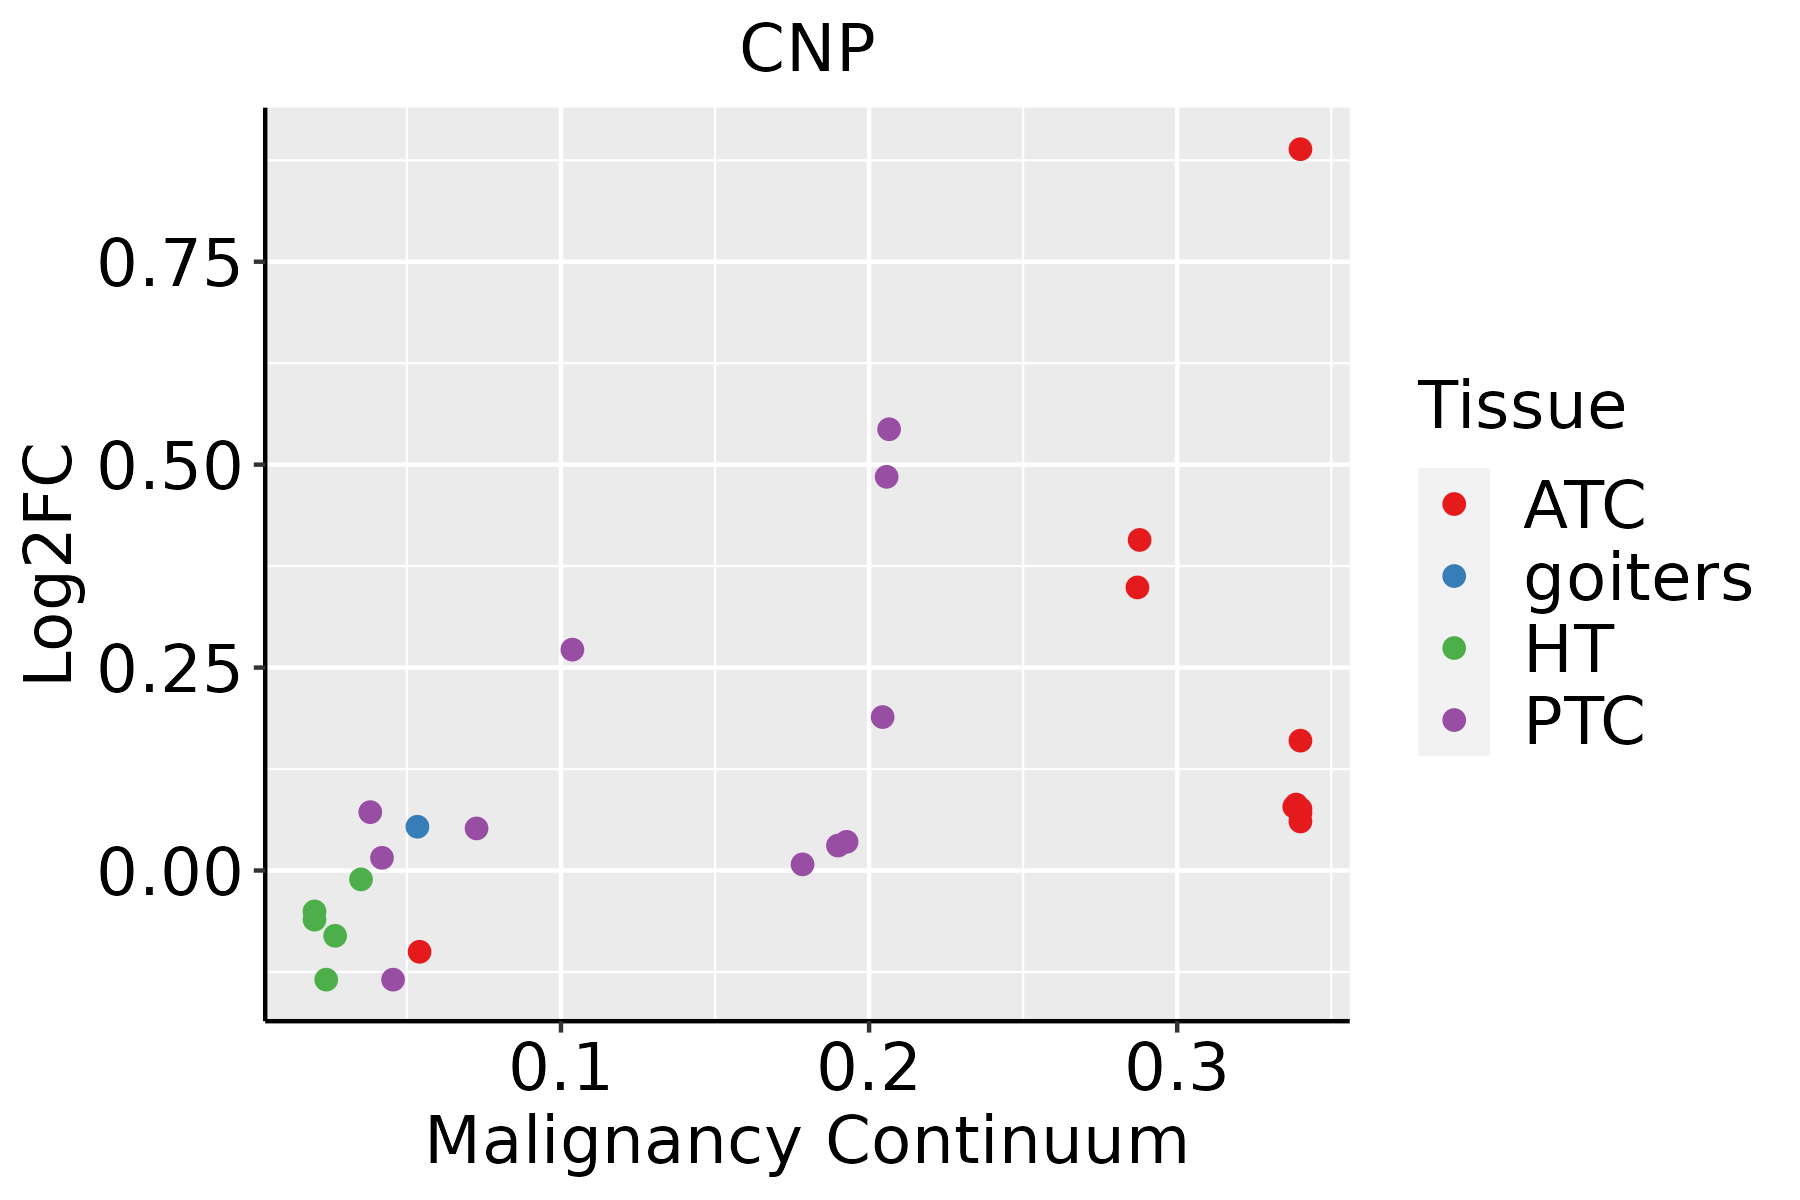 | ATC: Anaplastic thyroid cancer |
| HT: Hashimoto's thyroiditis | ||
| PTC: Papillary thyroid cancer |
| ∗log2FC in expression of this searched gene in stem-like cells from each diseased tissue sample relative to stem-like cells in normal samples in each tissue plotted against the malignancy continuum. Samples are colored based on if they are from different disease stage. |
Top |
Malignant transformation related pathway analysis |
| Find out the enriched GO biological processes and KEGG pathways involved in transition from healthy to precancer to cancer |
| Tissue | Disease Stage | Enriched GO biological Processes |
| Colorectum | AD |  |
| Colorectum | SER |  |
| Colorectum | MSS |  |
| Colorectum | MSI-H |  |
| Colorectum | FAP |  |
| ∗Top 15 enriched GO BP terms are showed in the bar plot of each disease state in each tissue. Each row represents a significant GO biological process which is colored according to the -log10(p.adjust). |
| Page: 1 2 3 4 5 6 7 8 9 |
| GO ID | Tissue | Disease Stage | Description | Gene Ratio | Bg Ratio | pvalue | p.adjust | Count |
| GO:00104989 | Breast | Precancer | proteasomal protein catabolic process | 58/1080 | 490/18723 | 1.54e-07 | 8.05e-06 | 58 |
| GO:00431619 | Breast | Precancer | proteasome-mediated ubiquitin-dependent protein catabolic process | 42/1080 | 412/18723 | 2.49e-04 | 3.72e-03 | 42 |
| GO:001049814 | Breast | IDC | proteasomal protein catabolic process | 75/1434 | 490/18723 | 5.59e-09 | 4.41e-07 | 75 |
| GO:004316114 | Breast | IDC | proteasome-mediated ubiquitin-dependent protein catabolic process | 57/1434 | 412/18723 | 9.55e-06 | 2.68e-04 | 57 |
| GO:001049824 | Breast | DCIS | proteasomal protein catabolic process | 75/1390 | 490/18723 | 1.44e-09 | 1.40e-07 | 75 |
| GO:004316124 | Breast | DCIS | proteasome-mediated ubiquitin-dependent protein catabolic process | 57/1390 | 412/18723 | 3.76e-06 | 1.16e-04 | 57 |
| GO:0010498 | Colorectum | AD | proteasomal protein catabolic process | 174/3918 | 490/18723 | 3.18e-14 | 7.66e-12 | 174 |
| GO:0043161 | Colorectum | AD | proteasome-mediated ubiquitin-dependent protein catabolic process | 141/3918 | 412/18723 | 1.77e-10 | 1.68e-08 | 141 |
| GO:0071900 | Colorectum | AD | regulation of protein serine/threonine kinase activity | 98/3918 | 359/18723 | 2.18e-03 | 1.73e-02 | 98 |
| GO:00104981 | Colorectum | SER | proteasomal protein catabolic process | 132/2897 | 490/18723 | 3.08e-11 | 5.55e-09 | 132 |
| GO:00431611 | Colorectum | SER | proteasome-mediated ubiquitin-dependent protein catabolic process | 105/2897 | 412/18723 | 7.48e-08 | 4.70e-06 | 105 |
| GO:00719001 | Colorectum | SER | regulation of protein serine/threonine kinase activity | 74/2897 | 359/18723 | 5.22e-03 | 3.96e-02 | 74 |
| GO:00104982 | Colorectum | MSS | proteasomal protein catabolic process | 157/3467 | 490/18723 | 2.39e-13 | 5.25e-11 | 157 |
| GO:00431612 | Colorectum | MSS | proteasome-mediated ubiquitin-dependent protein catabolic process | 127/3467 | 412/18723 | 7.70e-10 | 6.32e-08 | 127 |
| GO:00719002 | Colorectum | MSS | regulation of protein serine/threonine kinase activity | 93/3467 | 359/18723 | 2.98e-04 | 3.91e-03 | 93 |
| GO:00104983 | Colorectum | MSI-H | proteasomal protein catabolic process | 71/1319 | 490/18723 | 4.67e-09 | 6.03e-07 | 71 |
| GO:00431613 | Colorectum | MSI-H | proteasome-mediated ubiquitin-dependent protein catabolic process | 53/1319 | 412/18723 | 1.51e-05 | 6.62e-04 | 53 |
| GO:00431614 | Colorectum | FAP | proteasome-mediated ubiquitin-dependent protein catabolic process | 98/2622 | 412/18723 | 5.41e-08 | 4.20e-06 | 98 |
| GO:00104984 | Colorectum | FAP | proteasomal protein catabolic process | 110/2622 | 490/18723 | 2.12e-07 | 1.26e-05 | 110 |
| GO:001049816 | Endometrium | AEH | proteasomal protein catabolic process | 108/2100 | 490/18723 | 2.73e-12 | 4.67e-10 | 108 |
| Page: 1 2 3 4 5 6 7 8 9 10 11 12 13 |
| Pathway ID | Tissue | Disease Stage | Description | Gene Ratio | Bg Ratio | pvalue | p.adjust | qvalue | Count |
| Page: 1 |
Top |
Cell-cell communication analysis |
| Identification of potential cell-cell interactions between two cell types and their ligand-receptor pairs for different disease states |
| Ligand | Receptor | LRpair | Pathway | Tissue | Disease Stage |
| Page: 1 |
Top |
Single-cell gene regulatory network inference analysis |
| Find out the significant the regulons (TFs) and the target genes of each regulon across cell types for different disease states |
| TF | Cell Type | Tissue | Disease Stage | Target Gene | RSS | Regulon Activity |
| ∗The dot plots of a searched regulon are shown for all cell subpopulations in each disease state of each tissue based on the regulon specific score inferred using pySCENIC and by calculating the average expression. |
| Page: 1 |
Top |
Somatic mutation of malignant transformation related genes |
| Annotation of somatic variants for genes involved in malignant transformation |
| Hugo Symbol | Variant Class | Variant Classification | dbSNP RS | HGVSc | HGVSp | HGVSp Short | SWISSPROT | BIOTYPE | SIFT | PolyPhen | Tumor Sample Barcode | Tissue | Histology | Sex | Age | Stage | Therapy Types | Drugs | Outcome |
| CNP | SNV | Missense_Mutation | c.734N>A | p.Arg245Lys | p.R245K | P09543 | protein_coding | tolerated(0.38) | benign(0.003) | TCGA-B6-A0I5-01 | Breast | breast invasive carcinoma | Female | <65 | I/II | Unknown | Unknown | SD | |
| CNP | insertion | Nonsense_Mutation | novel | c.261_262insTCTAGGGACTAGGGGTAAGGCCGGCGGGGAGCCCGCGA | p.Ile88SerfsTer4 | p.I88Sfs*4 | P09543 | protein_coding | TCGA-A8-A0A9-01 | Breast | breast invasive carcinoma | Female | >=65 | I/II | Hormone Therapy | anastrozole | SD | ||
| CNP | deletion | In_Frame_Del | c.900_911delNNNNNNNNNNNN | p.Glu301_Glu304del | p.E301_E304del | P09543 | protein_coding | TCGA-BH-A0BZ-01 | Breast | breast invasive carcinoma | Female | <65 | III/IV | Chemotherapy | doxorubicin | CR | |||
| CNP | SNV | Missense_Mutation | novel | c.715N>A | p.Val239Ile | p.V239I | P09543 | protein_coding | tolerated(0.18) | benign(0.007) | TCGA-2W-A8YY-01 | Cervix | cervical & endocervical cancer | Female | <65 | I/II | Chemotherapy | cisplatin | CR |
| CNP | SNV | Missense_Mutation | c.629N>C | p.Leu210Pro | p.L210P | P09543 | protein_coding | deleterious(0.01) | probably_damaging(0.984) | TCGA-AA-3492-01 | Colorectum | colon adenocarcinoma | Female | >=65 | I/II | Unknown | Unknown | SD | |
| CNP | SNV | Missense_Mutation | c.650A>G | p.Lys217Arg | p.K217R | P09543 | protein_coding | tolerated(0.13) | benign(0.009) | TCGA-AM-5821-01 | Colorectum | colon adenocarcinoma | Female | >=65 | I/II | Unknown | Unknown | SD | |
| CNP | SNV | Missense_Mutation | novel | c.20N>A | p.Arg7Gln | p.R7Q | P09543 | protein_coding | deleterious_low_confidence(0.04) | benign(0.075) | TCGA-CA-6717-01 | Colorectum | colon adenocarcinoma | Male | <65 | I/II | Chemotherapy | oxaliplatin | CR |
| CNP | SNV | Missense_Mutation | c.671G>A | p.Arg224Gln | p.R224Q | P09543 | protein_coding | tolerated(0.63) | benign(0) | TCGA-D5-6930-01 | Colorectum | colon adenocarcinoma | Male | >=65 | I/II | Unknown | Unknown | SD | |
| CNP | SNV | Missense_Mutation | rs782078035 | c.848N>T | p.Thr283Met | p.T283M | P09543 | protein_coding | tolerated(0.16) | benign(0.075) | TCGA-F4-6703-01 | Colorectum | colon adenocarcinoma | Male | <65 | I/II | Unknown | Unknown | SD |
| CNP | SNV | Missense_Mutation | novel | c.380N>C | p.Glu127Ala | p.E127A | P09543 | protein_coding | tolerated(0.1) | possibly_damaging(0.523) | TCGA-F5-6814-01 | Colorectum | rectum adenocarcinoma | Male | <65 | I/II | Unknown | Unknown | SD |
| Page: 1 2 3 |
Top |
Related drugs of malignant transformation related genes |
| Identification of chemicals and drugs interact with genes involved in malignant transfromation |
| (DGIdb 4.0) |
| Entrez ID | Symbol | Category | Interaction Types | Drug Claim Name | Drug Name | PMIDs |
| Page: 1 |

Copyright 2023-Present -The University of Texas Health Science Center at Houston |