
|
|||||
|
 | |
| |
| |
| |
| |
| |
|
Gene: CNOT7 |
Gene summary for CNOT7 |
| Gene information | Species | Human | Gene symbol | CNOT7 | Gene ID | 29883 |
| Gene name | CCR4-NOT transcription complex subunit 7 | |
| Gene Alias | CAF-1 | |
| Cytomap | 8p22 | |
| Gene Type | protein-coding | GO ID | GO:0000288 | UniProtAcc | Q9UIV1 |
Top |
Malignant transformation analysis |
| Identification of the aberrant gene expression in precancerous and cancerous lesions by comparing the gene expression of stem-like cells in diseased tissues with normal stem cells |
| Entrez ID | Symbol | Replicates | Species | Organ | Tissue | Adj P-value | Log2FC | Malignancy |
| 29883 | CNOT7 | GSM4909281 | Human | Breast | IDC | 2.52e-13 | 5.59e-01 | 0.21 |
| 29883 | CNOT7 | GSM4909285 | Human | Breast | IDC | 4.17e-02 | 2.64e-01 | 0.21 |
| 29883 | CNOT7 | GSM4909294 | Human | Breast | IDC | 2.52e-04 | -1.94e-01 | 0.2022 |
| 29883 | CNOT7 | GSM4909296 | Human | Breast | IDC | 2.76e-05 | -1.01e-01 | 0.1524 |
| 29883 | CNOT7 | GSM4909297 | Human | Breast | IDC | 1.92e-06 | -6.49e-02 | 0.1517 |
| 29883 | CNOT7 | GSM4909308 | Human | Breast | IDC | 3.01e-04 | 3.39e-01 | 0.158 |
| 29883 | CNOT7 | GSM4909311 | Human | Breast | IDC | 1.30e-18 | -2.67e-01 | 0.1534 |
| 29883 | CNOT7 | GSM4909312 | Human | Breast | IDC | 3.62e-11 | -1.25e-01 | 0.1552 |
| 29883 | CNOT7 | GSM4909319 | Human | Breast | IDC | 3.83e-23 | -2.77e-01 | 0.1563 |
| 29883 | CNOT7 | GSM4909320 | Human | Breast | IDC | 2.82e-06 | -2.63e-01 | 0.1575 |
| 29883 | CNOT7 | GSM4909321 | Human | Breast | IDC | 1.10e-11 | -1.95e-01 | 0.1559 |
| 29883 | CNOT7 | M1 | Human | Breast | IDC | 1.69e-08 | 5.31e-01 | 0.1577 |
| 29883 | CNOT7 | NCCBC5 | Human | Breast | DCIS | 3.63e-06 | -2.25e-01 | 0.2046 |
| 29883 | CNOT7 | P1 | Human | Breast | IDC | 1.35e-13 | -1.05e-02 | 0.1527 |
| 29883 | CNOT7 | P2 | Human | Breast | IDC | 3.48e-02 | -1.26e-01 | 0.21 |
| 29883 | CNOT7 | DCIS2 | Human | Breast | DCIS | 2.22e-51 | 1.23e-01 | 0.0085 |
| 29883 | CNOT7 | HTA11_78_2000001011 | Human | Colorectum | AD | 5.87e-08 | 4.87e-01 | -0.1088 |
| 29883 | CNOT7 | HTA11_347_2000001011 | Human | Colorectum | AD | 1.29e-11 | 3.78e-01 | -0.1954 |
| 29883 | CNOT7 | HTA11_99999970781_79442 | Human | Colorectum | MSS | 6.28e-05 | 3.68e-01 | 0.294 |
| 29883 | CNOT7 | A015-C-203 | Human | Colorectum | FAP | 8.28e-05 | -1.06e-01 | -0.1294 |
| Page: 1 2 3 4 5 6 7 8 |
| Tissue | Expression Dynamics | Abbreviation |
| Breast | 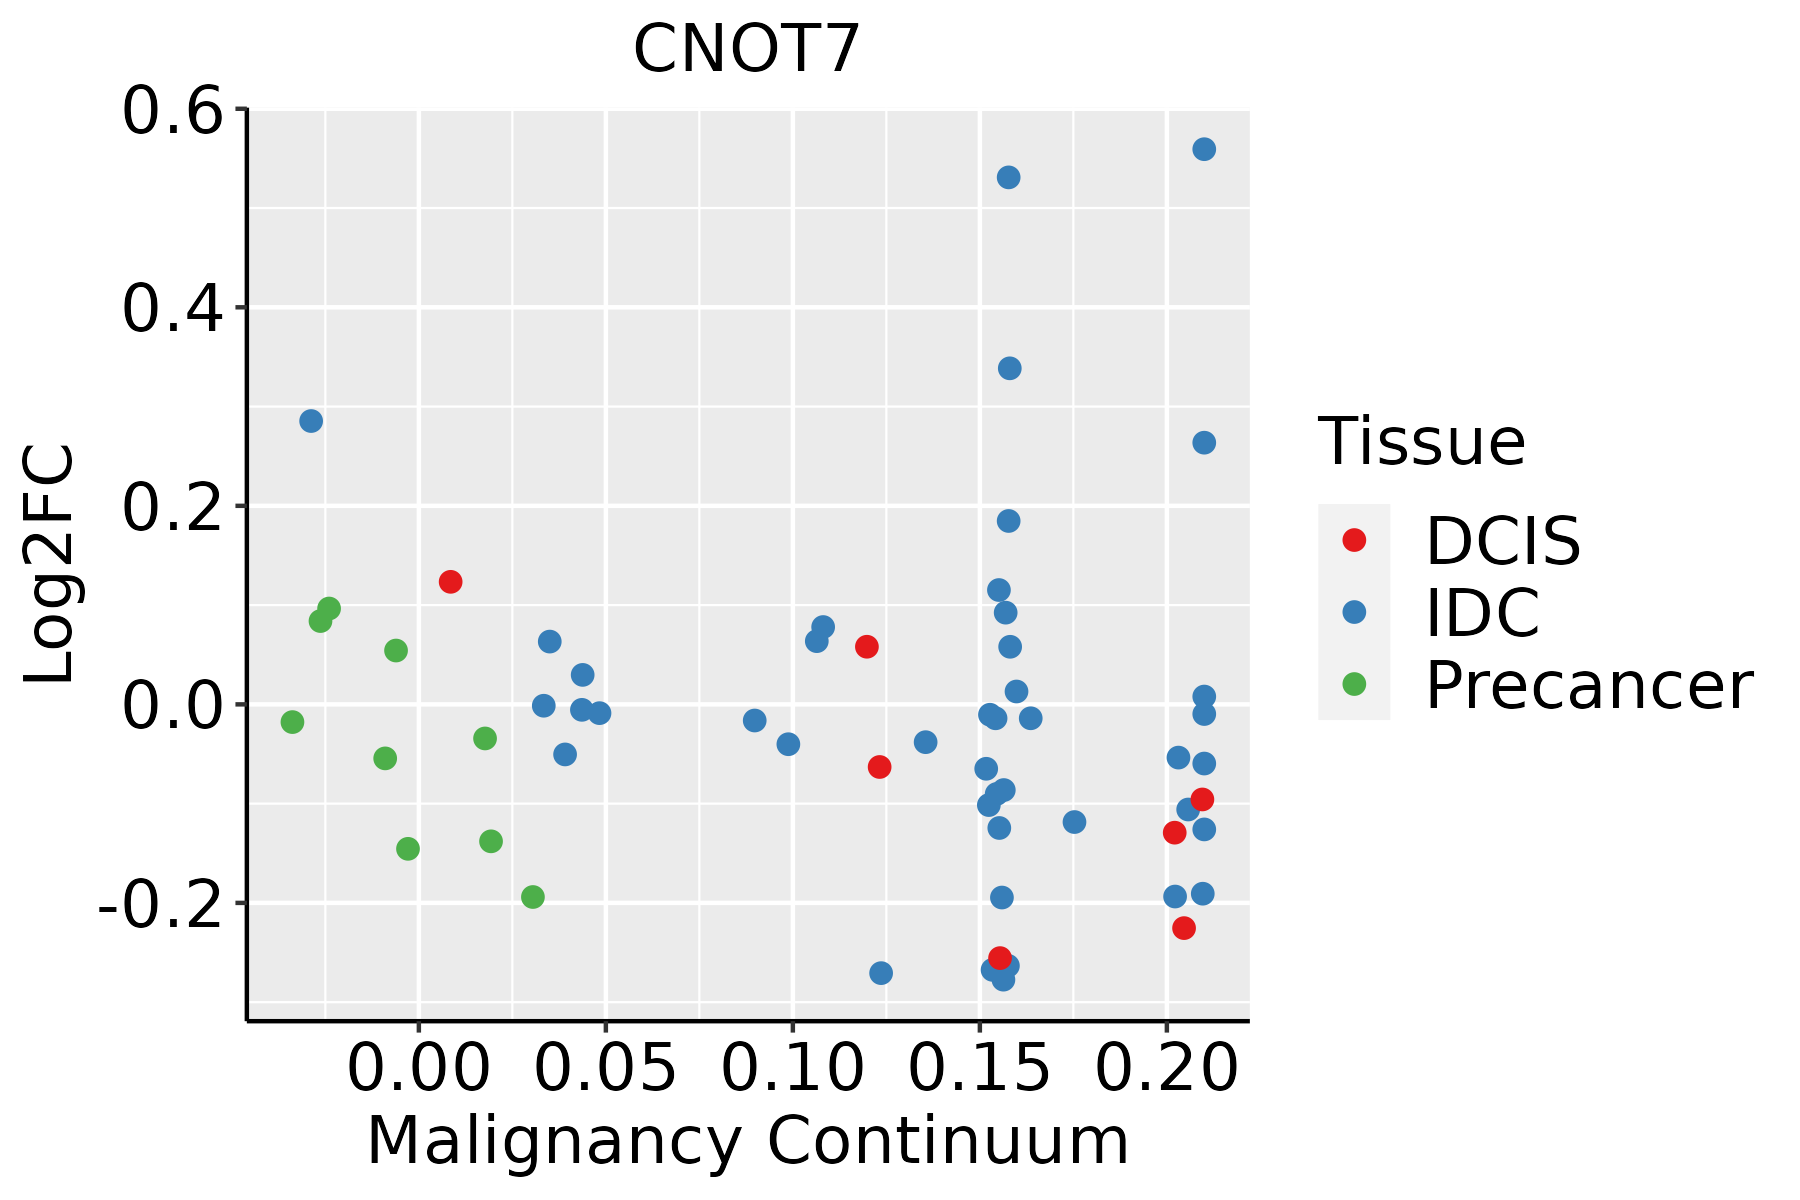 | IDC: Invasive ductal carcinoma |
| DCIS: Ductal carcinoma in situ | ||
| Precancer(BRCA1-mut): Precancerous lesion from BRCA1 mutation carriers | ||
| Colorectum (GSE201348) |  | FAP: Familial adenomatous polyposis |
| CRC: Colorectal cancer | ||
| Colorectum (HTA11) |  | AD: Adenomas |
| SER: Sessile serrated lesions | ||
| MSI-H: Microsatellite-high colorectal cancer | ||
| MSS: Microsatellite stable colorectal cancer | ||
| Esophagus | 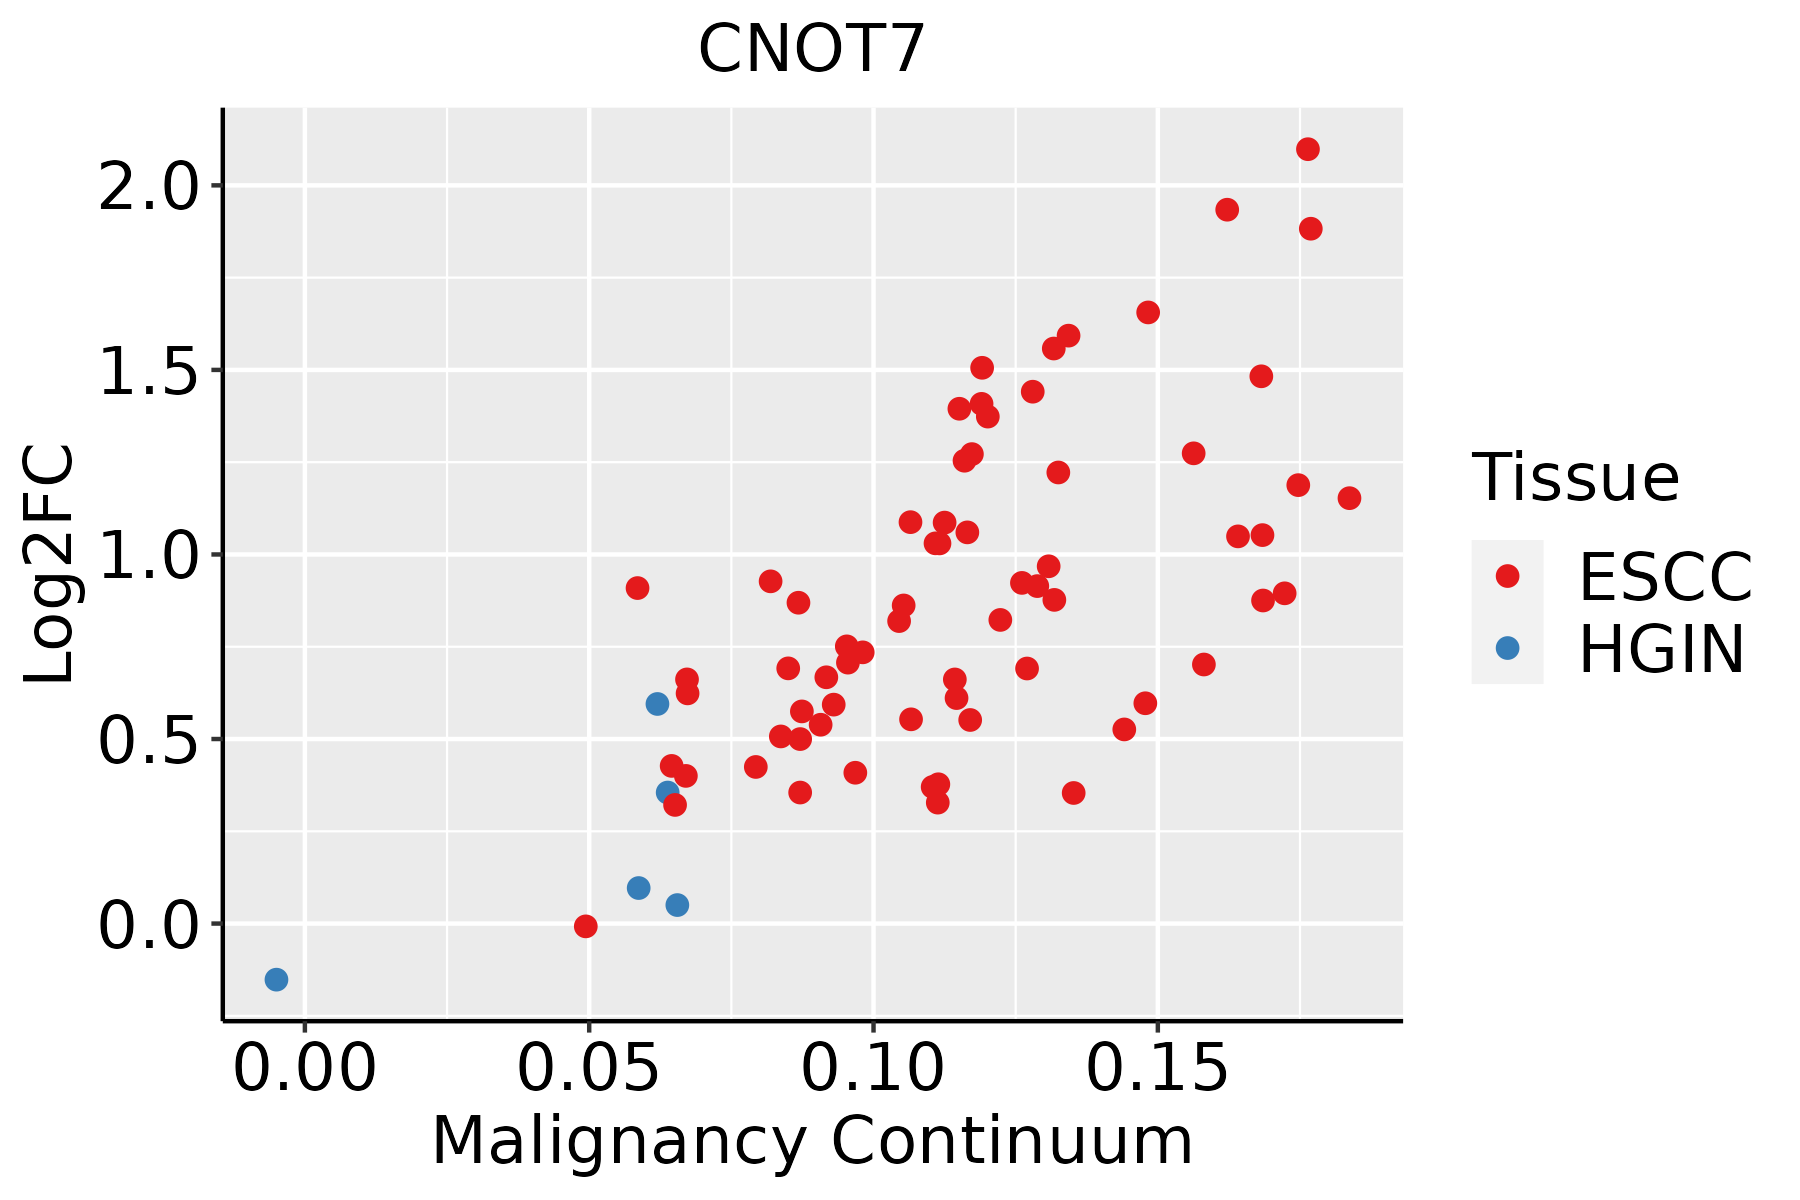 | ESCC: Esophageal squamous cell carcinoma |
| HGIN: High-grade intraepithelial neoplasias | ||
| LGIN: Low-grade intraepithelial neoplasias | ||
| Liver | 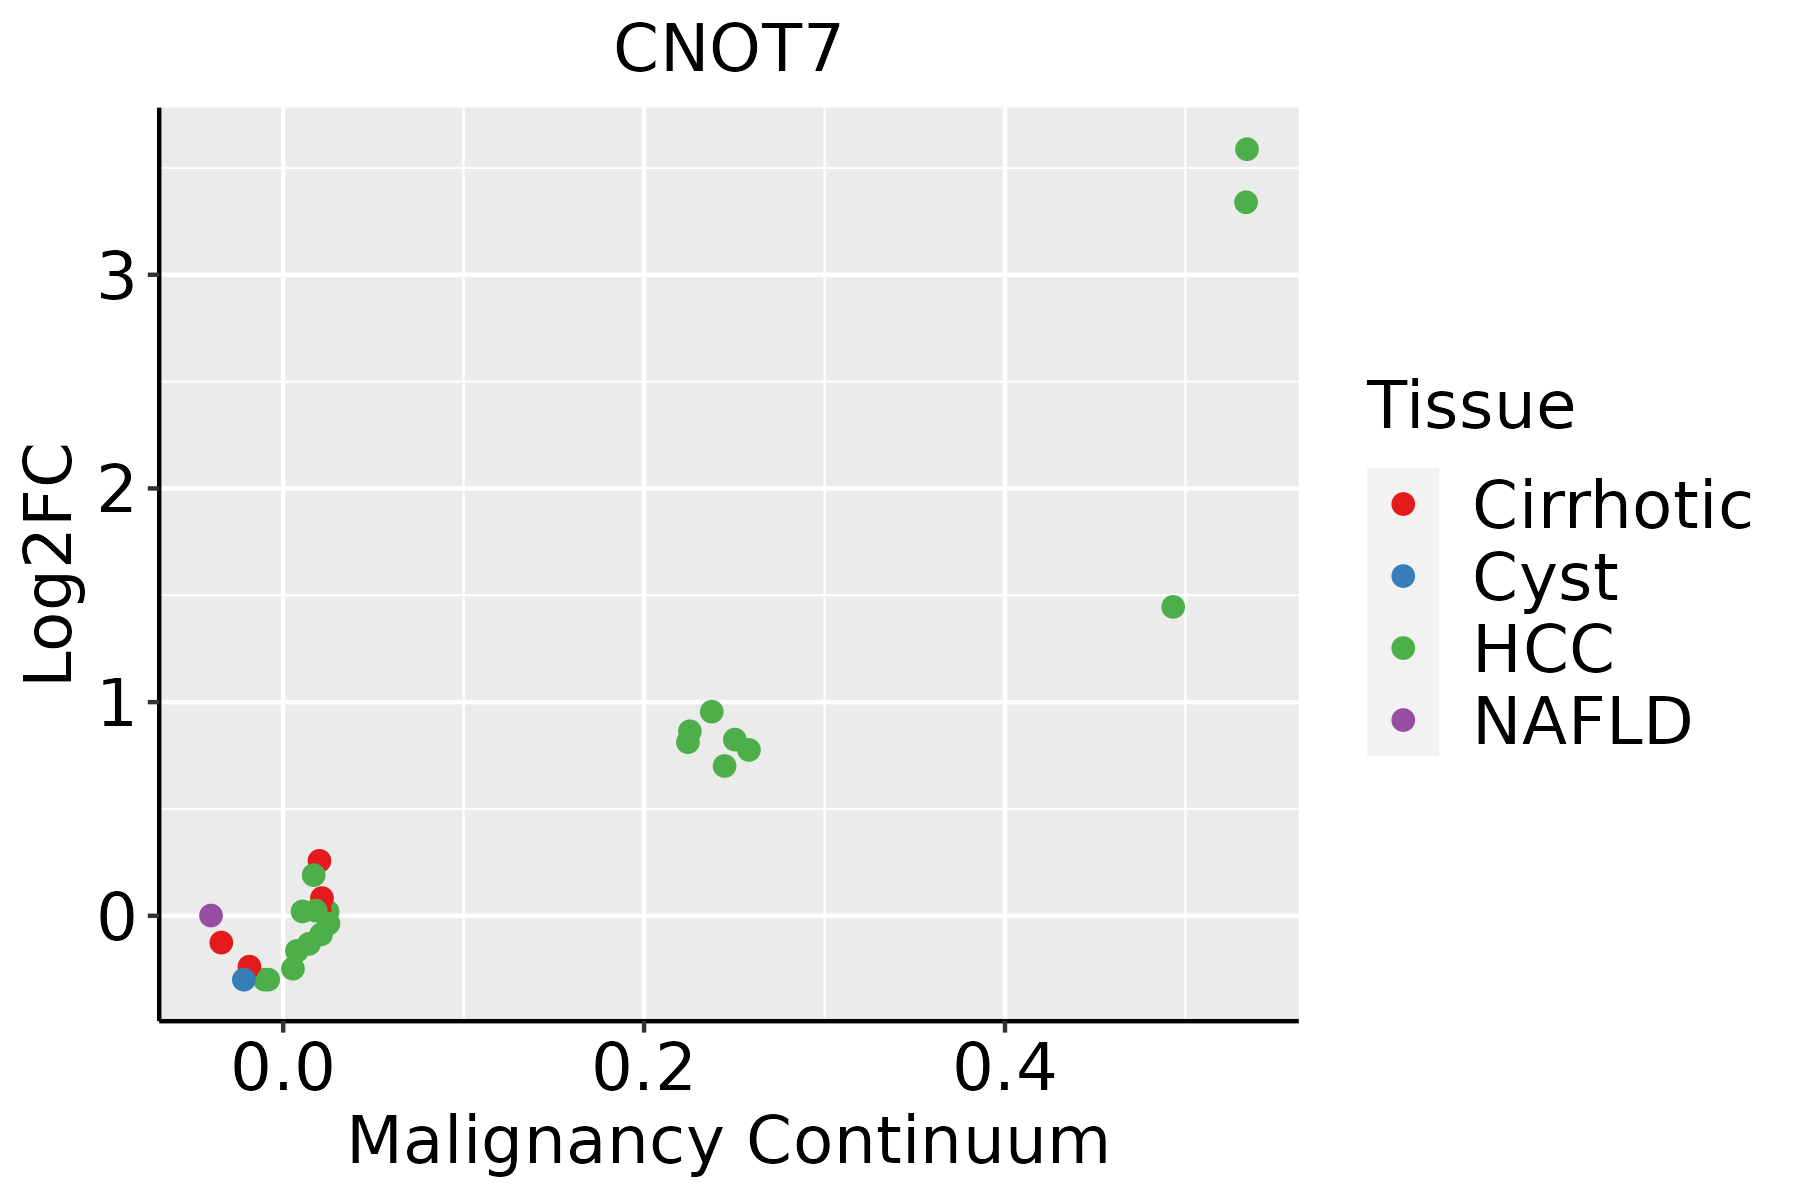 | HCC: Hepatocellular carcinoma |
| NAFLD: Non-alcoholic fatty liver disease | ||
| Oral Cavity |  | EOLP: Erosive Oral lichen planus |
| LP: leukoplakia | ||
| NEOLP: Non-erosive oral lichen planus | ||
| OSCC: Oral squamous cell carcinoma | ||
| Skin |  | AK: Actinic keratosis |
| cSCC: Cutaneous squamous cell carcinoma | ||
| SCCIS:squamous cell carcinoma in situ | ||
| Thyroid |  | ATC: Anaplastic thyroid cancer |
| HT: Hashimoto's thyroiditis | ||
| PTC: Papillary thyroid cancer |
| ∗log2FC in expression of this searched gene in stem-like cells from each diseased tissue sample relative to stem-like cells in normal samples in each tissue plotted against the malignancy continuum. Samples are colored based on if they are from different disease stage. |
Top |
Malignant transformation related pathway analysis |
| Find out the enriched GO biological processes and KEGG pathways involved in transition from healthy to precancer to cancer |
| Tissue | Disease Stage | Enriched GO biological Processes |
| Colorectum | AD |  |
| Colorectum | SER |  |
| Colorectum | MSS |  |
| Colorectum | MSI-H |  |
| Colorectum | FAP |  |
| ∗Top 15 enriched GO BP terms are showed in the bar plot of each disease state in each tissue. Each row represents a significant GO biological process which is colored according to the -log10(p.adjust). |
| Page: 1 2 3 4 5 6 7 8 9 |
| GO ID | Tissue | Disease Stage | Description | Gene Ratio | Bg Ratio | pvalue | p.adjust | Count |
| GO:001603214 | Breast | IDC | viral process | 75/1434 | 415/18723 | 1.98e-12 | 4.02e-10 | 75 |
| GO:001905814 | Breast | IDC | viral life cycle | 61/1434 | 317/18723 | 1.61e-11 | 2.77e-09 | 61 |
| GO:000641714 | Breast | IDC | regulation of translation | 74/1434 | 468/18723 | 1.67e-09 | 1.53e-07 | 74 |
| GO:001907914 | Breast | IDC | viral genome replication | 32/1434 | 131/18723 | 2.82e-09 | 2.46e-07 | 32 |
| GO:005079214 | Breast | IDC | regulation of viral process | 36/1434 | 164/18723 | 6.55e-09 | 5.03e-07 | 36 |
| GO:190390014 | Breast | IDC | regulation of viral life cycle | 30/1434 | 148/18723 | 7.25e-07 | 3.35e-05 | 30 |
| GO:004506913 | Breast | IDC | regulation of viral genome replication | 20/1434 | 85/18723 | 4.77e-06 | 1.63e-04 | 20 |
| GO:004852413 | Breast | IDC | positive regulation of viral process | 17/1434 | 65/18723 | 5.31e-06 | 1.75e-04 | 17 |
| GO:000989614 | Breast | IDC | positive regulation of catabolic process | 62/1434 | 492/18723 | 7.06e-05 | 1.42e-03 | 62 |
| GO:000268311 | Breast | IDC | negative regulation of immune system process | 55/1434 | 434/18723 | 1.53e-04 | 2.67e-03 | 55 |
| GO:190331113 | Breast | IDC | regulation of mRNA metabolic process | 40/1434 | 288/18723 | 1.79e-04 | 3.01e-03 | 40 |
| GO:003133114 | Breast | IDC | positive regulation of cellular catabolic process | 54/1434 | 427/18723 | 1.85e-04 | 3.07e-03 | 54 |
| GO:006021314 | Breast | IDC | positive regulation of nuclear-transcribed mRNA poly(A) tail shortening | 6/1434 | 13/18723 | 2.14e-04 | 3.45e-03 | 6 |
| GO:00450706 | Breast | IDC | positive regulation of viral genome replication | 9/1434 | 30/18723 | 2.89e-04 | 4.39e-03 | 9 |
| GO:00096157 | Breast | IDC | response to virus | 47/1434 | 367/18723 | 3.53e-04 | 5.16e-03 | 47 |
| GO:000640113 | Breast | IDC | RNA catabolic process | 38/1434 | 278/18723 | 3.54e-04 | 5.16e-03 | 38 |
| GO:000640213 | Breast | IDC | mRNA catabolic process | 33/1434 | 232/18723 | 4.12e-04 | 5.66e-03 | 33 |
| GO:006021111 | Breast | IDC | regulation of nuclear-transcribed mRNA poly(A) tail shortening | 6/1434 | 15/18723 | 5.46e-04 | 6.97e-03 | 6 |
| GO:190015312 | Breast | IDC | positive regulation of nuclear-transcribed mRNA catabolic process, deadenylation-dependent decay | 6/1434 | 15/18723 | 5.46e-04 | 6.97e-03 | 6 |
| GO:190015112 | Breast | IDC | regulation of nuclear-transcribed mRNA catabolic process, deadenylation-dependent decay | 6/1434 | 18/18723 | 1.66e-03 | 1.63e-02 | 6 |
| Page: 1 2 3 4 5 6 7 8 9 10 11 12 13 14 15 16 17 18 19 20 21 22 23 24 25 26 27 28 29 30 31 32 33 |
| Pathway ID | Tissue | Disease Stage | Description | Gene Ratio | Bg Ratio | pvalue | p.adjust | qvalue | Count |
| hsa0301821 | Breast | IDC | RNA degradation | 16/867 | 79/8465 | 5.65e-03 | 3.13e-02 | 2.34e-02 | 16 |
| hsa0301831 | Breast | IDC | RNA degradation | 16/867 | 79/8465 | 5.65e-03 | 3.13e-02 | 2.34e-02 | 16 |
| hsa030184 | Breast | DCIS | RNA degradation | 16/846 | 79/8465 | 4.45e-03 | 2.46e-02 | 1.82e-02 | 16 |
| hsa030185 | Breast | DCIS | RNA degradation | 16/846 | 79/8465 | 4.45e-03 | 2.46e-02 | 1.82e-02 | 16 |
| hsa0301810 | Esophagus | HGIN | RNA degradation | 27/1383 | 79/8465 | 7.73e-05 | 9.00e-04 | 7.15e-04 | 27 |
| hsa0301815 | Esophagus | HGIN | RNA degradation | 27/1383 | 79/8465 | 7.73e-05 | 9.00e-04 | 7.15e-04 | 27 |
| hsa0301824 | Esophagus | ESCC | RNA degradation | 62/4205 | 79/8465 | 1.18e-07 | 9.39e-07 | 4.81e-07 | 62 |
| hsa0301834 | Esophagus | ESCC | RNA degradation | 62/4205 | 79/8465 | 1.18e-07 | 9.39e-07 | 4.81e-07 | 62 |
| hsa03018 | Liver | Cirrhotic | RNA degradation | 44/2530 | 79/8465 | 1.43e-06 | 1.65e-05 | 1.02e-05 | 44 |
| hsa030181 | Liver | Cirrhotic | RNA degradation | 44/2530 | 79/8465 | 1.43e-06 | 1.65e-05 | 1.02e-05 | 44 |
| hsa030182 | Liver | HCC | RNA degradation | 58/4020 | 79/8465 | 2.29e-06 | 2.19e-05 | 1.22e-05 | 58 |
| hsa030183 | Liver | HCC | RNA degradation | 58/4020 | 79/8465 | 2.29e-06 | 2.19e-05 | 1.22e-05 | 58 |
| hsa030189 | Oral cavity | OSCC | RNA degradation | 59/3704 | 79/8465 | 2.05e-08 | 1.91e-07 | 9.70e-08 | 59 |
| hsa0301814 | Oral cavity | OSCC | RNA degradation | 59/3704 | 79/8465 | 2.05e-08 | 1.91e-07 | 9.70e-08 | 59 |
| Page: 1 |
Top |
Cell-cell communication analysis |
| Identification of potential cell-cell interactions between two cell types and their ligand-receptor pairs for different disease states |
| Ligand | Receptor | LRpair | Pathway | Tissue | Disease Stage |
| Page: 1 |
Top |
Single-cell gene regulatory network inference analysis |
| Find out the significant the regulons (TFs) and the target genes of each regulon across cell types for different disease states |
| TF | Cell Type | Tissue | Disease Stage | Target Gene | RSS | Regulon Activity |
| ∗The dot plots of a searched regulon are shown for all cell subpopulations in each disease state of each tissue based on the regulon specific score inferred using pySCENIC and by calculating the average expression. |
| Page: 1 |
Top |
Somatic mutation of malignant transformation related genes |
| Annotation of somatic variants for genes involved in malignant transformation |
| Hugo Symbol | Variant Class | Variant Classification | dbSNP RS | HGVSc | HGVSp | HGVSp Short | SWISSPROT | BIOTYPE | SIFT | PolyPhen | Tumor Sample Barcode | Tissue | Histology | Sex | Age | Stage | Therapy Types | Drugs | Outcome |
| CNOT7 | insertion | Frame_Shift_Ins | novel | c.795_796insACGG | p.Ser266ThrfsTer14 | p.S266Tfs*14 | Q9UIV1 | protein_coding | TCGA-A7-A6VX-01 | Breast | breast invasive carcinoma | Female | >=65 | I/II | Chemotherapy | docetaxel | CR | ||
| CNOT7 | deletion | Frame_Shift_Del | novel | c.468delN | p.His157IlefsTer9 | p.H157Ifs*9 | Q9UIV1 | protein_coding | TCGA-D8-A27V-01 | Breast | breast invasive carcinoma | Female | <65 | I/II | Hormone Therapy | tamoxiphen | SD | ||
| CNOT7 | SNV | Missense_Mutation | c.683N>A | p.Gly228Glu | p.G228E | Q9UIV1 | protein_coding | deleterious(0) | probably_damaging(1) | TCGA-CK-5916-01 | Colorectum | colon adenocarcinoma | Female | >=65 | I/II | Unknown | Unknown | PD | |
| CNOT7 | SNV | Missense_Mutation | c.557G>A | p.Arg186Gln | p.R186Q | Q9UIV1 | protein_coding | tolerated(0.16) | benign(0.011) | TCGA-G4-6628-01 | Colorectum | colon adenocarcinoma | Male | >=65 | I/II | Unknown | Unknown | SD | |
| CNOT7 | SNV | Missense_Mutation | rs375278542 | c.95N>A | p.Arg32Gln | p.R32Q | Q9UIV1 | protein_coding | tolerated(0.46) | benign(0) | TCGA-EI-6882-01 | Colorectum | rectum adenocarcinoma | Male | <65 | I/II | Unknown | Unknown | SD |
| CNOT7 | insertion | Frame_Shift_Ins | novel | c.567_568insT | p.Pro190SerfsTer5 | p.P190Sfs*5 | Q9UIV1 | protein_coding | TCGA-D5-6928-01 | Colorectum | colon adenocarcinoma | Male | >=65 | I/II | Unknown | Unknown | SD | ||
| CNOT7 | SNV | Missense_Mutation | c.557G>A | p.Arg186Gln | p.R186Q | Q9UIV1 | protein_coding | tolerated(0.16) | benign(0.011) | TCGA-A5-A0G2-01 | Endometrium | uterine corpus endometrioid carcinoma | Female | <65 | III/IV | Unknown | Unknown | SD | |
| CNOT7 | SNV | Missense_Mutation | novel | c.33A>C | p.Arg11Ser | p.R11S | Q9UIV1 | protein_coding | tolerated(0.05) | benign(0.013) | TCGA-A5-A0G2-01 | Endometrium | uterine corpus endometrioid carcinoma | Female | <65 | III/IV | Unknown | Unknown | SD |
| CNOT7 | SNV | Missense_Mutation | c.683G>T | p.Gly228Val | p.G228V | Q9UIV1 | protein_coding | deleterious(0) | probably_damaging(1) | TCGA-A5-A1OF-01 | Endometrium | uterine corpus endometrioid carcinoma | Female | <65 | I/II | Unknown | Unknown | SD | |
| CNOT7 | SNV | Missense_Mutation | c.173N>T | p.Ala58Val | p.A58V | Q9UIV1 | protein_coding | tolerated(0.12) | benign(0.017) | TCGA-AP-A051-01 | Endometrium | uterine corpus endometrioid carcinoma | Female | >=65 | I/II | Unknown | Unknown | SD |
| Page: 1 2 3 |
Top |
Related drugs of malignant transformation related genes |
| Identification of chemicals and drugs interact with genes involved in malignant transfromation |
| (DGIdb 4.0) |
| Entrez ID | Symbol | Category | Interaction Types | Drug Claim Name | Drug Name | PMIDs |
| Page: 1 |

Copyright 2023-Present -The University of Texas Health Science Center at Houston |