
|
|||||
|
 | |
| |
| |
| |
| |
| |
|
Gene: CNOT6L |
Gene summary for CNOT6L |
| Gene information | Species | Human | Gene symbol | CNOT6L | Gene ID | 246175 |
| Gene name | CCR4-NOT transcription complex subunit 6 like | |
| Gene Alias | CCR4b | |
| Cytomap | 4q21.1 | |
| Gene Type | protein-coding | GO ID | GO:0000288 | UniProtAcc | B4E0K8 |
Top |
Malignant transformation analysis |
| Identification of the aberrant gene expression in precancerous and cancerous lesions by comparing the gene expression of stem-like cells in diseased tissues with normal stem cells |
| Entrez ID | Symbol | Replicates | Species | Organ | Tissue | Adj P-value | Log2FC | Malignancy |
| 246175 | CNOT6L | AEH-subject4 | Human | Endometrium | AEH | 1.62e-03 | 3.67e-01 | -0.2657 |
| 246175 | CNOT6L | EEC-subject3 | Human | Endometrium | EEC | 2.21e-02 | 1.57e-02 | -0.2525 |
| 246175 | CNOT6L | EEC-subject4 | Human | Endometrium | EEC | 5.37e-04 | 3.52e-01 | -0.2571 |
| 246175 | CNOT6L | GSM6177620_NYU_UCEC1_lib1_lib1 | Human | Endometrium | EEC | 3.10e-06 | 3.65e-02 | -0.1869 |
| 246175 | CNOT6L | GSM6177620_NYU_UCEC1_lib2_lib2 | Human | Endometrium | EEC | 1.77e-04 | -1.23e-02 | -0.1875 |
| 246175 | CNOT6L | GSM6177620_NYU_UCEC1_lib3_lib3 | Human | Endometrium | EEC | 3.08e-05 | -9.48e-02 | -0.1883 |
| 246175 | CNOT6L | GSM6177621_NYU_UCEC2_lib1_lib1 | Human | Endometrium | EEC | 3.72e-09 | 1.04e-01 | -0.1934 |
| 246175 | CNOT6L | GSM6177622_NYU_UCEC3_lib1_lib1 | Human | Endometrium | EEC | 1.10e-08 | -4.02e-02 | -0.1917 |
| 246175 | CNOT6L | GSM6177622_NYU_UCEC3_lib2_lib2 | Human | Endometrium | EEC | 2.86e-13 | -9.02e-02 | -0.1916 |
| 246175 | CNOT6L | LZE4T | Human | Esophagus | ESCC | 6.60e-09 | 1.42e-01 | 0.0811 |
| 246175 | CNOT6L | LZE5T | Human | Esophagus | ESCC | 3.11e-06 | 2.96e-01 | 0.0514 |
| 246175 | CNOT6L | LZE7T | Human | Esophagus | ESCC | 2.99e-05 | 6.55e-01 | 0.0667 |
| 246175 | CNOT6L | LZE8T | Human | Esophagus | ESCC | 4.55e-10 | 1.78e-01 | 0.067 |
| 246175 | CNOT6L | LZE20T | Human | Esophagus | ESCC | 4.89e-03 | 2.33e-02 | 0.0662 |
| 246175 | CNOT6L | LZE24T | Human | Esophagus | ESCC | 1.75e-03 | 1.86e-01 | 0.0596 |
| 246175 | CNOT6L | LZE6T | Human | Esophagus | ESCC | 1.89e-06 | 1.92e-01 | 0.0845 |
| 246175 | CNOT6L | P1T-E | Human | Esophagus | ESCC | 3.22e-04 | 2.12e-01 | 0.0875 |
| 246175 | CNOT6L | P2T-E | Human | Esophagus | ESCC | 4.41e-25 | 2.79e-01 | 0.1177 |
| 246175 | CNOT6L | P4T-E | Human | Esophagus | ESCC | 2.62e-15 | 2.33e-01 | 0.1323 |
| 246175 | CNOT6L | P5T-E | Human | Esophagus | ESCC | 7.61e-11 | 1.79e-02 | 0.1327 |
| Page: 1 2 3 4 5 |
| Tissue | Expression Dynamics | Abbreviation |
| Endometrium | 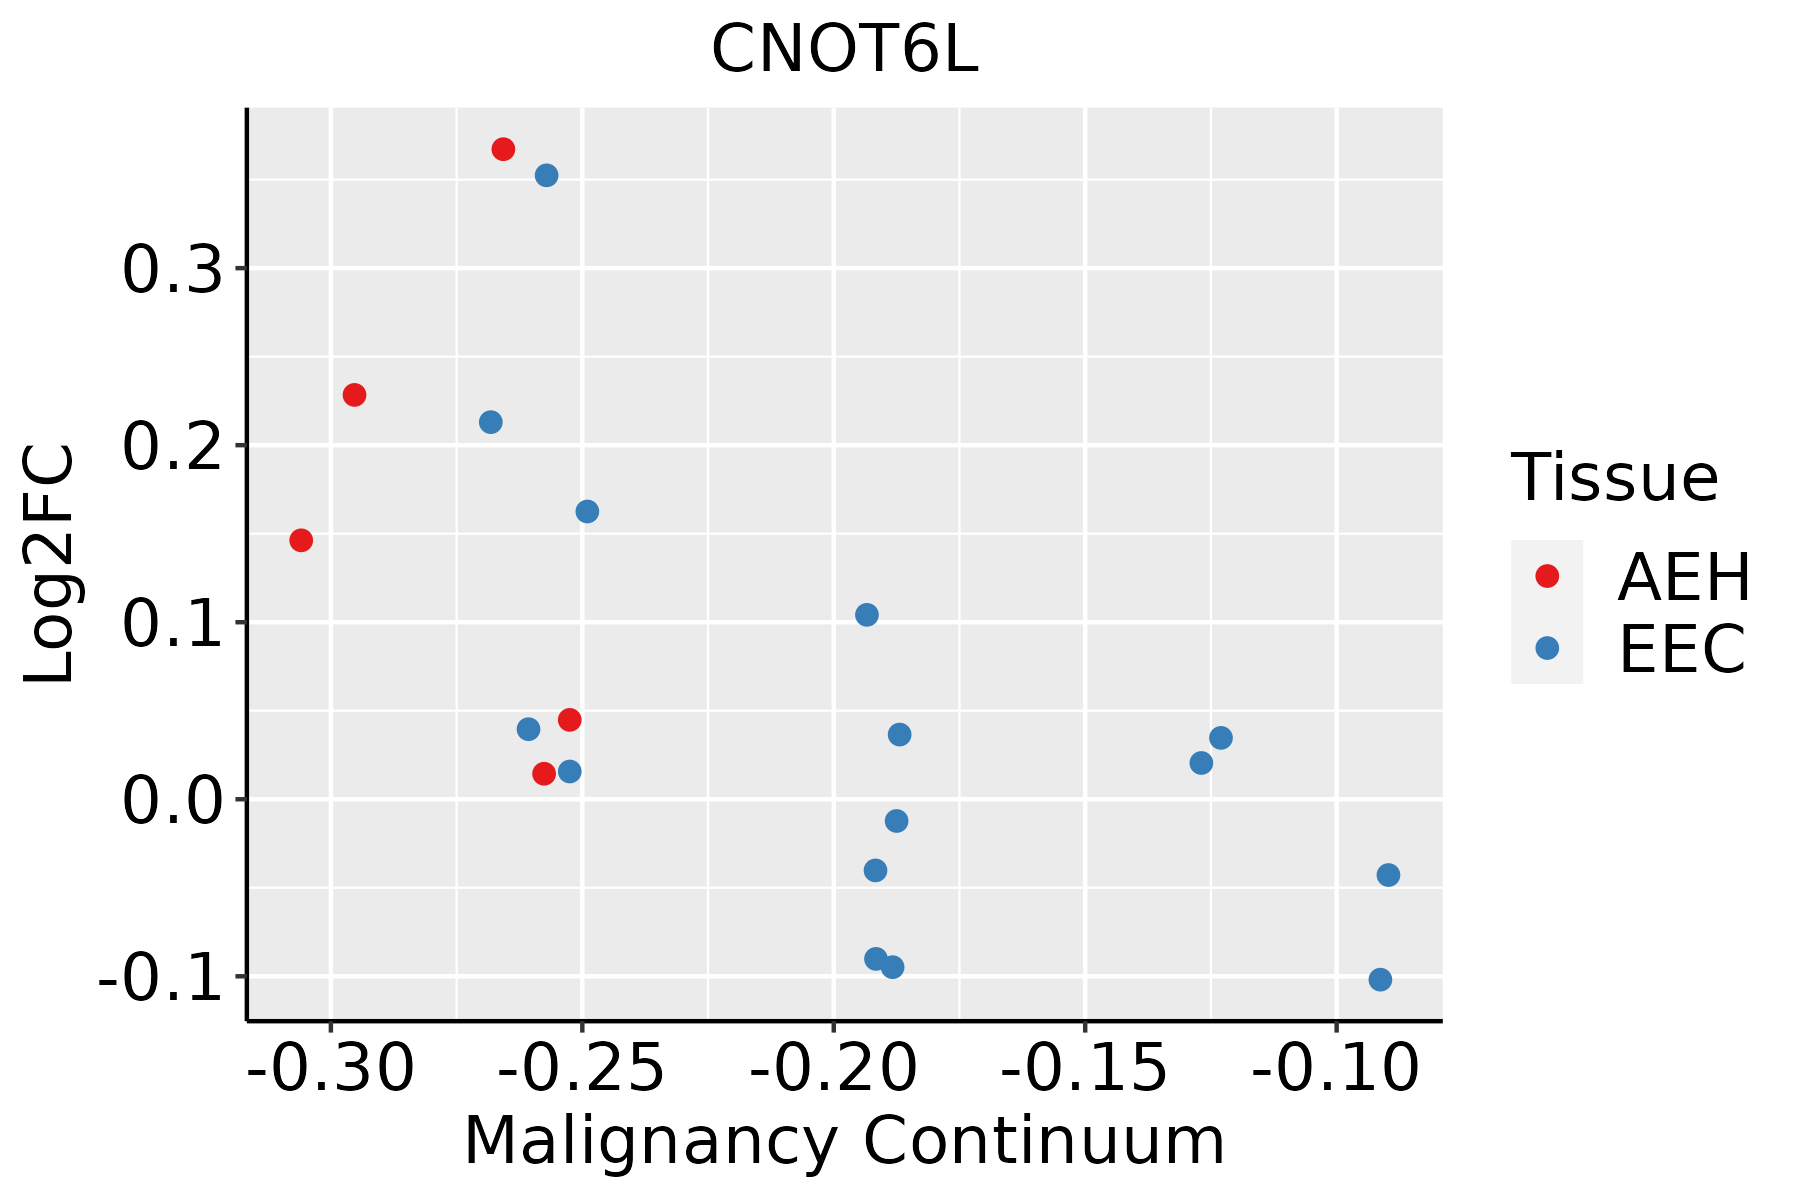 | AEH: Atypical endometrial hyperplasia |
| EEC: Endometrioid Cancer | ||
| Esophagus | 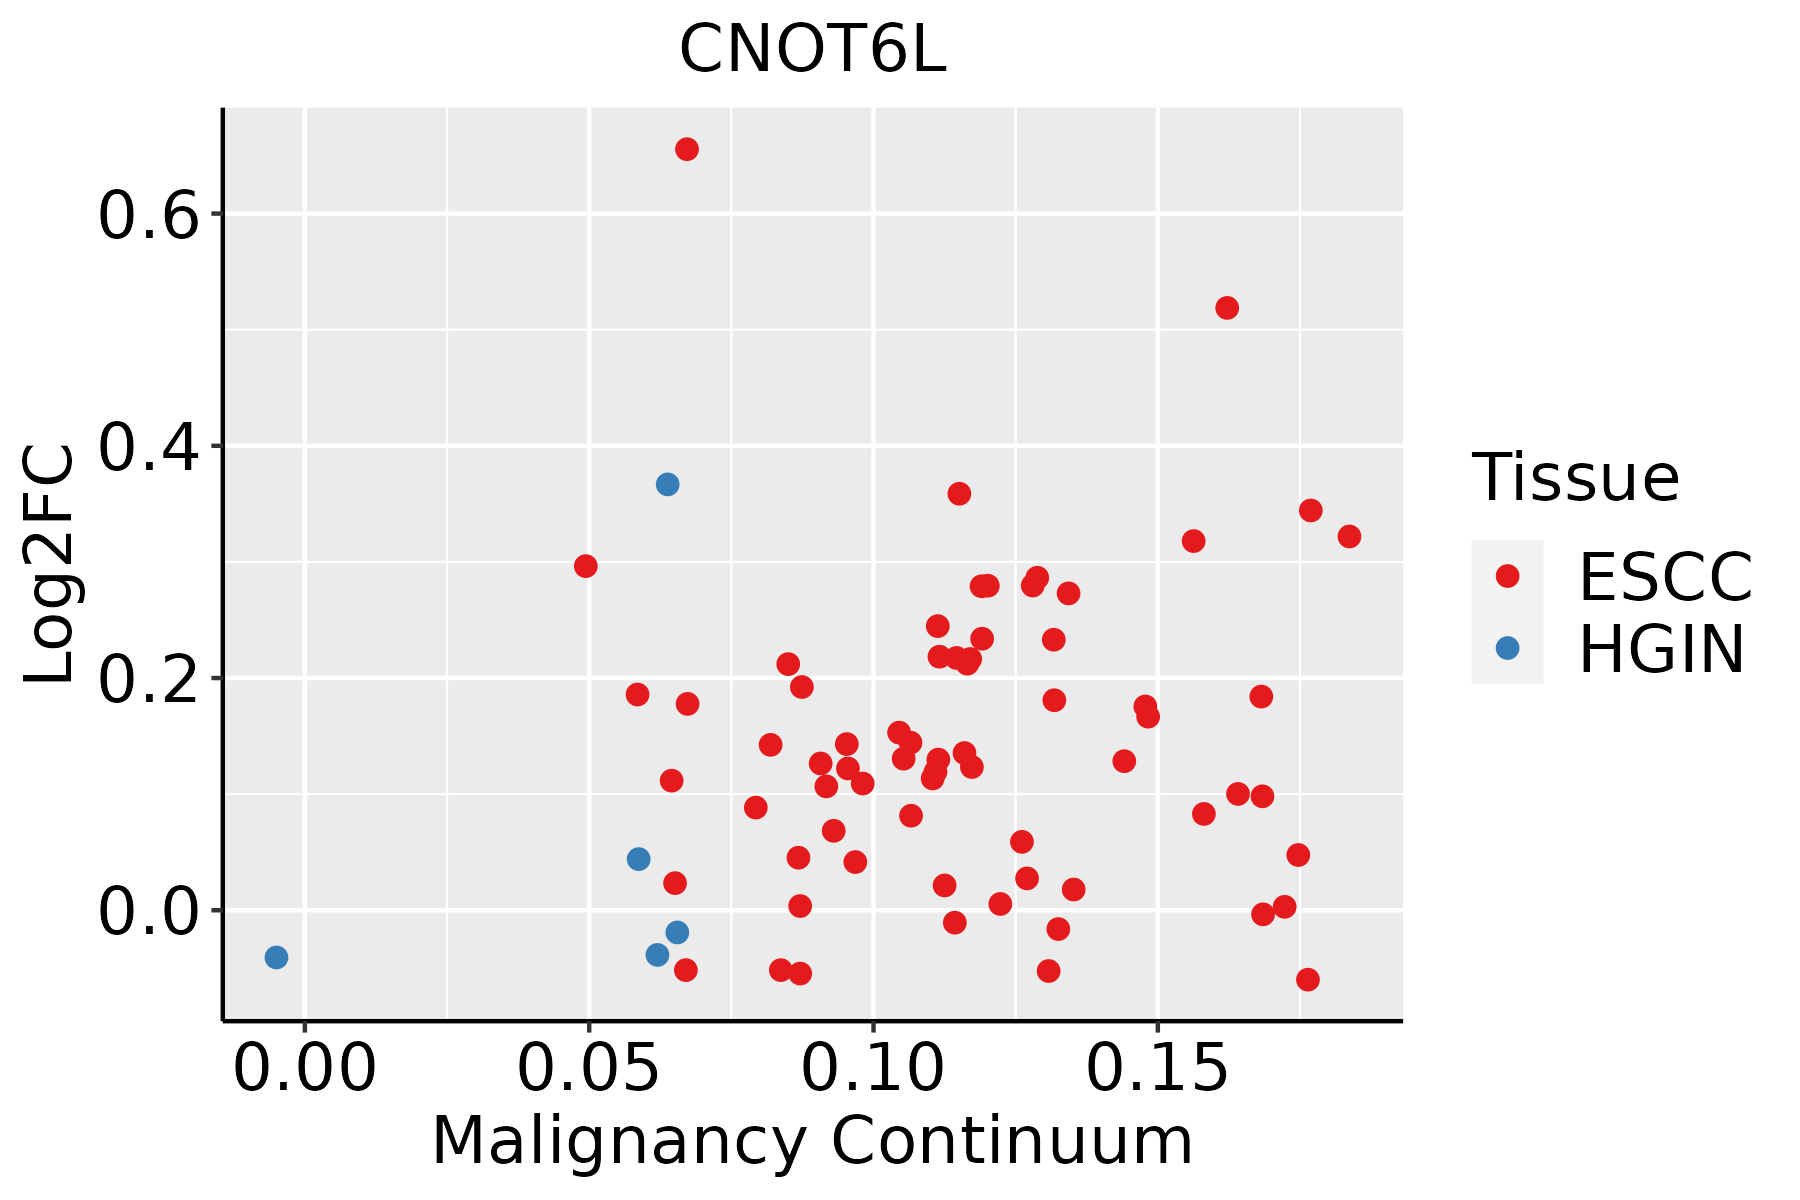 | ESCC: Esophageal squamous cell carcinoma |
| HGIN: High-grade intraepithelial neoplasias | ||
| LGIN: Low-grade intraepithelial neoplasias | ||
| Prostate | 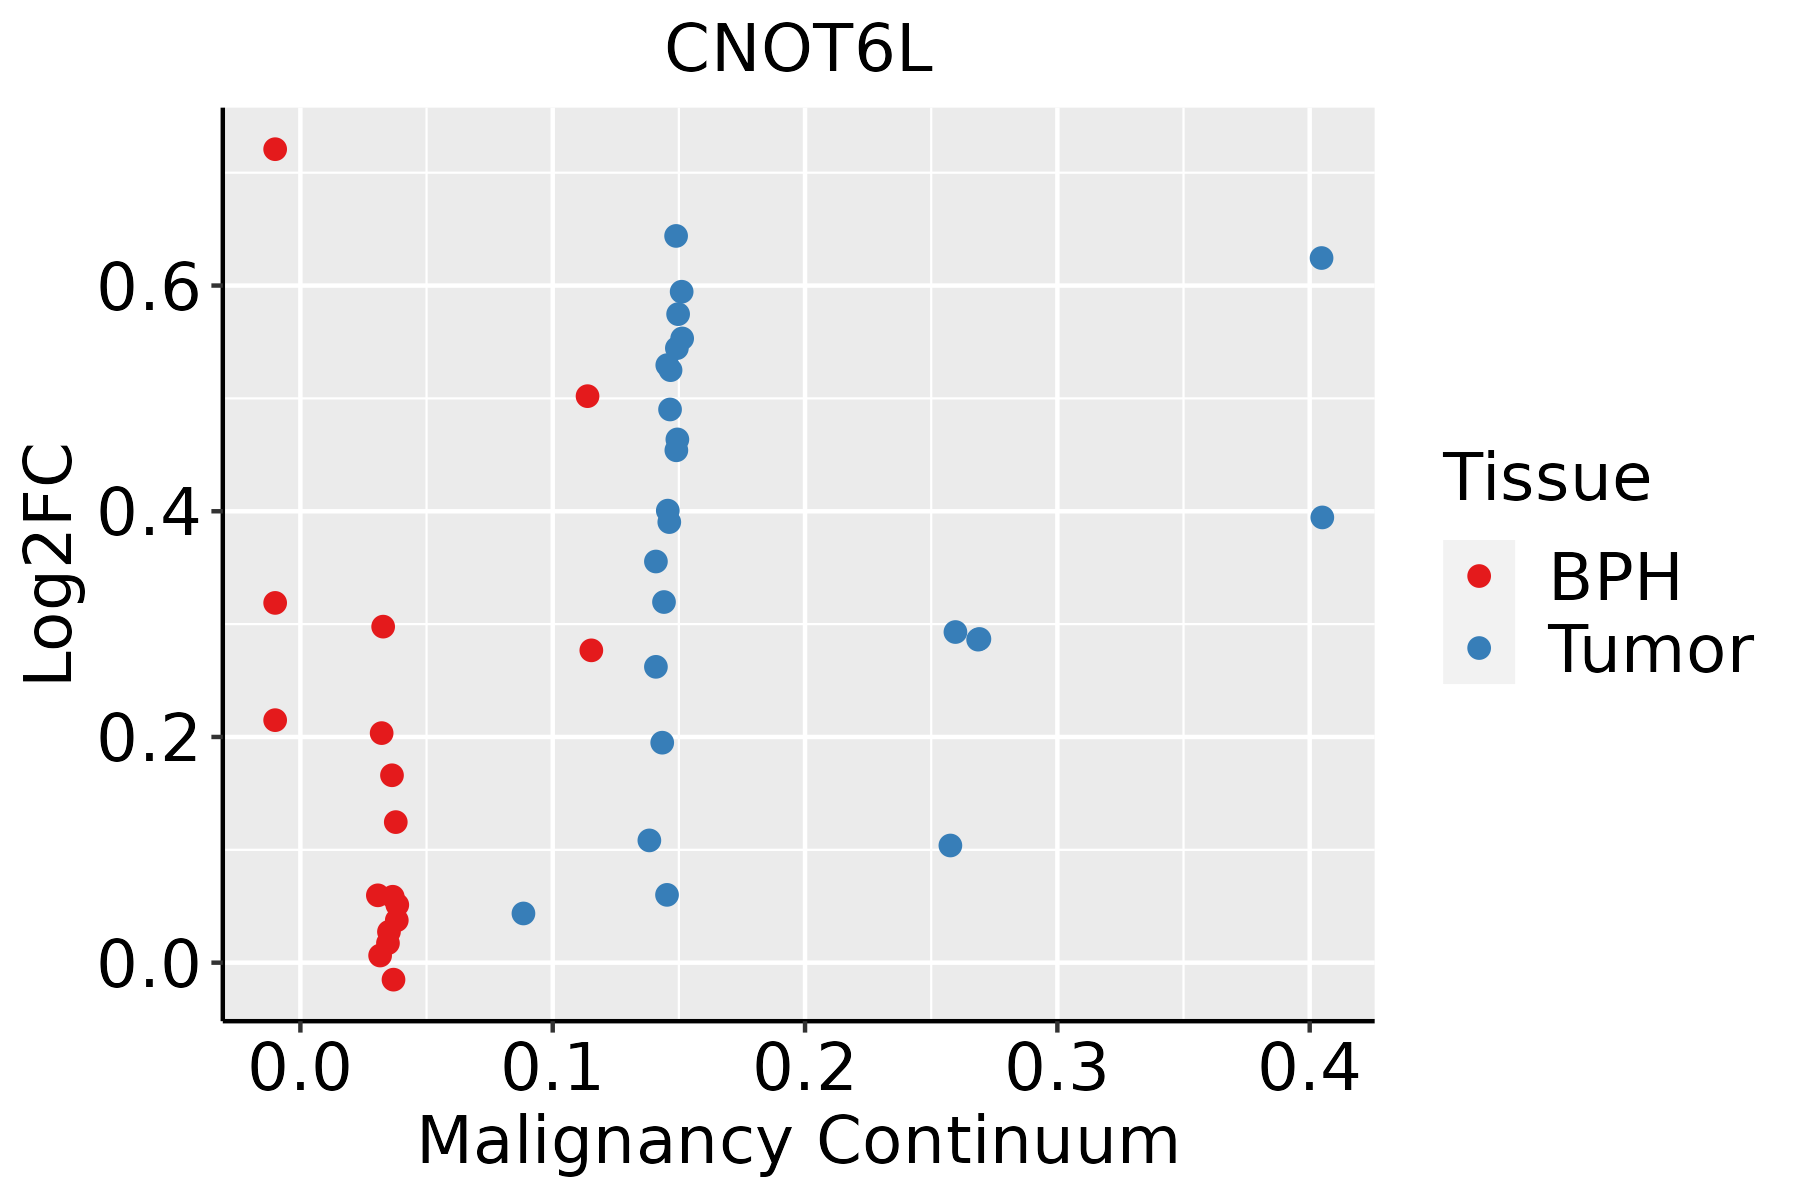 | BPH: Benign Prostatic Hyperplasia |
| ∗log2FC in expression of this searched gene in stem-like cells from each diseased tissue sample relative to stem-like cells in normal samples in each tissue plotted against the malignancy continuum. Samples are colored based on if they are from different disease stage. |
Top |
Malignant transformation related pathway analysis |
| Find out the enriched GO biological processes and KEGG pathways involved in transition from healthy to precancer to cancer |
| Tissue | Disease Stage | Enriched GO biological Processes |
| Colorectum | AD |  |
| Colorectum | SER |  |
| Colorectum | MSS |  |
| Colorectum | MSI-H |  |
| Colorectum | FAP |  |
| ∗Top 15 enriched GO BP terms are showed in the bar plot of each disease state in each tissue. Each row represents a significant GO biological process which is colored according to the -log10(p.adjust). |
| Page: 1 2 3 4 5 6 7 8 9 |
| GO ID | Tissue | Disease Stage | Description | Gene Ratio | Bg Ratio | pvalue | p.adjust | Count |
| GO:190331110 | Endometrium | AEH | regulation of mRNA metabolic process | 77/2100 | 288/18723 | 1.69e-13 | 4.40e-11 | 77 |
| GO:000989616 | Endometrium | AEH | positive regulation of catabolic process | 104/2100 | 492/18723 | 9.38e-11 | 1.10e-08 | 104 |
| GO:003133116 | Endometrium | AEH | positive regulation of cellular catabolic process | 91/2100 | 427/18723 | 9.15e-10 | 8.31e-08 | 91 |
| GO:000640210 | Endometrium | AEH | mRNA catabolic process | 59/2100 | 232/18723 | 9.51e-10 | 8.52e-08 | 59 |
| GO:000641716 | Endometrium | AEH | regulation of translation | 94/2100 | 468/18723 | 1.14e-08 | 7.62e-07 | 94 |
| GO:000640110 | Endometrium | AEH | RNA catabolic process | 63/2100 | 278/18723 | 3.28e-08 | 1.87e-06 | 63 |
| GO:006101310 | Endometrium | AEH | regulation of mRNA catabolic process | 39/2100 | 166/18723 | 5.21e-06 | 1.33e-04 | 39 |
| GO:004348810 | Endometrium | AEH | regulation of mRNA stability | 37/2100 | 158/18723 | 9.73e-06 | 2.24e-04 | 37 |
| GO:19033137 | Endometrium | AEH | positive regulation of mRNA metabolic process | 30/2100 | 118/18723 | 1.21e-05 | 2.68e-04 | 30 |
| GO:003465510 | Endometrium | AEH | nucleobase-containing compound catabolic process | 74/2100 | 407/18723 | 1.78e-05 | 3.65e-04 | 74 |
| GO:004427010 | Endometrium | AEH | cellular nitrogen compound catabolic process | 80/2100 | 451/18723 | 2.09e-05 | 4.13e-04 | 80 |
| GO:00467009 | Endometrium | AEH | heterocycle catabolic process | 79/2100 | 445/18723 | 2.27e-05 | 4.35e-04 | 79 |
| GO:004348710 | Endometrium | AEH | regulation of RNA stability | 38/2100 | 170/18723 | 2.30e-05 | 4.38e-04 | 38 |
| GO:00194399 | Endometrium | AEH | aromatic compound catabolic process | 80/2100 | 467/18723 | 7.21e-05 | 1.10e-03 | 80 |
| GO:19013619 | Endometrium | AEH | organic cyclic compound catabolic process | 83/2100 | 495/18723 | 1.13e-04 | 1.60e-03 | 83 |
| GO:00009568 | Endometrium | AEH | nuclear-transcribed mRNA catabolic process | 26/2100 | 112/18723 | 2.25e-04 | 2.75e-03 | 26 |
| GO:00002897 | Endometrium | AEH | nuclear-transcribed mRNA poly(A) tail shortening | 10/2100 | 29/18723 | 8.25e-04 | 7.72e-03 | 10 |
| GO:00610147 | Endometrium | AEH | positive regulation of mRNA catabolic process | 20/2100 | 87/18723 | 1.30e-03 | 1.11e-02 | 20 |
| GO:00611577 | Endometrium | AEH | mRNA destabilization | 19/2100 | 84/18723 | 2.07e-03 | 1.61e-02 | 19 |
| GO:00507797 | Endometrium | AEH | RNA destabilization | 19/2100 | 88/18723 | 3.61e-03 | 2.48e-02 | 19 |
| Page: 1 2 3 4 5 6 7 |
| Pathway ID | Tissue | Disease Stage | Description | Gene Ratio | Bg Ratio | pvalue | p.adjust | qvalue | Count |
| hsa030187 | Endometrium | EEC | RNA degradation | 20/1237 | 79/8465 | 8.36e-03 | 3.88e-02 | 2.89e-02 | 20 |
| hsa0301812 | Endometrium | EEC | RNA degradation | 20/1237 | 79/8465 | 8.36e-03 | 3.88e-02 | 2.89e-02 | 20 |
| hsa0301824 | Esophagus | ESCC | RNA degradation | 62/4205 | 79/8465 | 1.18e-07 | 9.39e-07 | 4.81e-07 | 62 |
| hsa0301834 | Esophagus | ESCC | RNA degradation | 62/4205 | 79/8465 | 1.18e-07 | 9.39e-07 | 4.81e-07 | 62 |
| hsa030188 | Prostate | BPH | RNA degradation | 29/1718 | 79/8465 | 5.17e-04 | 2.67e-03 | 1.65e-03 | 29 |
| hsa0301813 | Prostate | BPH | RNA degradation | 29/1718 | 79/8465 | 5.17e-04 | 2.67e-03 | 1.65e-03 | 29 |
| hsa0301822 | Prostate | Tumor | RNA degradation | 30/1791 | 79/8465 | 4.48e-04 | 2.35e-03 | 1.46e-03 | 30 |
| hsa0301832 | Prostate | Tumor | RNA degradation | 30/1791 | 79/8465 | 4.48e-04 | 2.35e-03 | 1.46e-03 | 30 |
| Page: 1 |
Top |
Cell-cell communication analysis |
| Identification of potential cell-cell interactions between two cell types and their ligand-receptor pairs for different disease states |
| Ligand | Receptor | LRpair | Pathway | Tissue | Disease Stage |
| Page: 1 |
Top |
Single-cell gene regulatory network inference analysis |
| Find out the significant the regulons (TFs) and the target genes of each regulon across cell types for different disease states |
| TF | Cell Type | Tissue | Disease Stage | Target Gene | RSS | Regulon Activity |
| ∗The dot plots of a searched regulon are shown for all cell subpopulations in each disease state of each tissue based on the regulon specific score inferred using pySCENIC and by calculating the average expression. |
| Page: 1 |
Top |
Somatic mutation of malignant transformation related genes |
| Annotation of somatic variants for genes involved in malignant transformation |
| Hugo Symbol | Variant Class | Variant Classification | dbSNP RS | HGVSc | HGVSp | HGVSp Short | SWISSPROT | BIOTYPE | SIFT | PolyPhen | Tumor Sample Barcode | Tissue | Histology | Sex | Age | Stage | Therapy Types | Drugs | Outcome |
| CNOT6L | SNV | Missense_Mutation | c.241N>G | p.Leu81Val | p.L81V | Q96LI5 | protein_coding | deleterious(0) | probably_damaging(1) | TCGA-5L-AAT1-01 | Breast | breast invasive carcinoma | Female | <65 | III/IV | Hormone Therapy | letrozol | SD | |
| CNOT6L | SNV | Missense_Mutation | c.388C>G | p.Leu130Val | p.L130V | Q96LI5 | protein_coding | deleterious(0) | possibly_damaging(0.905) | TCGA-A2-A0EQ-01 | Breast | breast invasive carcinoma | Female | <65 | I/II | Chemotherapy | adriamycin | SD | |
| CNOT6L | SNV | Missense_Mutation | rs752836467 | c.82G>T | p.Val28Leu | p.V28L | Q96LI5 | protein_coding | tolerated(0.49) | benign(0.001) | TCGA-A8-A06R-01 | Breast | breast invasive carcinoma | Female | >=65 | I/II | Chemotherapy | 5-fluorouracil | CR |
| CNOT6L | SNV | Missense_Mutation | rs752836467 | c.82N>T | p.Val28Leu | p.V28L | Q96LI5 | protein_coding | tolerated(0.49) | benign(0.001) | TCGA-B6-A1KC-01 | Breast | breast invasive carcinoma | Female | >=65 | I/II | Unknown | Unknown | SD |
| CNOT6L | SNV | Missense_Mutation | rs752836467 | c.82G>T | p.Val28Leu | p.V28L | Q96LI5 | protein_coding | tolerated(0.49) | benign(0.001) | TCGA-BH-A0BG-01 | Breast | breast invasive carcinoma | Female | >=65 | I/II | Unknown | Unknown | SD |
| CNOT6L | insertion | Frame_Shift_Ins | novel | c.1268_1269insGAAATCTAAAC | p.Ser424LysfsTer9 | p.S424Kfs*9 | Q96LI5 | protein_coding | TCGA-AR-A0TU-01 | Breast | breast invasive carcinoma | Female | <65 | I/II | Unspecific | Doxorubicin | SD | ||
| CNOT6L | deletion | Frame_Shift_Del | novel | c.876delN | p.Phe292LeufsTer26 | p.F292Lfs*26 | Q96LI5 | protein_coding | TCGA-D8-A27V-01 | Breast | breast invasive carcinoma | Female | <65 | I/II | Hormone Therapy | tamoxiphen | SD | ||
| CNOT6L | SNV | Missense_Mutation | novel | c.700G>T | p.Asp234Tyr | p.D234Y | Q96LI5 | protein_coding | deleterious(0) | probably_damaging(1) | TCGA-2W-A8YY-01 | Cervix | cervical & endocervical cancer | Female | <65 | I/II | Chemotherapy | cisplatin | CR |
| CNOT6L | SNV | Missense_Mutation | novel | c.289G>A | p.Glu97Lys | p.E97K | Q96LI5 | protein_coding | deleterious(0) | probably_damaging(0.996) | TCGA-2W-A8YY-01 | Cervix | cervical & endocervical cancer | Female | <65 | I/II | Chemotherapy | cisplatin | CR |
| CNOT6L | SNV | Missense_Mutation | novel | c.79G>A | p.Glu27Lys | p.E27K | Q96LI5 | protein_coding | tolerated(0.11) | possibly_damaging(0.786) | TCGA-2W-A8YY-01 | Cervix | cervical & endocervical cancer | Female | <65 | I/II | Chemotherapy | cisplatin | CR |
| Page: 1 2 3 4 5 6 |
Top |
Related drugs of malignant transformation related genes |
| Identification of chemicals and drugs interact with genes involved in malignant transfromation |
| (DGIdb 4.0) |
| Entrez ID | Symbol | Category | Interaction Types | Drug Claim Name | Drug Name | PMIDs |
| Page: 1 |

Copyright 2023-Present -The University of Texas Health Science Center at Houston |