
|
|||||
|
 | |
| |
| |
| |
| |
| |
|
Gene: CNOT4 |
Gene summary for CNOT4 |
| Gene information | Species | Human | Gene symbol | CNOT4 | Gene ID | 4850 |
| Gene name | CCR4-NOT transcription complex subunit 4 | |
| Gene Alias | CLONE243 | |
| Cytomap | 7q33 | |
| Gene Type | protein-coding | GO ID | GO:0002376 | UniProtAcc | A0A024R776 |
Top |
Malignant transformation analysis |
| Identification of the aberrant gene expression in precancerous and cancerous lesions by comparing the gene expression of stem-like cells in diseased tissues with normal stem cells |
| Entrez ID | Symbol | Replicates | Species | Organ | Tissue | Adj P-value | Log2FC | Malignancy |
| 4850 | CNOT4 | HTA11_3410_2000001011 | Human | Colorectum | AD | 2.66e-09 | -4.65e-01 | 0.0155 |
| 4850 | CNOT4 | HTA11_696_2000001011 | Human | Colorectum | AD | 3.52e-03 | -2.21e-01 | -0.1464 |
| 4850 | CNOT4 | HTA11_866_3004761011 | Human | Colorectum | AD | 7.46e-08 | -4.22e-01 | 0.096 |
| 4850 | CNOT4 | HTA11_7696_3000711011 | Human | Colorectum | AD | 2.66e-07 | -3.75e-01 | 0.0674 |
| 4850 | CNOT4 | HTA11_99999970781_79442 | Human | Colorectum | MSS | 3.83e-07 | -3.85e-01 | 0.294 |
| 4850 | CNOT4 | HTA11_99999971662_82457 | Human | Colorectum | MSS | 2.97e-05 | -3.32e-01 | 0.3859 |
| 4850 | CNOT4 | HTA11_99999974143_84620 | Human | Colorectum | MSS | 2.82e-07 | -4.27e-01 | 0.3005 |
| 4850 | CNOT4 | A015-C-203 | Human | Colorectum | FAP | 2.34e-27 | -3.76e-01 | -0.1294 |
| 4850 | CNOT4 | A015-C-204 | Human | Colorectum | FAP | 1.84e-04 | -2.89e-01 | -0.0228 |
| 4850 | CNOT4 | A014-C-040 | Human | Colorectum | FAP | 1.38e-03 | -3.48e-01 | -0.1184 |
| 4850 | CNOT4 | A002-C-201 | Human | Colorectum | FAP | 5.64e-11 | -2.86e-01 | 0.0324 |
| 4850 | CNOT4 | A001-C-119 | Human | Colorectum | FAP | 1.49e-06 | -4.56e-01 | -0.1557 |
| 4850 | CNOT4 | A001-C-108 | Human | Colorectum | FAP | 6.54e-13 | -2.08e-01 | -0.0272 |
| 4850 | CNOT4 | A002-C-205 | Human | Colorectum | FAP | 6.64e-17 | -2.93e-01 | -0.1236 |
| 4850 | CNOT4 | A015-C-006 | Human | Colorectum | FAP | 3.90e-12 | -3.43e-01 | -0.0994 |
| 4850 | CNOT4 | A015-C-106 | Human | Colorectum | FAP | 2.64e-09 | -2.76e-01 | -0.0511 |
| 4850 | CNOT4 | A002-C-114 | Human | Colorectum | FAP | 1.02e-15 | -2.62e-01 | -0.1561 |
| 4850 | CNOT4 | A015-C-104 | Human | Colorectum | FAP | 3.52e-29 | -3.07e-01 | -0.1899 |
| 4850 | CNOT4 | A001-C-014 | Human | Colorectum | FAP | 1.29e-09 | -2.18e-01 | 0.0135 |
| 4850 | CNOT4 | A002-C-016 | Human | Colorectum | FAP | 1.27e-18 | -2.73e-01 | 0.0521 |
| Page: 1 2 3 4 5 6 7 8 9 |
| Tissue | Expression Dynamics | Abbreviation |
| Colorectum (GSE201348) |  | FAP: Familial adenomatous polyposis |
| CRC: Colorectal cancer | ||
| Colorectum (HTA11) |  | AD: Adenomas |
| SER: Sessile serrated lesions | ||
| MSI-H: Microsatellite-high colorectal cancer | ||
| MSS: Microsatellite stable colorectal cancer | ||
| Esophagus | 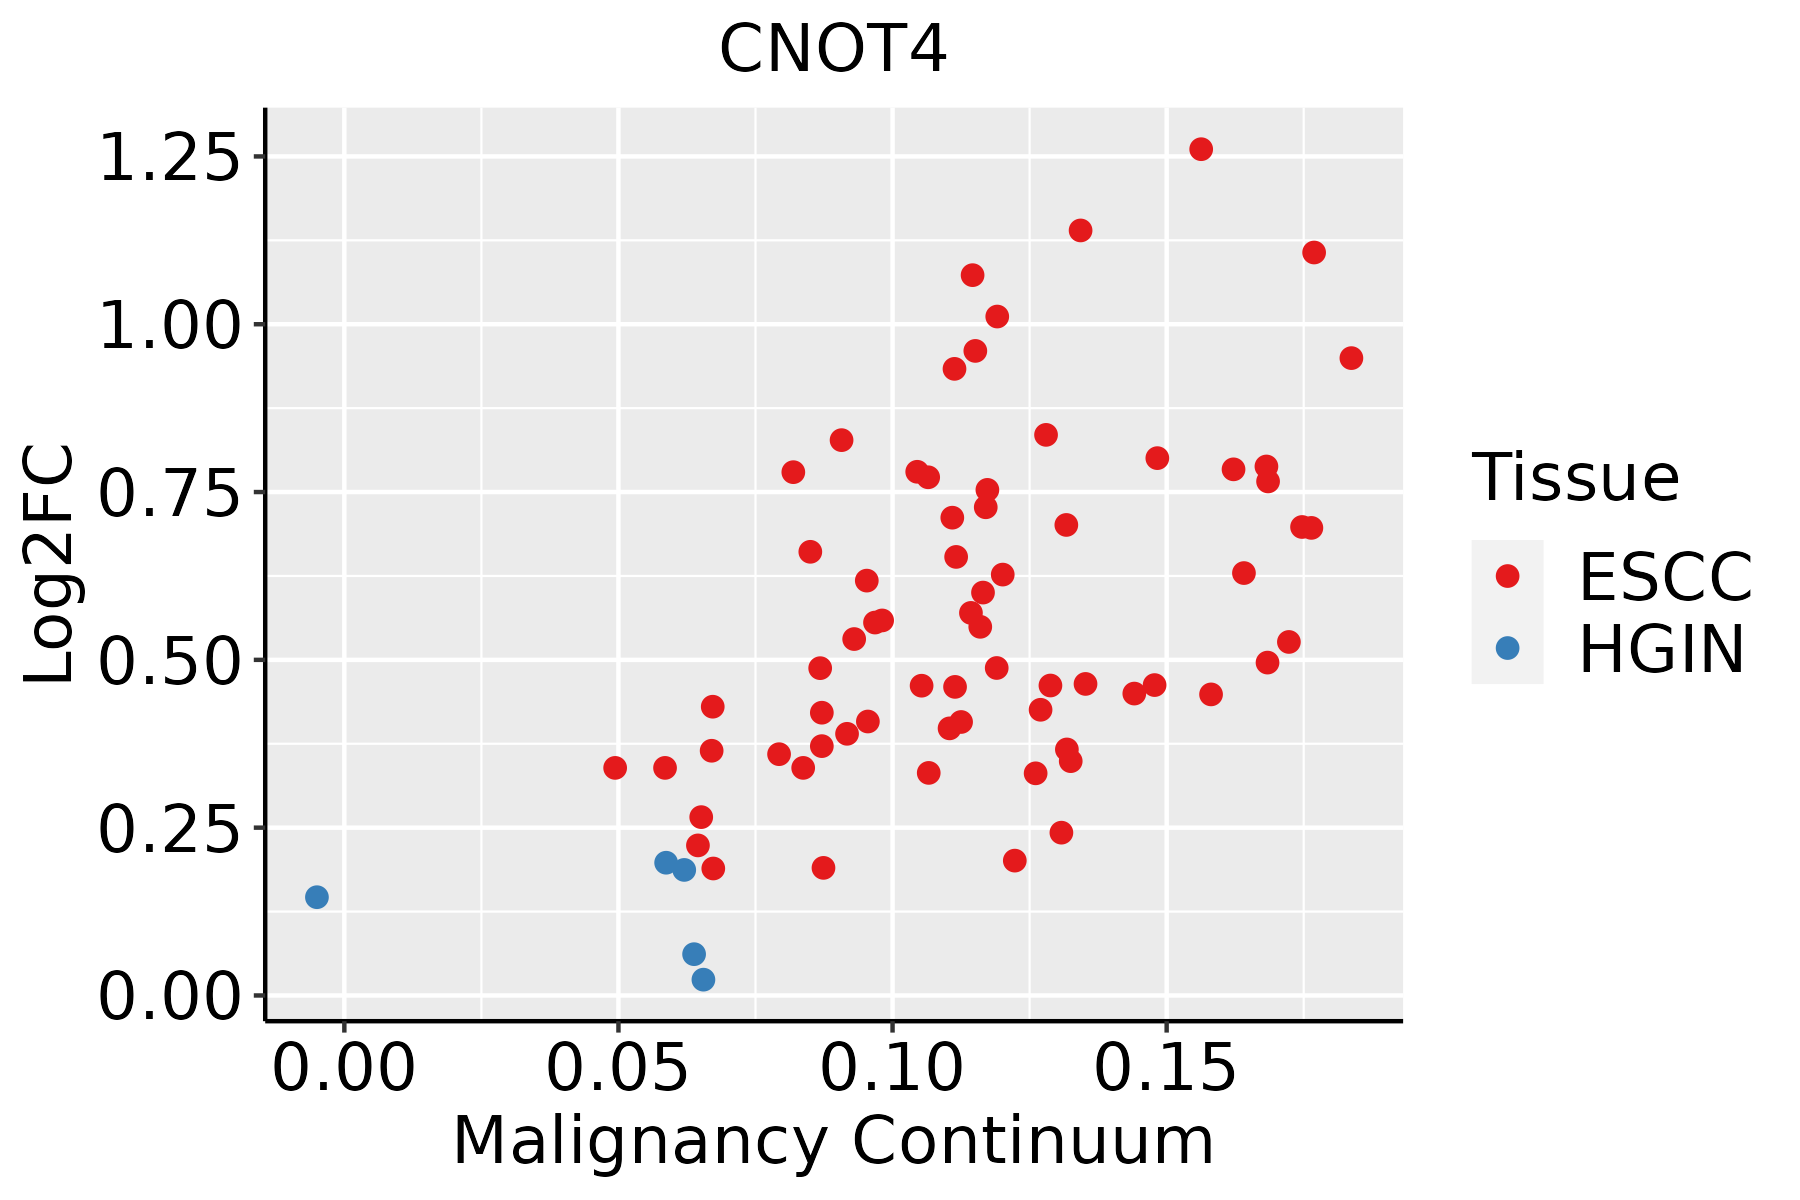 | ESCC: Esophageal squamous cell carcinoma |
| HGIN: High-grade intraepithelial neoplasias | ||
| LGIN: Low-grade intraepithelial neoplasias | ||
| Liver | 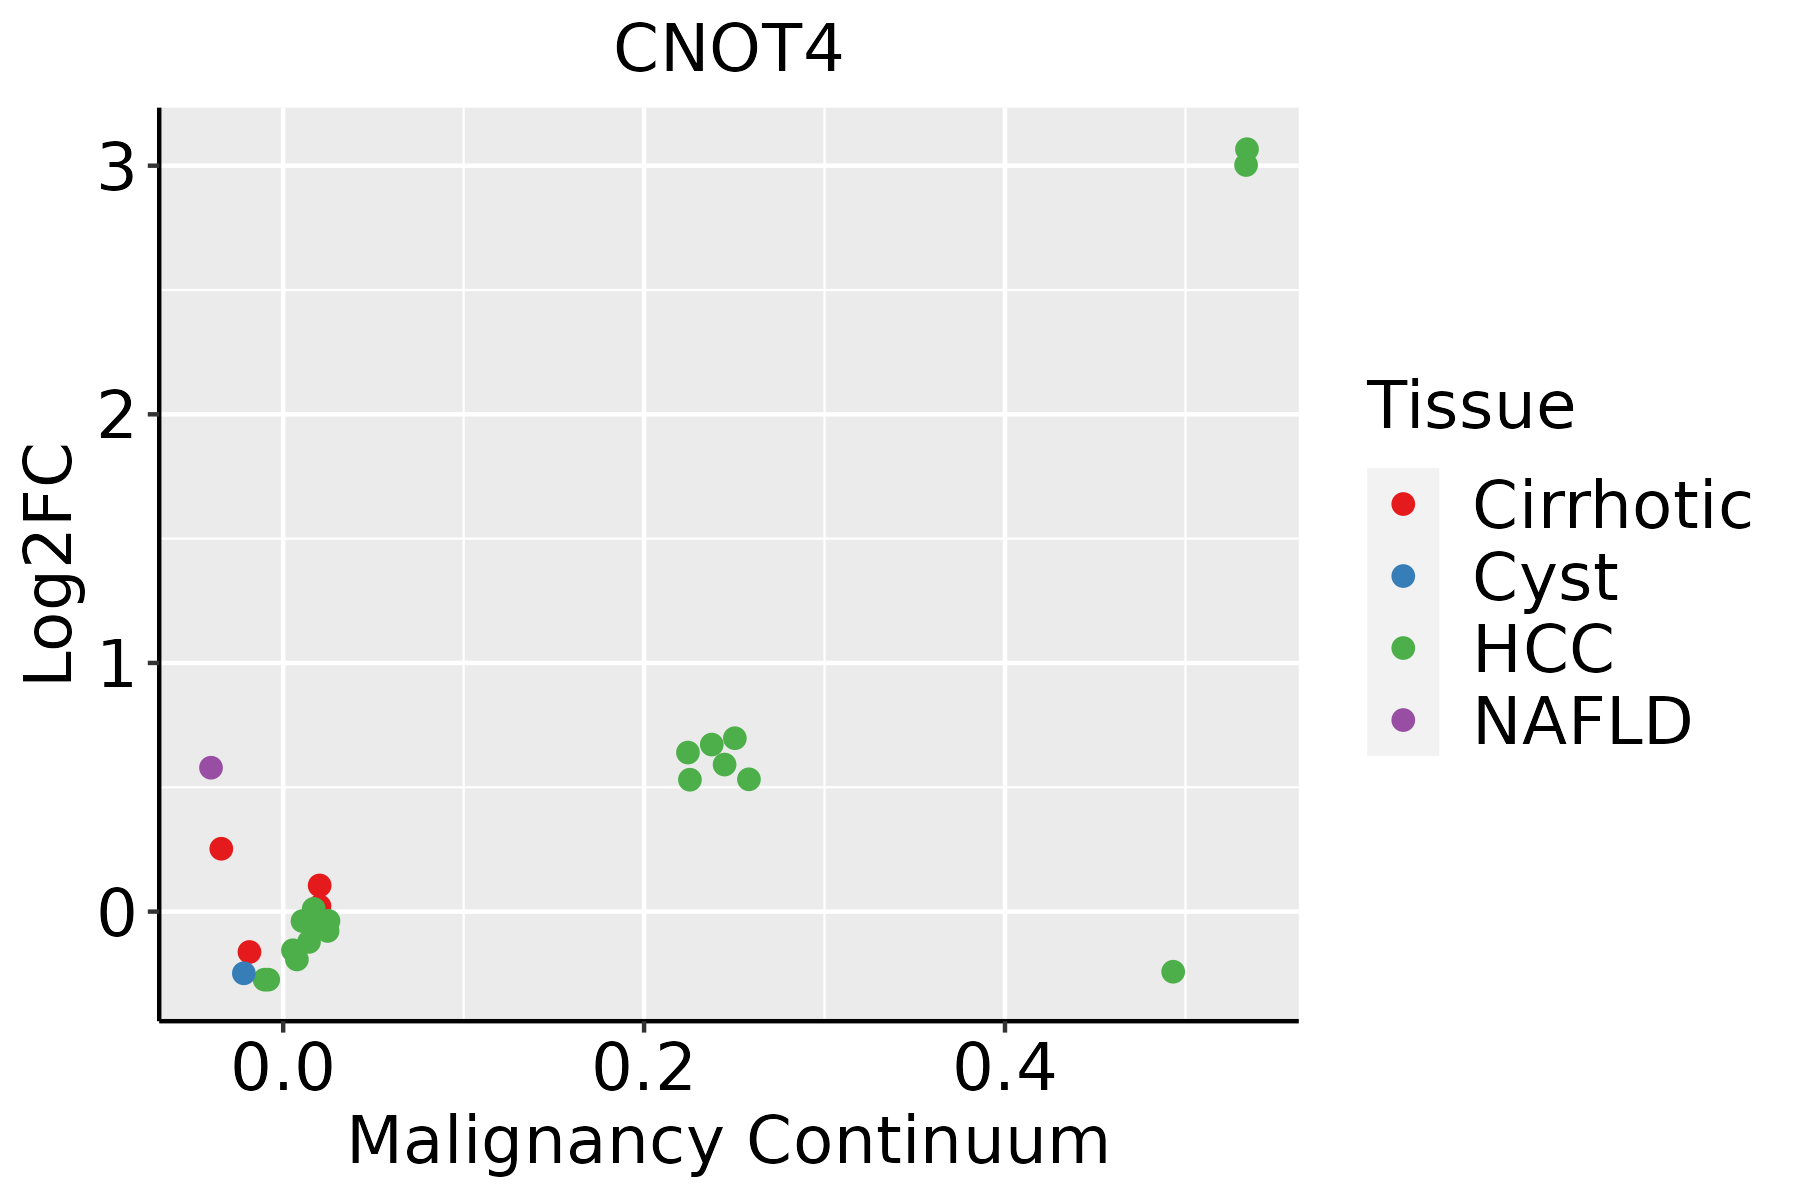 | HCC: Hepatocellular carcinoma |
| NAFLD: Non-alcoholic fatty liver disease | ||
| Lung | 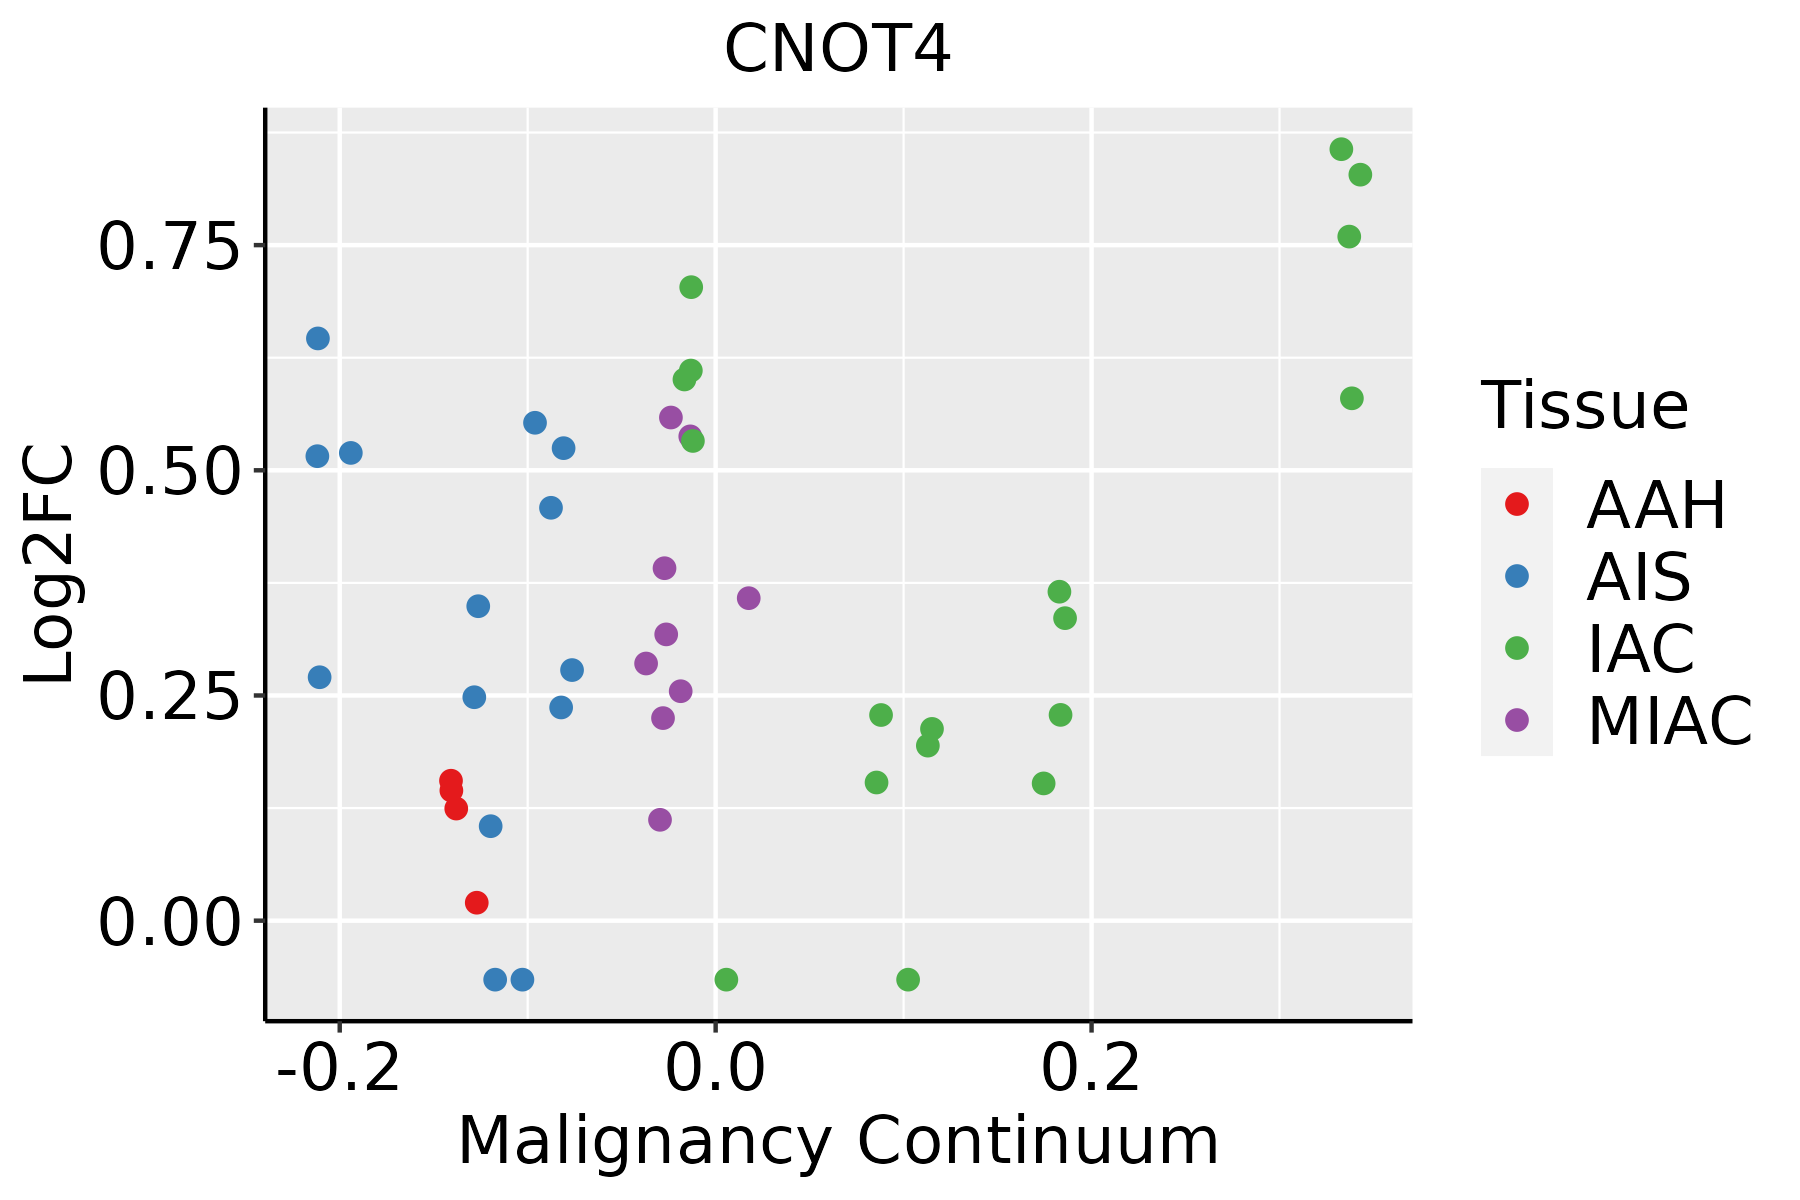 | AAH: Atypical adenomatous hyperplasia |
| AIS: Adenocarcinoma in situ | ||
| IAC: Invasive lung adenocarcinoma | ||
| MIA: Minimally invasive adenocarcinoma | ||
| Oral Cavity | 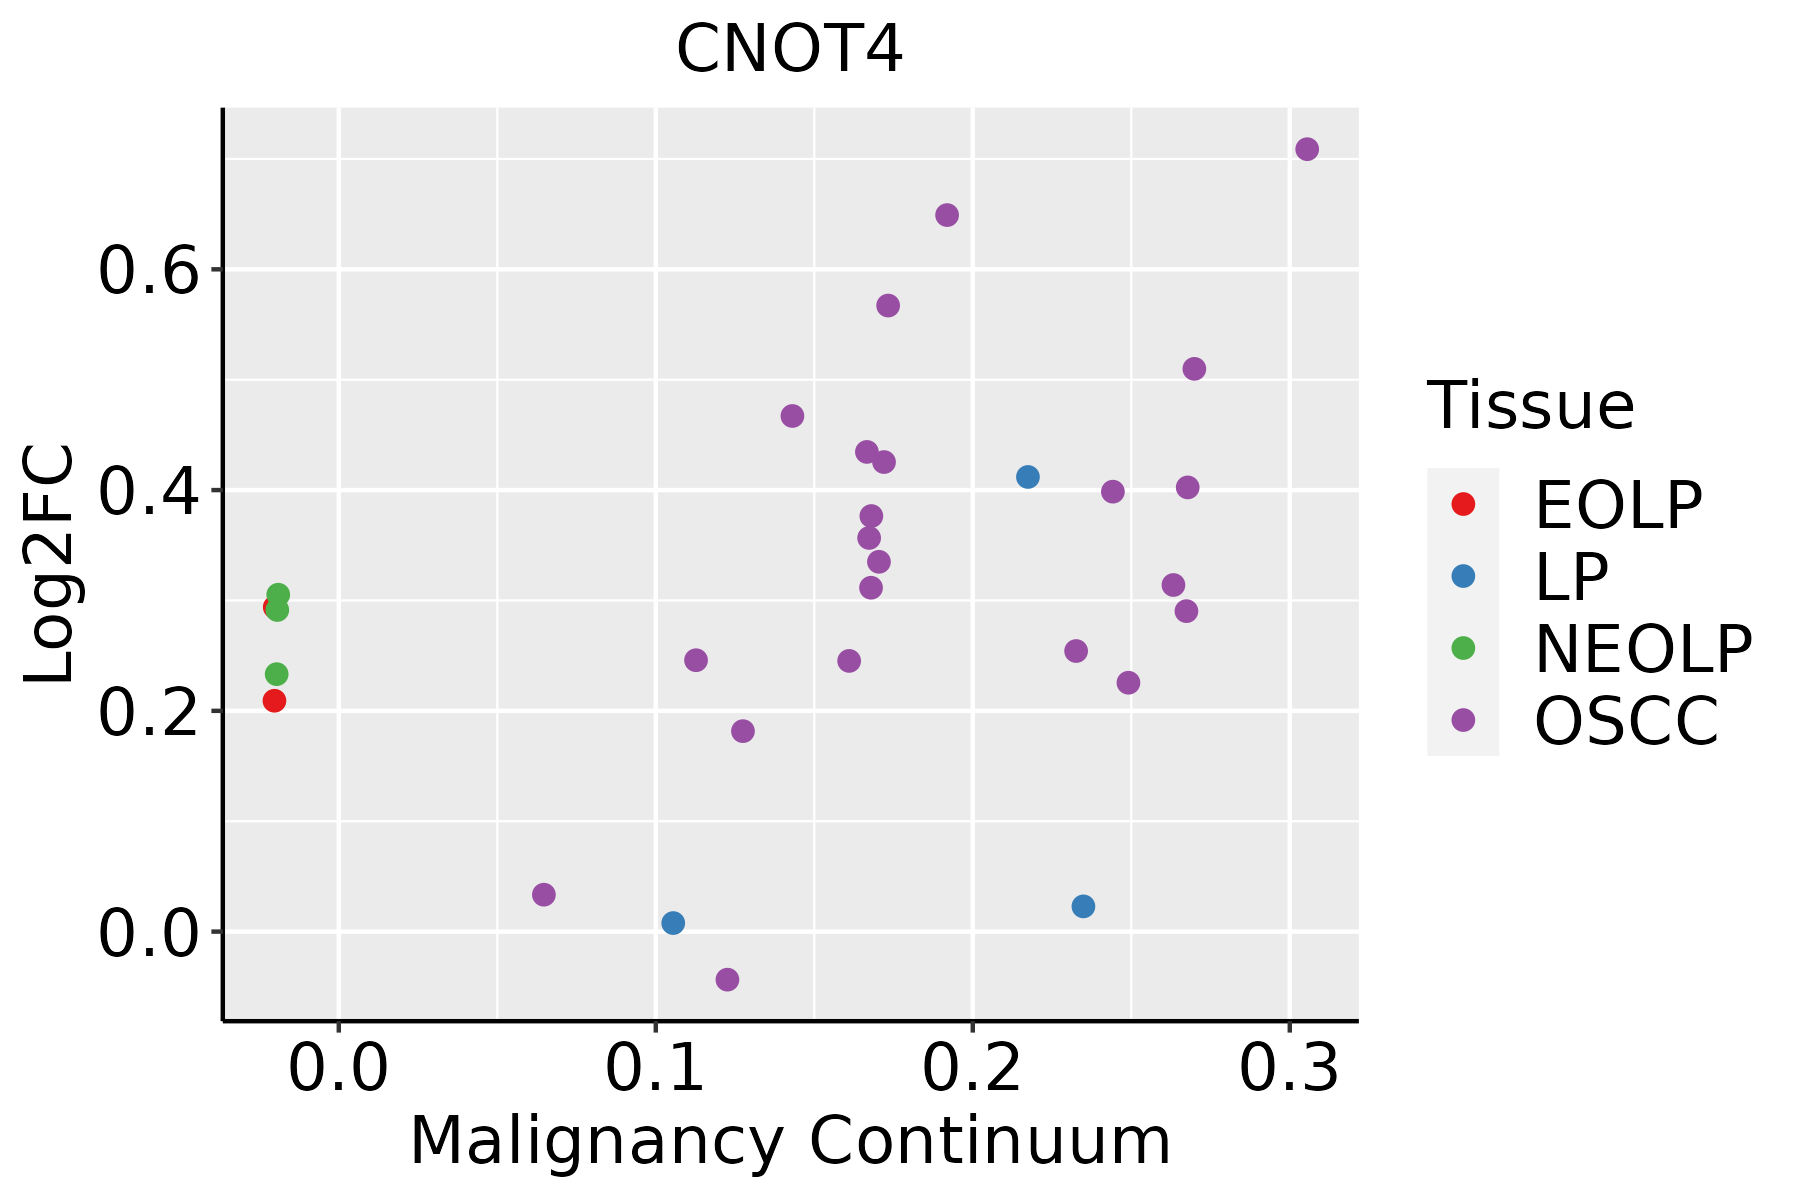 | EOLP: Erosive Oral lichen planus |
| LP: leukoplakia | ||
| NEOLP: Non-erosive oral lichen planus | ||
| OSCC: Oral squamous cell carcinoma | ||
| Thyroid | 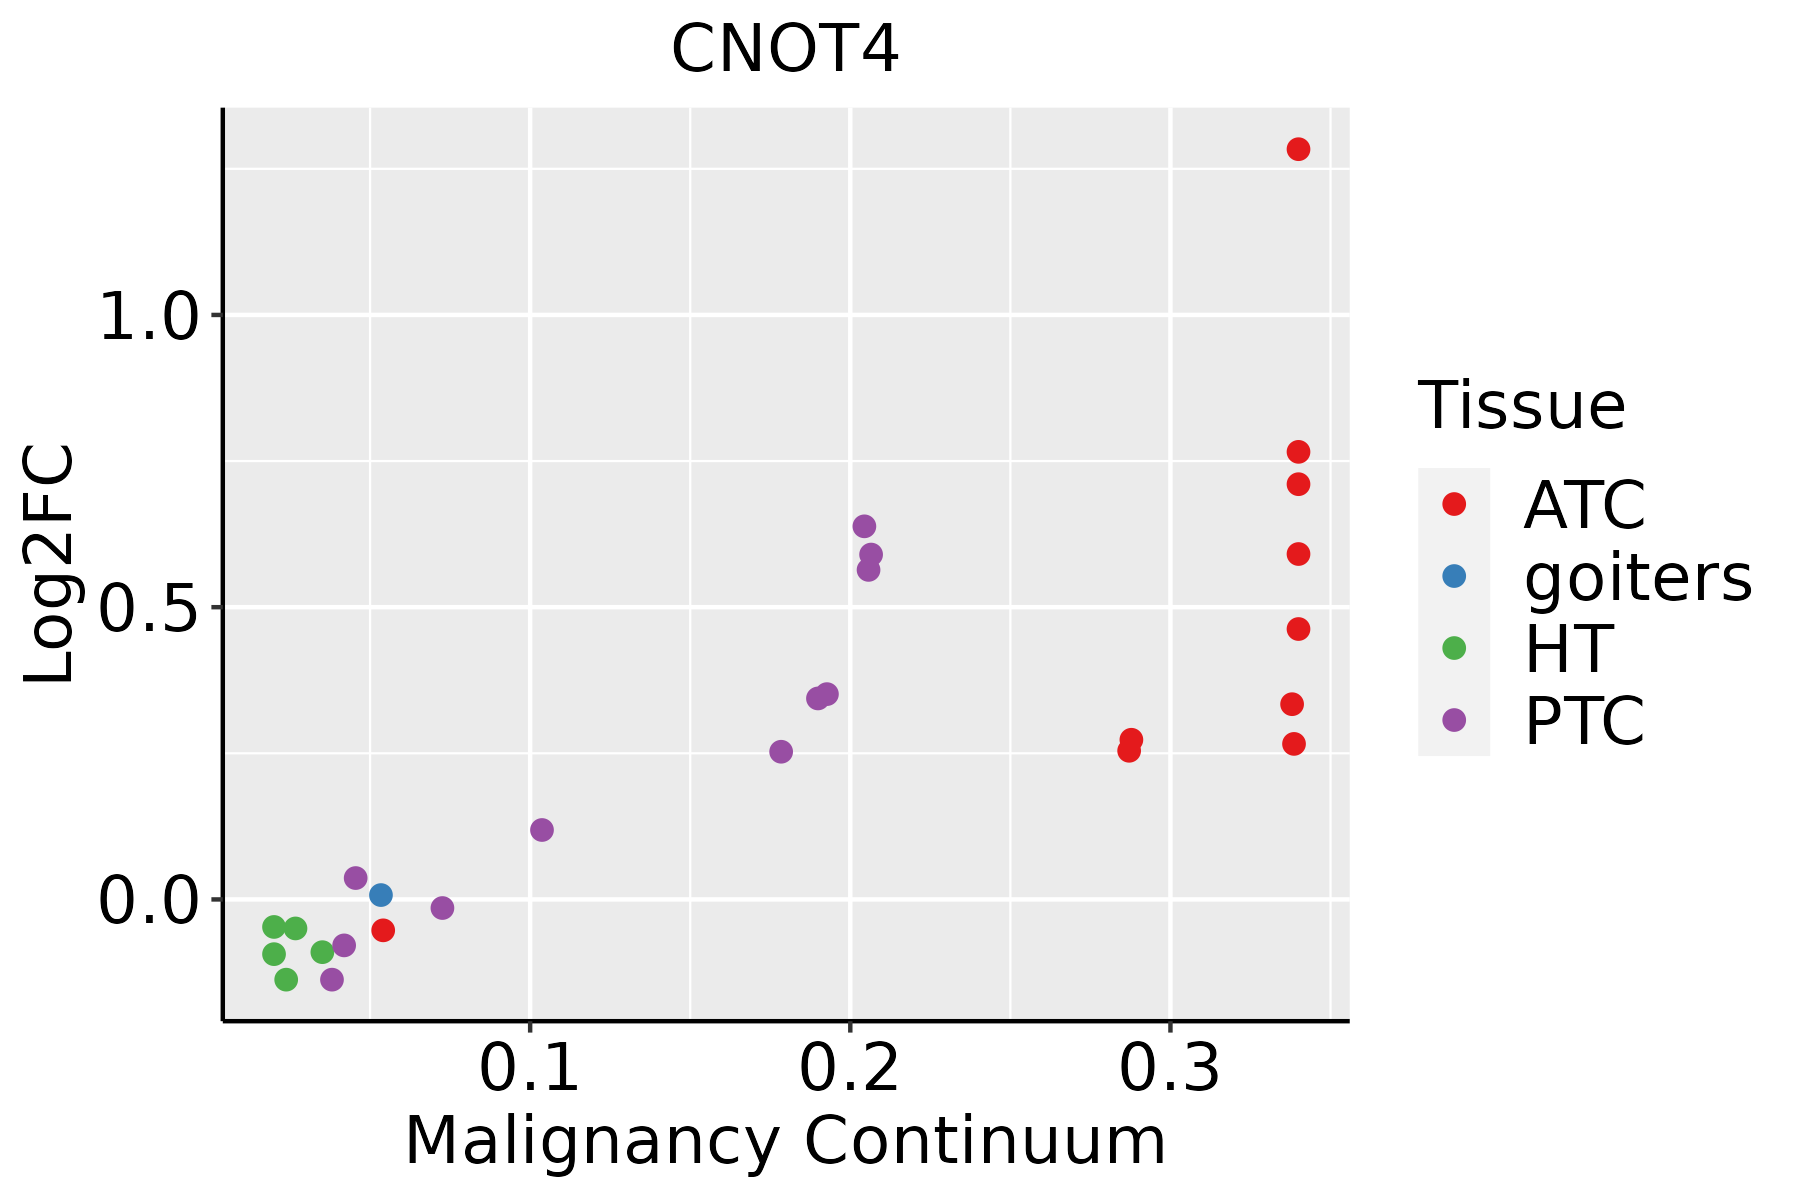 | ATC: Anaplastic thyroid cancer |
| HT: Hashimoto's thyroiditis | ||
| PTC: Papillary thyroid cancer |
| ∗log2FC in expression of this searched gene in stem-like cells from each diseased tissue sample relative to stem-like cells in normal samples in each tissue plotted against the malignancy continuum. Samples are colored based on if they are from different disease stage. |
Top |
Malignant transformation related pathway analysis |
| Find out the enriched GO biological processes and KEGG pathways involved in transition from healthy to precancer to cancer |
| Tissue | Disease Stage | Enriched GO biological Processes |
| Colorectum | AD |  |
| Colorectum | SER |  |
| Colorectum | MSS |  |
| Colorectum | MSI-H |  |
| Colorectum | FAP |  |
| ∗Top 15 enriched GO BP terms are showed in the bar plot of each disease state in each tissue. Each row represents a significant GO biological process which is colored according to the -log10(p.adjust). |
| Page: 1 2 3 4 5 6 7 8 9 |
| GO ID | Tissue | Disease Stage | Description | Gene Ratio | Bg Ratio | pvalue | p.adjust | Count |
| GO:0030099 | Colorectum | AD | myeloid cell differentiation | 119/3918 | 381/18723 | 1.24e-06 | 4.01e-05 | 119 |
| GO:0051865 | Colorectum | AD | protein autoubiquitination | 28/3918 | 73/18723 | 4.87e-04 | 5.30e-03 | 28 |
| GO:1903706 | Colorectum | AD | regulation of hemopoiesis | 99/3918 | 367/18723 | 3.08e-03 | 2.28e-02 | 99 |
| GO:0045637 | Colorectum | AD | regulation of myeloid cell differentiation | 61/3918 | 210/18723 | 3.17e-03 | 2.35e-02 | 61 |
| GO:00300992 | Colorectum | MSS | myeloid cell differentiation | 110/3467 | 381/18723 | 4.48e-07 | 1.75e-05 | 110 |
| GO:00518651 | Colorectum | MSS | protein autoubiquitination | 25/3467 | 73/18723 | 1.00e-03 | 1.00e-02 | 25 |
| GO:19037061 | Colorectum | MSS | regulation of hemopoiesis | 89/3467 | 367/18723 | 3.39e-03 | 2.56e-02 | 89 |
| GO:00456371 | Colorectum | MSS | regulation of myeloid cell differentiation | 54/3467 | 210/18723 | 5.85e-03 | 3.96e-02 | 54 |
| GO:00300994 | Colorectum | FAP | myeloid cell differentiation | 81/2622 | 381/18723 | 6.33e-05 | 1.22e-03 | 81 |
| GO:00518652 | Colorectum | FAP | protein autoubiquitination | 22/2622 | 73/18723 | 2.88e-04 | 3.77e-03 | 22 |
| GO:19037063 | Colorectum | FAP | regulation of hemopoiesis | 69/2622 | 367/18723 | 6.01e-03 | 3.78e-02 | 69 |
| GO:00300995 | Colorectum | CRC | myeloid cell differentiation | 66/2078 | 381/18723 | 1.59e-04 | 2.87e-03 | 66 |
| GO:00518653 | Colorectum | CRC | protein autoubiquitination | 18/2078 | 73/18723 | 8.33e-04 | 1.04e-02 | 18 |
| GO:003009927 | Esophagus | HGIN | myeloid cell differentiation | 83/2587 | 381/18723 | 1.26e-05 | 3.52e-04 | 83 |
| GO:004563725 | Esophagus | HGIN | regulation of myeloid cell differentiation | 49/2587 | 210/18723 | 1.28e-04 | 2.61e-03 | 49 |
| GO:190370620 | Esophagus | HGIN | regulation of hemopoiesis | 69/2587 | 367/18723 | 4.39e-03 | 3.86e-02 | 69 |
| GO:0030099111 | Esophagus | ESCC | myeloid cell differentiation | 232/8552 | 381/18723 | 1.22e-09 | 2.90e-08 | 232 |
| GO:1903706110 | Esophagus | ESCC | regulation of hemopoiesis | 201/8552 | 367/18723 | 2.60e-04 | 1.58e-03 | 201 |
| GO:00518658 | Esophagus | ESCC | protein autoubiquitination | 47/8552 | 73/18723 | 9.72e-04 | 4.93e-03 | 47 |
| GO:0045637111 | Esophagus | ESCC | regulation of myeloid cell differentiation | 118/8552 | 210/18723 | 1.35e-03 | 6.43e-03 | 118 |
| Page: 1 2 3 |
| Pathway ID | Tissue | Disease Stage | Description | Gene Ratio | Bg Ratio | pvalue | p.adjust | qvalue | Count |
| hsa0301810 | Esophagus | HGIN | RNA degradation | 27/1383 | 79/8465 | 7.73e-05 | 9.00e-04 | 7.15e-04 | 27 |
| hsa0301815 | Esophagus | HGIN | RNA degradation | 27/1383 | 79/8465 | 7.73e-05 | 9.00e-04 | 7.15e-04 | 27 |
| hsa0301824 | Esophagus | ESCC | RNA degradation | 62/4205 | 79/8465 | 1.18e-07 | 9.39e-07 | 4.81e-07 | 62 |
| hsa0301834 | Esophagus | ESCC | RNA degradation | 62/4205 | 79/8465 | 1.18e-07 | 9.39e-07 | 4.81e-07 | 62 |
| hsa03018 | Liver | Cirrhotic | RNA degradation | 44/2530 | 79/8465 | 1.43e-06 | 1.65e-05 | 1.02e-05 | 44 |
| hsa030181 | Liver | Cirrhotic | RNA degradation | 44/2530 | 79/8465 | 1.43e-06 | 1.65e-05 | 1.02e-05 | 44 |
| hsa030182 | Liver | HCC | RNA degradation | 58/4020 | 79/8465 | 2.29e-06 | 2.19e-05 | 1.22e-05 | 58 |
| hsa030183 | Liver | HCC | RNA degradation | 58/4020 | 79/8465 | 2.29e-06 | 2.19e-05 | 1.22e-05 | 58 |
| hsa030189 | Oral cavity | OSCC | RNA degradation | 59/3704 | 79/8465 | 2.05e-08 | 1.91e-07 | 9.70e-08 | 59 |
| hsa0301814 | Oral cavity | OSCC | RNA degradation | 59/3704 | 79/8465 | 2.05e-08 | 1.91e-07 | 9.70e-08 | 59 |
| hsa0301841 | Oral cavity | EOLP | RNA degradation | 22/1218 | 79/8465 | 1.33e-03 | 4.80e-03 | 2.83e-03 | 22 |
| hsa0301851 | Oral cavity | EOLP | RNA degradation | 22/1218 | 79/8465 | 1.33e-03 | 4.80e-03 | 2.83e-03 | 22 |
| Page: 1 |
Top |
Cell-cell communication analysis |
| Identification of potential cell-cell interactions between two cell types and their ligand-receptor pairs for different disease states |
| Ligand | Receptor | LRpair | Pathway | Tissue | Disease Stage |
| Page: 1 |
Top |
Single-cell gene regulatory network inference analysis |
| Find out the significant the regulons (TFs) and the target genes of each regulon across cell types for different disease states |
| TF | Cell Type | Tissue | Disease Stage | Target Gene | RSS | Regulon Activity |
| CNOT4 | MSC | Liver | HCC | RNF219,CCDC149,SLMAP, etc. | 1.31e-02 |  |
| CNOT4 | CD8TEXP | Prostate | ADJ | ABCB10,ACSL1,CORO7, etc. | 4.21e-02 |  |
| CNOT4 | CD4TN | Stomach | CAG | TSPAN32,MED23,KIZ, etc. | 1.36e-02 |  |
| CNOT4 | TH17 | Stomach | CAG | TSPAN32,MED23,KIZ, etc. | 1.79e-02 | |
| CNOT4 | TREG | Stomach | Healthy | TSPAN32,MED23,KIZ, etc. | 0.00e+00 |  |
| CNOT4 | CD4TN | Stomach | Healthy | TSPAN32,MED23,KIZ, etc. | 0.00e+00 | |
| CNOT4 | GC | Stomach | SIM | TSPAN32,MED23,KIZ, etc. | 1.98e-02 |  |
| CNOT4 | CD8TEXINT | Stomach | SIM | TSPAN32,MED23,KIZ, etc. | 3.31e-02 | |
| CNOT4 | pDC | Thyroid | Healthy | FUCA1,COL1A2,LINC002481, etc. | 1.09e-01 |  |
| CNOT4 | M2MAC | Thyroid | HT | FUCA1,COL1A2,LINC002481, etc. | 2.48e-02 |  |
| ∗The dot plots of a searched regulon are shown for all cell subpopulations in each disease state of each tissue based on the regulon specific score inferred using pySCENIC and by calculating the average expression. |
| Page: 1 2 |
Top |
Somatic mutation of malignant transformation related genes |
| Annotation of somatic variants for genes involved in malignant transformation |
| Hugo Symbol | Variant Class | Variant Classification | dbSNP RS | HGVSc | HGVSp | HGVSp Short | SWISSPROT | BIOTYPE | SIFT | PolyPhen | Tumor Sample Barcode | Tissue | Histology | Sex | Age | Stage | Therapy Types | Drugs | Outcome |
| CNOT4 | SNV | Missense_Mutation | novel | c.578C>T | p.Thr193Ile | p.T193I | O95628 | protein_coding | deleterious(0) | probably_damaging(0.999) | TCGA-BH-A0HF-01 | Breast | breast invasive carcinoma | Female | >=65 | I/II | Hormone Therapy | arimidex | SD |
| CNOT4 | SNV | Missense_Mutation | c.856G>T | p.Gly286Trp | p.G286W | O95628 | protein_coding | tolerated(0.17) | possibly_damaging(0.723) | TCGA-D8-A1J8-01 | Breast | breast invasive carcinoma | Female | >=65 | I/II | Hormone Therapy | nolvadex | SD | |
| CNOT4 | insertion | Nonsense_Mutation | novel | c.1310_1311insTAATTAATGAGAGCATGAGGGATAAAGCCACTCTCTACCTACTTTT | p.Gln437HisfsTer3 | p.Q437Hfs*3 | O95628 | protein_coding | TCGA-A8-A06P-01 | Breast | breast invasive carcinoma | Female | <65 | III/IV | Unspecific | SD | |||
| CNOT4 | insertion | Frame_Shift_Ins | novel | c.472_473insTGAAT | p.Ser158MetfsTer6 | p.S158Mfs*6 | O95628 | protein_coding | TCGA-AC-A3QQ-01 | Breast | breast invasive carcinoma | Female | <65 | I/II | Unknown | Unknown | SD | ||
| CNOT4 | SNV | Missense_Mutation | novel | c.1959G>T | p.Gln653His | p.Q653H | O95628 | protein_coding | tolerated_low_confidence(0.19) | benign(0.001) | TCGA-2W-A8YY-01 | Cervix | cervical & endocervical cancer | Female | <65 | I/II | Chemotherapy | cisplatin | CR |
| CNOT4 | SNV | Missense_Mutation | novel | c.964N>A | p.Ala322Thr | p.A322T | O95628 | protein_coding | deleterious_low_confidence(0.03) | benign(0.297) | TCGA-5M-AAT6-01 | Colorectum | colon adenocarcinoma | Female | <65 | III/IV | Unknown | Unknown | PD |
| CNOT4 | SNV | Missense_Mutation | novel | c.383G>A | p.Arg128Gln | p.R128Q | O95628 | protein_coding | tolerated(0.09) | benign(0.18) | TCGA-AA-3984-01 | Colorectum | colon adenocarcinoma | Female | <65 | I/II | Unknown | Unknown | SD |
| CNOT4 | SNV | Missense_Mutation | c.131N>A | p.Arg44Gln | p.R44Q | O95628 | protein_coding | deleterious(0.02) | possibly_damaging(0.569) | TCGA-AA-A00N-01 | Colorectum | colon adenocarcinoma | Male | >=65 | I/II | Unknown | Unknown | PD | |
| CNOT4 | SNV | Missense_Mutation | novel | c.2101C>A | p.Pro701Thr | p.P701T | O95628 | protein_coding | tolerated_low_confidence(0.07) | benign(0) | TCGA-AD-6964-01 | Colorectum | colon adenocarcinoma | Male | <65 | III/IV | Chemotherapy | folfox | PD |
| CNOT4 | SNV | Missense_Mutation | c.316N>A | p.Val106Ile | p.V106I | O95628 | protein_coding | tolerated(0.16) | benign(0.249) | TCGA-AZ-4315-01 | Colorectum | colon adenocarcinoma | Male | <65 | I/II | Unknown | Unknown | SD |
| Page: 1 2 3 4 5 6 7 8 |
Top |
Related drugs of malignant transformation related genes |
| Identification of chemicals and drugs interact with genes involved in malignant transfromation |
| (DGIdb 4.0) |
| Entrez ID | Symbol | Category | Interaction Types | Drug Claim Name | Drug Name | PMIDs |
| Page: 1 |

Copyright 2023-Present -The University of Texas Health Science Center at Houston |