
|
|||||
|
 | |
| |
| |
| |
| |
| |
|
Gene: CNOT3 |
Gene summary for CNOT3 |
| Gene information | Species | Human | Gene symbol | CNOT3 | Gene ID | 4849 |
| Gene name | CCR4-NOT transcription complex subunit 3 | |
| Gene Alias | IDDSADF | |
| Cytomap | 19q13.42 | |
| Gene Type | protein-coding | GO ID | GO:0000288 | UniProtAcc | A0A024R4R3 |
Top |
Malignant transformation analysis |
| Identification of the aberrant gene expression in precancerous and cancerous lesions by comparing the gene expression of stem-like cells in diseased tissues with normal stem cells |
| Entrez ID | Symbol | Replicates | Species | Organ | Tissue | Adj P-value | Log2FC | Malignancy |
| 4849 | CNOT3 | LZE4T | Human | Esophagus | ESCC | 4.39e-07 | 2.24e-01 | 0.0811 |
| 4849 | CNOT3 | LZE7T | Human | Esophagus | ESCC | 5.79e-07 | 3.07e-01 | 0.0667 |
| 4849 | CNOT3 | LZE8T | Human | Esophagus | ESCC | 3.39e-04 | 1.84e-01 | 0.067 |
| 4849 | CNOT3 | LZE20T | Human | Esophagus | ESCC | 5.69e-05 | 1.80e-01 | 0.0662 |
| 4849 | CNOT3 | LZE22T | Human | Esophagus | ESCC | 8.60e-08 | 4.62e-01 | 0.068 |
| 4849 | CNOT3 | LZE24T | Human | Esophagus | ESCC | 3.34e-22 | 4.62e-01 | 0.0596 |
| 4849 | CNOT3 | LZE22D3 | Human | Esophagus | HGIN | 8.52e-03 | 4.13e-01 | 0.0653 |
| 4849 | CNOT3 | P1T-E | Human | Esophagus | ESCC | 1.70e-11 | 4.20e-01 | 0.0875 |
| 4849 | CNOT3 | P2T-E | Human | Esophagus | ESCC | 1.01e-25 | 3.49e-01 | 0.1177 |
| 4849 | CNOT3 | P4T-E | Human | Esophagus | ESCC | 8.14e-16 | 3.70e-01 | 0.1323 |
| 4849 | CNOT3 | P5T-E | Human | Esophagus | ESCC | 1.44e-05 | 1.63e-01 | 0.1327 |
| 4849 | CNOT3 | P8T-E | Human | Esophagus | ESCC | 5.58e-47 | 8.04e-01 | 0.0889 |
| 4849 | CNOT3 | P9T-E | Human | Esophagus | ESCC | 7.26e-09 | 2.06e-01 | 0.1131 |
| 4849 | CNOT3 | P10T-E | Human | Esophagus | ESCC | 2.24e-32 | 5.43e-01 | 0.116 |
| 4849 | CNOT3 | P11T-E | Human | Esophagus | ESCC | 2.24e-11 | 4.00e-01 | 0.1426 |
| 4849 | CNOT3 | P12T-E | Human | Esophagus | ESCC | 2.29e-23 | 4.65e-01 | 0.1122 |
| 4849 | CNOT3 | P15T-E | Human | Esophagus | ESCC | 5.17e-37 | 6.74e-01 | 0.1149 |
| 4849 | CNOT3 | P16T-E | Human | Esophagus | ESCC | 5.34e-17 | 3.06e-01 | 0.1153 |
| 4849 | CNOT3 | P17T-E | Human | Esophagus | ESCC | 3.57e-11 | 4.42e-01 | 0.1278 |
| 4849 | CNOT3 | P19T-E | Human | Esophagus | ESCC | 3.14e-03 | 3.48e-01 | 0.1662 |
| Page: 1 2 3 4 5 |
| Tissue | Expression Dynamics | Abbreviation |
| Esophagus |  | ESCC: Esophageal squamous cell carcinoma |
| HGIN: High-grade intraepithelial neoplasias | ||
| LGIN: Low-grade intraepithelial neoplasias | ||
| Liver |  | HCC: Hepatocellular carcinoma |
| NAFLD: Non-alcoholic fatty liver disease | ||
| Oral Cavity | 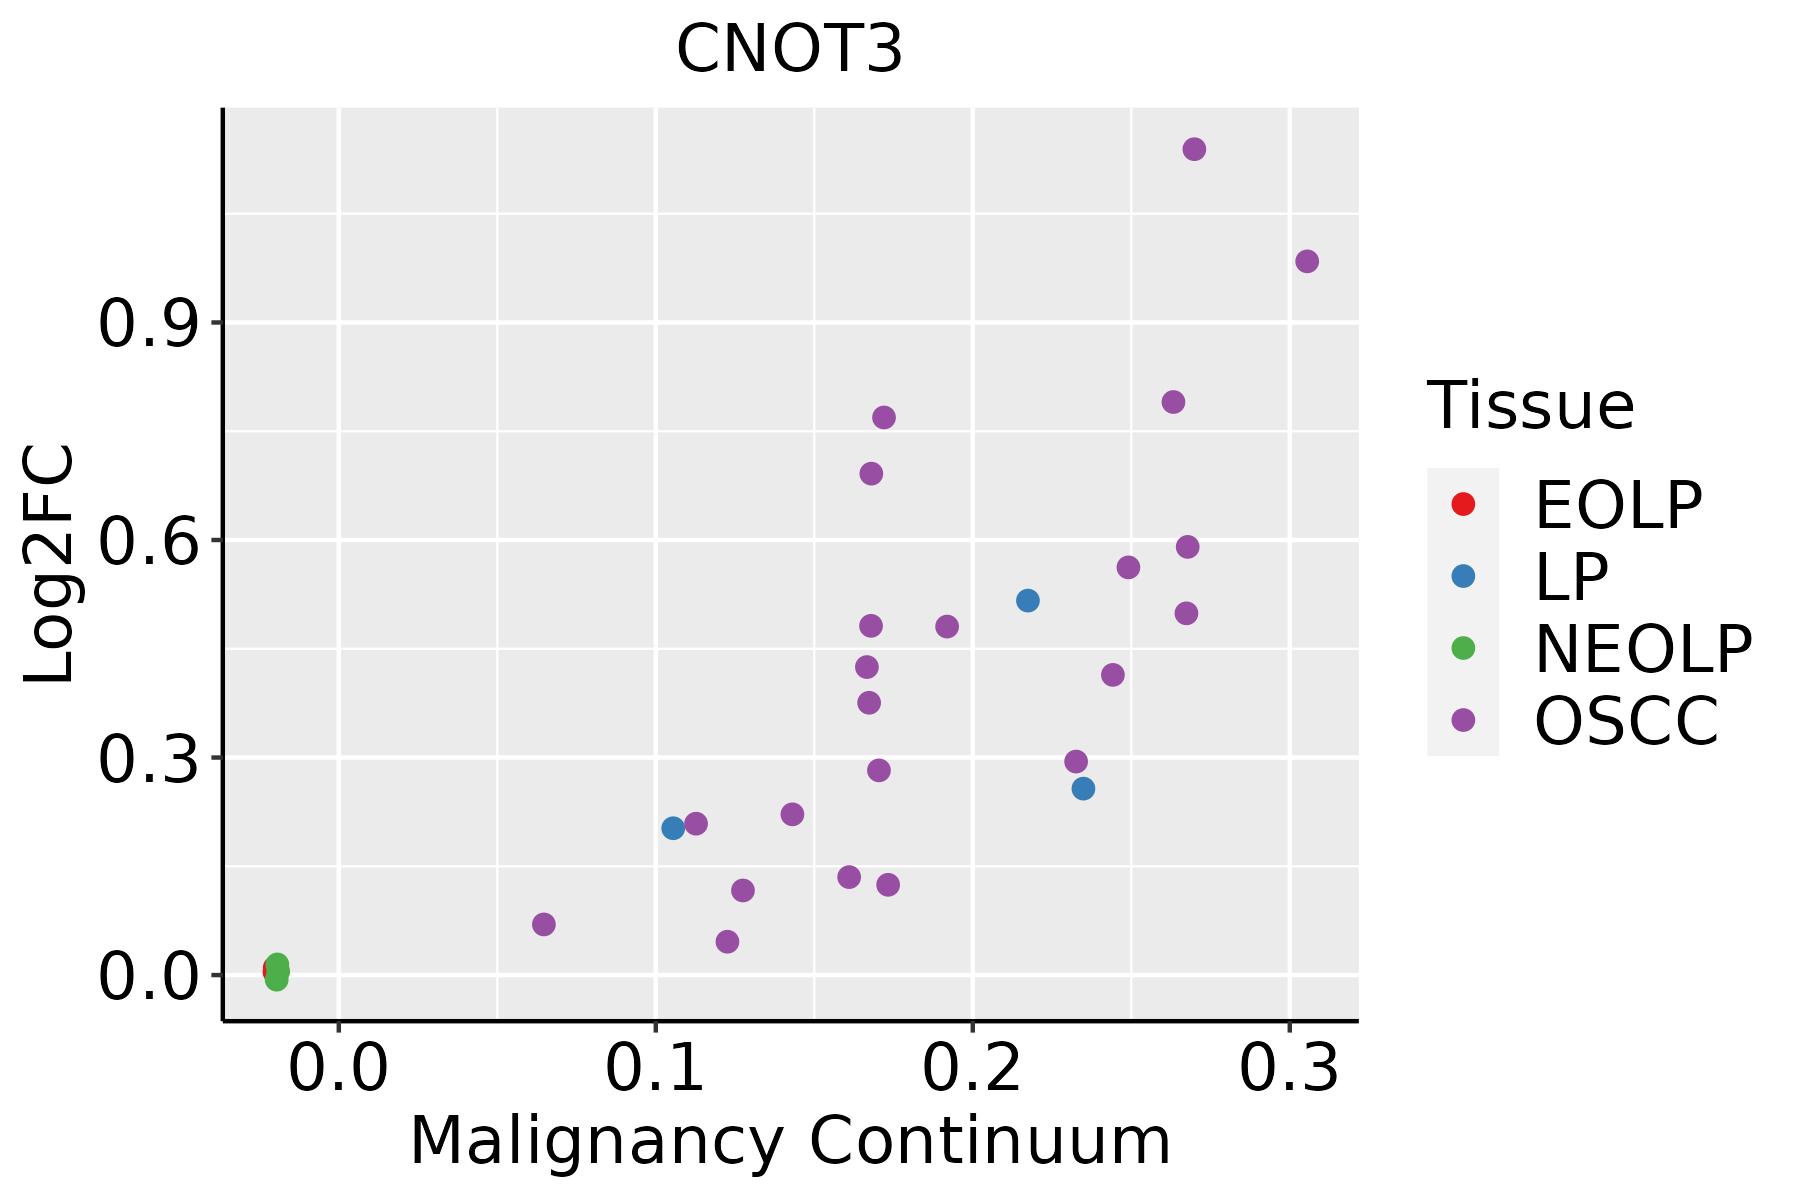 | EOLP: Erosive Oral lichen planus |
| LP: leukoplakia | ||
| NEOLP: Non-erosive oral lichen planus | ||
| OSCC: Oral squamous cell carcinoma | ||
| Skin | 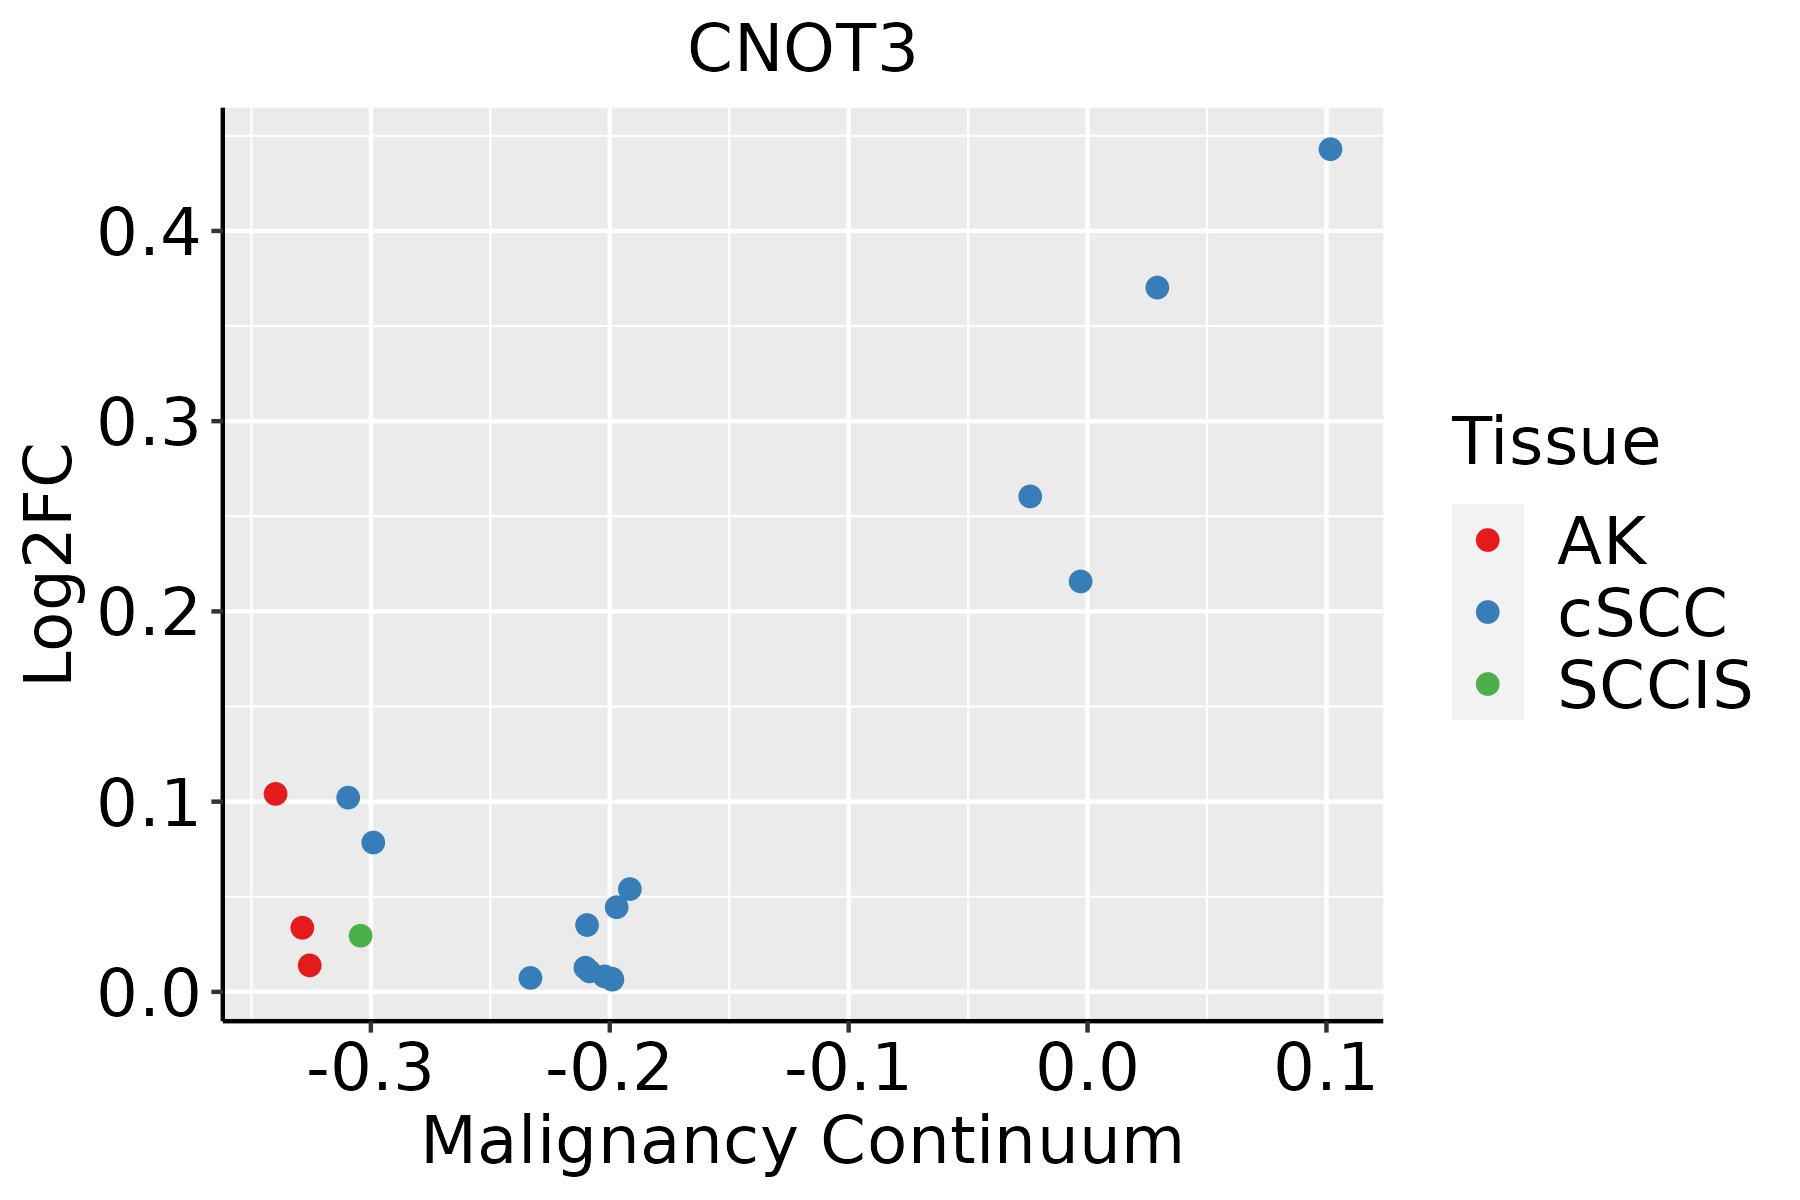 | AK: Actinic keratosis |
| cSCC: Cutaneous squamous cell carcinoma | ||
| SCCIS:squamous cell carcinoma in situ |
| ∗log2FC in expression of this searched gene in stem-like cells from each diseased tissue sample relative to stem-like cells in normal samples in each tissue plotted against the malignancy continuum. Samples are colored based on if they are from different disease stage. |
Top |
Malignant transformation related pathway analysis |
| Find out the enriched GO biological processes and KEGG pathways involved in transition from healthy to precancer to cancer |
| Tissue | Disease Stage | Enriched GO biological Processes |
| Colorectum | AD |  |
| Colorectum | SER |  |
| Colorectum | MSS |  |
| Colorectum | MSI-H |  |
| Colorectum | FAP |  |
| ∗Top 15 enriched GO BP terms are showed in the bar plot of each disease state in each tissue. Each row represents a significant GO biological process which is colored according to the -log10(p.adjust). |
| Page: 1 2 3 4 5 6 7 8 9 |
| GO ID | Tissue | Disease Stage | Description | Gene Ratio | Bg Ratio | pvalue | p.adjust | Count |
| GO:000641727 | Esophagus | HGIN | regulation of translation | 139/2587 | 468/18723 | 1.46e-19 | 7.98e-17 | 139 |
| GO:190331120 | Esophagus | HGIN | regulation of mRNA metabolic process | 91/2587 | 288/18723 | 5.06e-15 | 9.78e-13 | 91 |
| GO:000989626 | Esophagus | HGIN | positive regulation of catabolic process | 126/2587 | 492/18723 | 1.46e-12 | 2.09e-10 | 126 |
| GO:003133126 | Esophagus | HGIN | positive regulation of cellular catabolic process | 112/2587 | 427/18723 | 5.15e-12 | 6.72e-10 | 112 |
| GO:000640120 | Esophagus | HGIN | RNA catabolic process | 77/2587 | 278/18723 | 7.63e-10 | 6.36e-08 | 77 |
| GO:000640220 | Esophagus | HGIN | mRNA catabolic process | 67/2587 | 232/18723 | 1.47e-09 | 1.13e-07 | 67 |
| GO:000095617 | Esophagus | HGIN | nuclear-transcribed mRNA catabolic process | 40/2587 | 112/18723 | 4.44e-09 | 3.03e-07 | 40 |
| GO:003465519 | Esophagus | HGIN | nucleobase-containing compound catabolic process | 98/2587 | 407/18723 | 1.44e-08 | 8.94e-07 | 98 |
| GO:004670017 | Esophagus | HGIN | heterocycle catabolic process | 103/2587 | 445/18723 | 5.44e-08 | 2.99e-06 | 103 |
| GO:004427018 | Esophagus | HGIN | cellular nitrogen compound catabolic process | 103/2587 | 451/18723 | 1.10e-07 | 5.56e-06 | 103 |
| GO:001943917 | Esophagus | HGIN | aromatic compound catabolic process | 105/2587 | 467/18723 | 1.89e-07 | 9.31e-06 | 105 |
| GO:190331310 | Esophagus | HGIN | positive regulation of mRNA metabolic process | 38/2587 | 118/18723 | 2.46e-07 | 1.16e-05 | 38 |
| GO:00198277 | Esophagus | HGIN | stem cell population maintenance | 39/2587 | 131/18723 | 1.63e-06 | 6.14e-05 | 39 |
| GO:190136117 | Esophagus | HGIN | organic cyclic compound catabolic process | 106/2587 | 495/18723 | 1.94e-06 | 7.13e-05 | 106 |
| GO:00342496 | Esophagus | HGIN | negative regulation of cellular amide metabolic process | 66/2587 | 273/18723 | 2.74e-06 | 9.60e-05 | 66 |
| GO:00987278 | Esophagus | HGIN | maintenance of cell number | 39/2587 | 134/18723 | 3.02e-06 | 1.03e-04 | 39 |
| GO:00171486 | Esophagus | HGIN | negative regulation of translation | 59/2587 | 245/18723 | 1.03e-05 | 2.96e-04 | 59 |
| GO:006101318 | Esophagus | HGIN | regulation of mRNA catabolic process | 43/2587 | 166/18723 | 2.48e-05 | 6.53e-04 | 43 |
| GO:000170118 | Esophagus | HGIN | in utero embryonic development | 77/2587 | 367/18723 | 9.56e-05 | 2.05e-03 | 77 |
| GO:000028810 | Esophagus | HGIN | nuclear-transcribed mRNA catabolic process, deadenylation-dependent decay | 19/2587 | 56/18723 | 1.10e-04 | 2.33e-03 | 19 |
| Page: 1 2 3 4 5 6 7 8 |
| Pathway ID | Tissue | Disease Stage | Description | Gene Ratio | Bg Ratio | pvalue | p.adjust | qvalue | Count |
| hsa0301810 | Esophagus | HGIN | RNA degradation | 27/1383 | 79/8465 | 7.73e-05 | 9.00e-04 | 7.15e-04 | 27 |
| hsa0301815 | Esophagus | HGIN | RNA degradation | 27/1383 | 79/8465 | 7.73e-05 | 9.00e-04 | 7.15e-04 | 27 |
| hsa0301824 | Esophagus | ESCC | RNA degradation | 62/4205 | 79/8465 | 1.18e-07 | 9.39e-07 | 4.81e-07 | 62 |
| hsa0301834 | Esophagus | ESCC | RNA degradation | 62/4205 | 79/8465 | 1.18e-07 | 9.39e-07 | 4.81e-07 | 62 |
| hsa030182 | Liver | HCC | RNA degradation | 58/4020 | 79/8465 | 2.29e-06 | 2.19e-05 | 1.22e-05 | 58 |
| hsa030183 | Liver | HCC | RNA degradation | 58/4020 | 79/8465 | 2.29e-06 | 2.19e-05 | 1.22e-05 | 58 |
| hsa030189 | Oral cavity | OSCC | RNA degradation | 59/3704 | 79/8465 | 2.05e-08 | 1.91e-07 | 9.70e-08 | 59 |
| hsa0301814 | Oral cavity | OSCC | RNA degradation | 59/3704 | 79/8465 | 2.05e-08 | 1.91e-07 | 9.70e-08 | 59 |
| Page: 1 |
Top |
Cell-cell communication analysis |
| Identification of potential cell-cell interactions between two cell types and their ligand-receptor pairs for different disease states |
| Ligand | Receptor | LRpair | Pathway | Tissue | Disease Stage |
| Page: 1 |
Top |
Single-cell gene regulatory network inference analysis |
| Find out the significant the regulons (TFs) and the target genes of each regulon across cell types for different disease states |
| TF | Cell Type | Tissue | Disease Stage | Target Gene | RSS | Regulon Activity |
| ∗The dot plots of a searched regulon are shown for all cell subpopulations in each disease state of each tissue based on the regulon specific score inferred using pySCENIC and by calculating the average expression. |
| Page: 1 |
Top |
Somatic mutation of malignant transformation related genes |
| Annotation of somatic variants for genes involved in malignant transformation |
| Hugo Symbol | Variant Class | Variant Classification | dbSNP RS | HGVSc | HGVSp | HGVSp Short | SWISSPROT | BIOTYPE | SIFT | PolyPhen | Tumor Sample Barcode | Tissue | Histology | Sex | Age | Stage | Therapy Types | Drugs | Outcome |
| CNOT3 | SNV | Missense_Mutation | c.853N>C | p.Asp285His | p.D285H | O75175 | protein_coding | deleterious(0.02) | probably_damaging(0.995) | TCGA-A7-A13F-01 | Breast | breast invasive carcinoma | Female | <65 | III/IV | Chemotherapy | doxorubicin | SD | |
| CNOT3 | SNV | Missense_Mutation | rs745641513 | c.1699N>A | p.Glu567Lys | p.E567K | O75175 | protein_coding | tolerated(0.13) | benign(0.105) | TCGA-AC-A2QI-01 | Breast | breast invasive carcinoma | Female | >=65 | III/IV | Chemotherapy | cytoxan | CR |
| CNOT3 | SNV | Missense_Mutation | c.645N>T | p.Gln215His | p.Q215H | O75175 | protein_coding | deleterious(0) | probably_damaging(0.995) | TCGA-AN-A0AK-01 | Breast | breast invasive carcinoma | Female | >=65 | I/II | Unknown | Unknown | SD | |
| CNOT3 | SNV | Missense_Mutation | c.1711N>G | p.Ile571Val | p.I571V | O75175 | protein_coding | tolerated(0.67) | benign(0) | TCGA-BH-A18G-01 | Breast | breast invasive carcinoma | Female | >=65 | I/II | Unknown | Unknown | SD | |
| CNOT3 | SNV | Missense_Mutation | c.124N>A | p.Glu42Lys | p.E42K | O75175 | protein_coding | deleterious(0) | probably_damaging(0.992) | TCGA-BH-A18L-01 | Breast | breast invasive carcinoma | Female | <65 | III/IV | Unknown | Unknown | SD | |
| CNOT3 | SNV | Missense_Mutation | c.2208N>T | p.Lys736Asn | p.K736N | O75175 | protein_coding | deleterious(0) | benign(0.23) | TCGA-BH-A1F8-01 | Breast | breast invasive carcinoma | Female | >=65 | III/IV | Unknown | Unknown | PD | |
| CNOT3 | SNV | Missense_Mutation | c.88C>G | p.Gln30Glu | p.Q30E | O75175 | protein_coding | tolerated(0.21) | benign(0.253) | TCGA-E9-A1NE-01 | Breast | breast invasive carcinoma | Female | <65 | I/II | Chemotherapy | doxorubicin | CR | |
| CNOT3 | insertion | Frame_Shift_Ins | rs753475896 | c.732dupC | p.Ser245GlnfsTer8 | p.S245Qfs*8 | O75175 | protein_coding | TCGA-AN-A0FY-01 | Breast | breast invasive carcinoma | Female | <65 | I/II | Unknown | Unknown | SD | ||
| CNOT3 | insertion | Frame_Shift_Ins | novel | c.1670_1671insCTTTGAGCAGCAGTGGGGGCAACAATGCCAGCAGCCAGGCCTT | p.Glu557AspfsTer88 | p.E557Dfs*88 | O75175 | protein_coding | TCGA-AR-A0TY-01 | Breast | breast invasive carcinoma | Female | <65 | I/II | Unspecific | Paclitaxel | PD | ||
| CNOT3 | insertion | Frame_Shift_Ins | rs753475896 | c.732dupC | p.Ser245GlnfsTer8 | p.S245Qfs*8 | O75175 | protein_coding | TCGA-BH-A0BR-01 | Breast | breast invasive carcinoma | Female | <65 | I/II | Unknown | Unknown | SD |
| Page: 1 2 3 4 5 6 7 8 9 10 11 |
Top |
Related drugs of malignant transformation related genes |
| Identification of chemicals and drugs interact with genes involved in malignant transfromation |
| (DGIdb 4.0) |
| Entrez ID | Symbol | Category | Interaction Types | Drug Claim Name | Drug Name | PMIDs |
| Page: 1 |

Copyright 2023-Present -The University of Texas Health Science Center at Houston |