
|
|||||
|
 | |
| |
| |
| |
| |
| |
|
Gene: CNOT10 |
Gene summary for CNOT10 |
| Gene information | Species | Human | Gene symbol | CNOT10 | Gene ID | 25904 |
| Gene name | CCR4-NOT transcription complex subunit 10 | |
| Gene Alias | CNOT10 | |
| Cytomap | 3p22.3 | |
| Gene Type | protein-coding | GO ID | GO:0006139 | UniProtAcc | Q9H9A5 |
Top |
Malignant transformation analysis |
| Identification of the aberrant gene expression in precancerous and cancerous lesions by comparing the gene expression of stem-like cells in diseased tissues with normal stem cells |
| Entrez ID | Symbol | Replicates | Species | Organ | Tissue | Adj P-value | Log2FC | Malignancy |
| 25904 | CNOT10 | LZE4T | Human | Esophagus | ESCC | 1.56e-08 | 2.85e-01 | 0.0811 |
| 25904 | CNOT10 | LZE7T | Human | Esophagus | ESCC | 1.37e-02 | 1.81e-01 | 0.0667 |
| 25904 | CNOT10 | LZE24T | Human | Esophagus | ESCC | 1.09e-04 | 1.80e-01 | 0.0596 |
| 25904 | CNOT10 | P1T-E | Human | Esophagus | ESCC | 1.70e-05 | 2.45e-01 | 0.0875 |
| 25904 | CNOT10 | P2T-E | Human | Esophagus | ESCC | 5.70e-16 | 1.83e-01 | 0.1177 |
| 25904 | CNOT10 | P4T-E | Human | Esophagus | ESCC | 6.67e-10 | 2.53e-01 | 0.1323 |
| 25904 | CNOT10 | P5T-E | Human | Esophagus | ESCC | 2.60e-04 | 8.74e-02 | 0.1327 |
| 25904 | CNOT10 | P8T-E | Human | Esophagus | ESCC | 1.03e-06 | 1.36e-01 | 0.0889 |
| 25904 | CNOT10 | P9T-E | Human | Esophagus | ESCC | 2.31e-04 | 1.76e-01 | 0.1131 |
| 25904 | CNOT10 | P10T-E | Human | Esophagus | ESCC | 2.61e-14 | 1.87e-01 | 0.116 |
| 25904 | CNOT10 | P11T-E | Human | Esophagus | ESCC | 1.11e-03 | 1.75e-01 | 0.1426 |
| 25904 | CNOT10 | P15T-E | Human | Esophagus | ESCC | 3.58e-11 | 2.41e-01 | 0.1149 |
| 25904 | CNOT10 | P16T-E | Human | Esophagus | ESCC | 2.86e-09 | 1.88e-01 | 0.1153 |
| 25904 | CNOT10 | P17T-E | Human | Esophagus | ESCC | 4.43e-04 | 1.58e-01 | 0.1278 |
| 25904 | CNOT10 | P19T-E | Human | Esophagus | ESCC | 1.60e-07 | 4.02e-01 | 0.1662 |
| 25904 | CNOT10 | P20T-E | Human | Esophagus | ESCC | 4.00e-08 | 1.39e-01 | 0.1124 |
| 25904 | CNOT10 | P21T-E | Human | Esophagus | ESCC | 2.61e-16 | 2.21e-01 | 0.1617 |
| 25904 | CNOT10 | P22T-E | Human | Esophagus | ESCC | 1.90e-11 | 1.24e-01 | 0.1236 |
| 25904 | CNOT10 | P23T-E | Human | Esophagus | ESCC | 1.62e-09 | 2.64e-01 | 0.108 |
| 25904 | CNOT10 | P24T-E | Human | Esophagus | ESCC | 6.21e-13 | 3.28e-01 | 0.1287 |
| Page: 1 2 3 4 |
| Tissue | Expression Dynamics | Abbreviation |
| Esophagus | 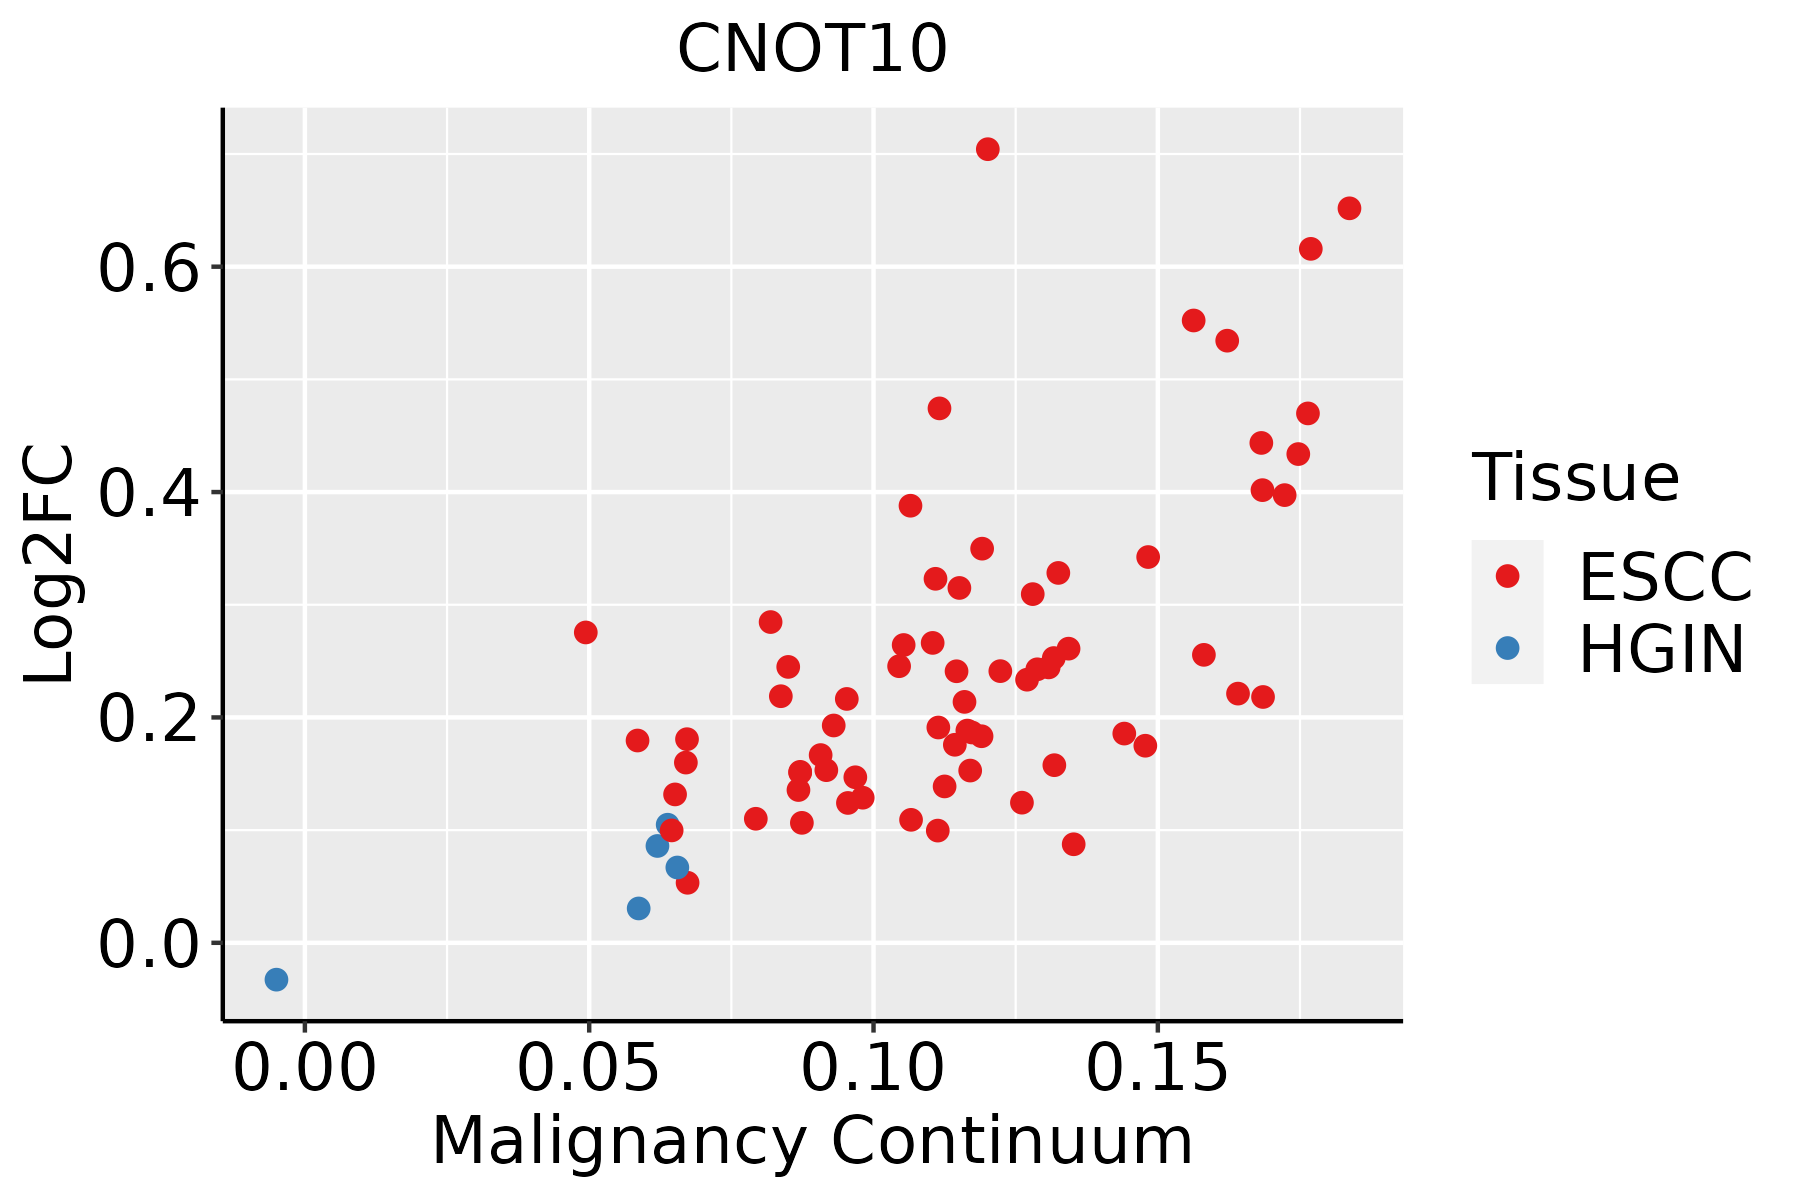 | ESCC: Esophageal squamous cell carcinoma |
| HGIN: High-grade intraepithelial neoplasias | ||
| LGIN: Low-grade intraepithelial neoplasias | ||
| Liver | 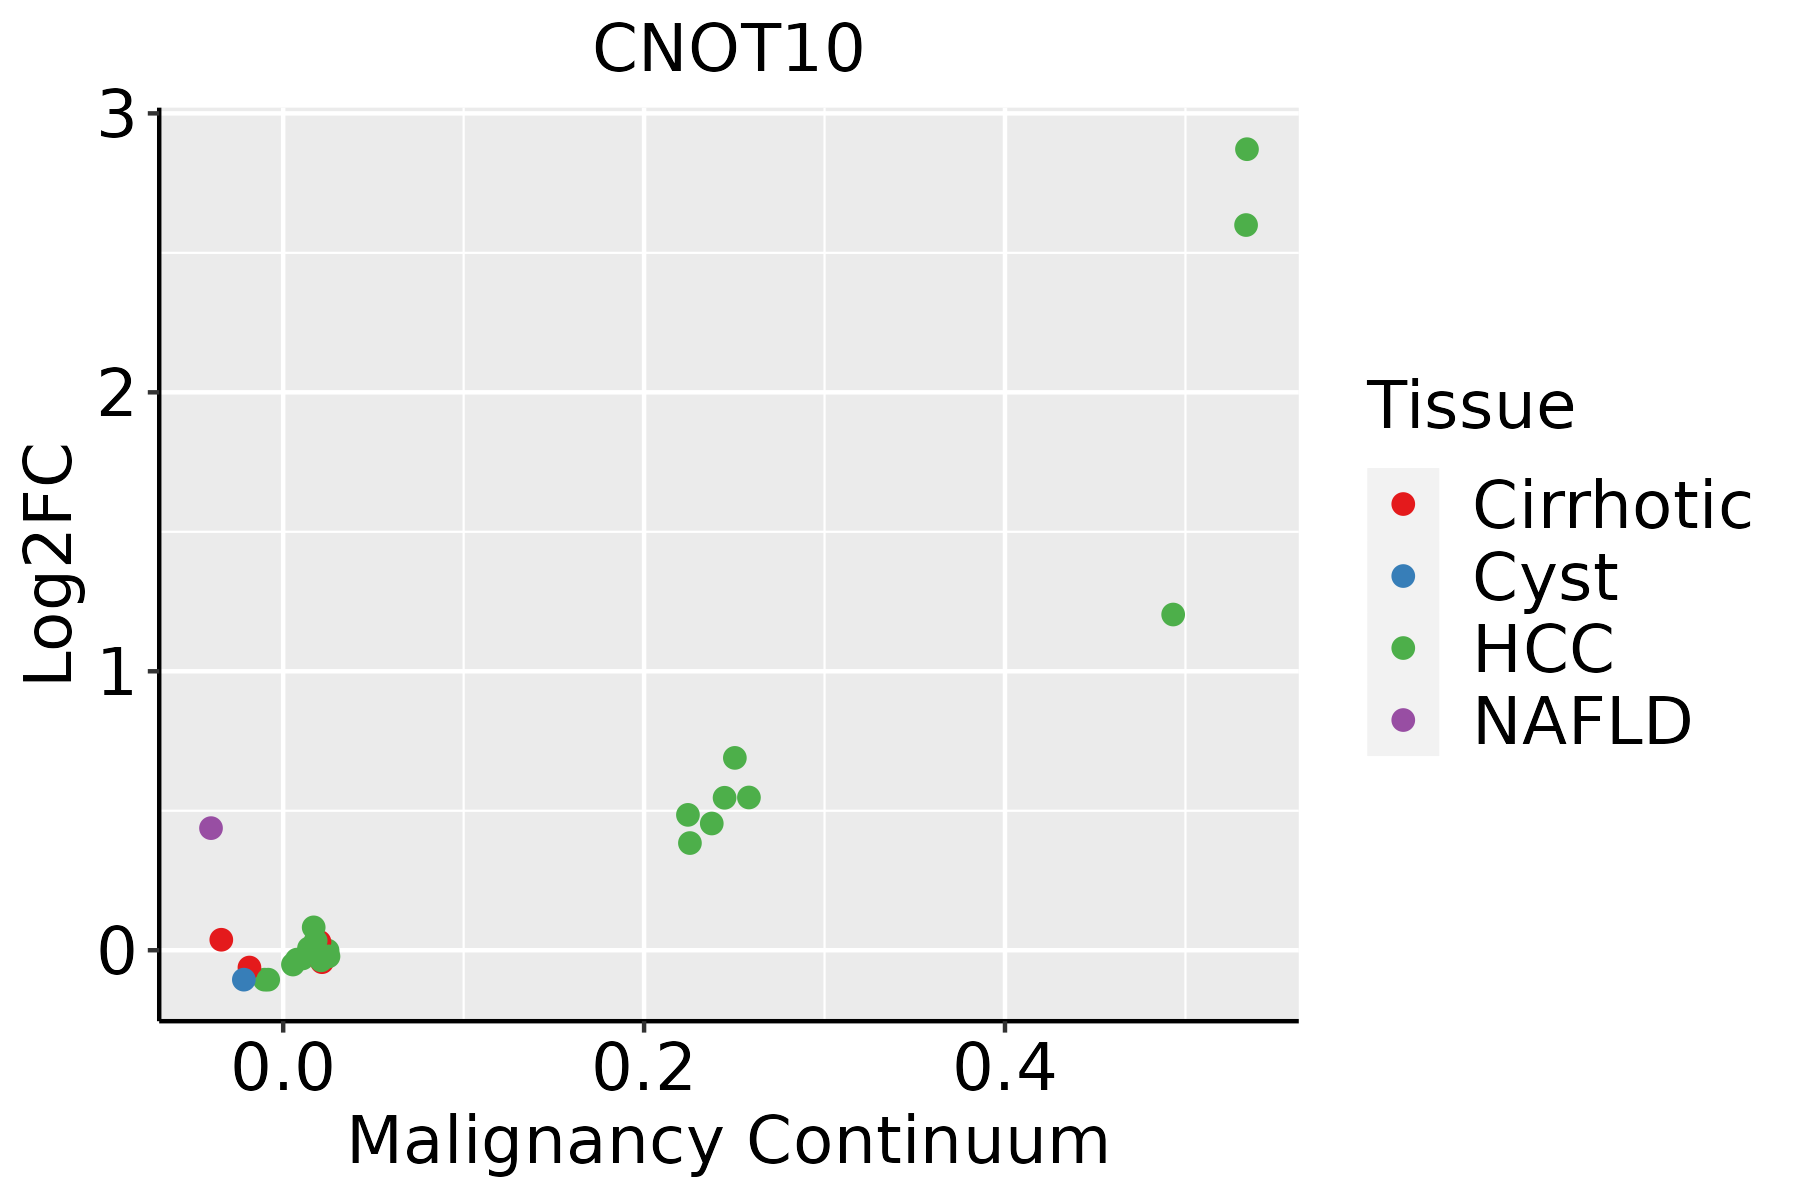 | HCC: Hepatocellular carcinoma |
| NAFLD: Non-alcoholic fatty liver disease |
| ∗log2FC in expression of this searched gene in stem-like cells from each diseased tissue sample relative to stem-like cells in normal samples in each tissue plotted against the malignancy continuum. Samples are colored based on if they are from different disease stage. |
Top |
Malignant transformation related pathway analysis |
| Find out the enriched GO biological processes and KEGG pathways involved in transition from healthy to precancer to cancer |
| Tissue | Disease Stage | Enriched GO biological Processes |
| Colorectum | AD |  |
| Colorectum | SER |  |
| Colorectum | MSS |  |
| Colorectum | MSI-H |  |
| Colorectum | FAP |  |
| ∗Top 15 enriched GO BP terms are showed in the bar plot of each disease state in each tissue. Each row represents a significant GO biological process which is colored according to the -log10(p.adjust). |
| Page: 1 2 3 4 5 6 7 8 9 |
| GO ID | Tissue | Disease Stage | Description | Gene Ratio | Bg Ratio | pvalue | p.adjust | Count |
| GO:0006401110 | Esophagus | ESCC | RNA catabolic process | 204/8552 | 278/18723 | 3.39e-21 | 5.66e-19 | 204 |
| GO:0034655110 | Esophagus | ESCC | nucleobase-containing compound catabolic process | 272/8552 | 407/18723 | 2.92e-18 | 2.90e-16 | 272 |
| GO:0006402110 | Esophagus | ESCC | mRNA catabolic process | 170/8552 | 232/18723 | 8.70e-18 | 8.00e-16 | 170 |
| GO:0006417111 | Esophagus | ESCC | regulation of translation | 304/8552 | 468/18723 | 1.53e-17 | 1.33e-15 | 304 |
| GO:004670018 | Esophagus | ESCC | heterocycle catabolic process | 286/8552 | 445/18723 | 1.12e-15 | 7.47e-14 | 286 |
| GO:004427019 | Esophagus | ESCC | cellular nitrogen compound catabolic process | 288/8552 | 451/18723 | 3.03e-15 | 1.79e-13 | 288 |
| GO:001943918 | Esophagus | ESCC | aromatic compound catabolic process | 295/8552 | 467/18723 | 1.09e-14 | 5.98e-13 | 295 |
| GO:190136118 | Esophagus | ESCC | organic cyclic compound catabolic process | 307/8552 | 495/18723 | 9.99e-14 | 4.80e-12 | 307 |
| GO:003424914 | Esophagus | ESCC | negative regulation of cellular amide metabolic process | 144/8552 | 273/18723 | 1.08e-02 | 3.67e-02 | 144 |
| GO:00194396 | Liver | NAFLD | aromatic compound catabolic process | 102/1882 | 467/18723 | 2.29e-14 | 1.91e-11 | 102 |
| GO:19013616 | Liver | NAFLD | organic cyclic compound catabolic process | 105/1882 | 495/18723 | 7.04e-14 | 5.15e-11 | 105 |
| GO:00442707 | Liver | NAFLD | cellular nitrogen compound catabolic process | 93/1882 | 451/18723 | 1.04e-11 | 4.34e-09 | 93 |
| GO:00467006 | Liver | NAFLD | heterocycle catabolic process | 92/1882 | 445/18723 | 1.16e-11 | 4.52e-09 | 92 |
| GO:00064026 | Liver | NAFLD | mRNA catabolic process | 56/1882 | 232/18723 | 3.49e-10 | 9.27e-08 | 56 |
| GO:00346556 | Liver | NAFLD | nucleobase-containing compound catabolic process | 80/1882 | 407/18723 | 3.07e-09 | 4.61e-07 | 80 |
| GO:00064016 | Liver | NAFLD | RNA catabolic process | 61/1882 | 278/18723 | 3.26e-09 | 4.76e-07 | 61 |
| GO:00064177 | Liver | NAFLD | regulation of translation | 85/1882 | 468/18723 | 4.58e-08 | 4.54e-06 | 85 |
| GO:00171483 | Liver | NAFLD | negative regulation of translation | 43/1882 | 245/18723 | 2.05e-04 | 3.56e-03 | 43 |
| GO:00342493 | Liver | NAFLD | negative regulation of cellular amide metabolic process | 46/1882 | 273/18723 | 3.27e-04 | 5.04e-03 | 46 |
| GO:004427021 | Liver | HCC | cellular nitrogen compound catabolic process | 303/7958 | 451/18723 | 9.76e-27 | 3.64e-24 | 303 |
| Page: 1 2 |
| Pathway ID | Tissue | Disease Stage | Description | Gene Ratio | Bg Ratio | pvalue | p.adjust | qvalue | Count |
| hsa0301824 | Esophagus | ESCC | RNA degradation | 62/4205 | 79/8465 | 1.18e-07 | 9.39e-07 | 4.81e-07 | 62 |
| hsa0301834 | Esophagus | ESCC | RNA degradation | 62/4205 | 79/8465 | 1.18e-07 | 9.39e-07 | 4.81e-07 | 62 |
| hsa030182 | Liver | HCC | RNA degradation | 58/4020 | 79/8465 | 2.29e-06 | 2.19e-05 | 1.22e-05 | 58 |
| hsa030183 | Liver | HCC | RNA degradation | 58/4020 | 79/8465 | 2.29e-06 | 2.19e-05 | 1.22e-05 | 58 |
| Page: 1 |
Top |
Cell-cell communication analysis |
| Identification of potential cell-cell interactions between two cell types and their ligand-receptor pairs for different disease states |
| Ligand | Receptor | LRpair | Pathway | Tissue | Disease Stage |
| Page: 1 |
Top |
Single-cell gene regulatory network inference analysis |
| Find out the significant the regulons (TFs) and the target genes of each regulon across cell types for different disease states |
| TF | Cell Type | Tissue | Disease Stage | Target Gene | RSS | Regulon Activity |
| ∗The dot plots of a searched regulon are shown for all cell subpopulations in each disease state of each tissue based on the regulon specific score inferred using pySCENIC and by calculating the average expression. |
| Page: 1 |
Top |
Somatic mutation of malignant transformation related genes |
| Annotation of somatic variants for genes involved in malignant transformation |
| Hugo Symbol | Variant Class | Variant Classification | dbSNP RS | HGVSc | HGVSp | HGVSp Short | SWISSPROT | BIOTYPE | SIFT | PolyPhen | Tumor Sample Barcode | Tissue | Histology | Sex | Age | Stage | Therapy Types | Drugs | Outcome |
| CNOT10 | SNV | Missense_Mutation | c.1336N>G | p.His446Asp | p.H446D | Q9H9A5 | protein_coding | deleterious(0.03) | possibly_damaging(0.84) | TCGA-AC-A23H-01 | Breast | breast invasive carcinoma | Female | >=65 | I/II | Unknown | Unknown | PD | |
| CNOT10 | SNV | Missense_Mutation | novel | c.1771N>G | p.Leu591Val | p.L591V | Q9H9A5 | protein_coding | deleterious(0) | probably_damaging(0.986) | TCGA-AN-A046-01 | Breast | breast invasive carcinoma | Female | >=65 | I/II | Unknown | Unknown | SD |
| CNOT10 | SNV | Missense_Mutation | c.1141C>G | p.Gln381Glu | p.Q381E | Q9H9A5 | protein_coding | tolerated(0.13) | benign(0.009) | TCGA-C8-A26Y-01 | Breast | breast invasive carcinoma | Female | >=65 | I/II | Unknown | Unknown | SD | |
| CNOT10 | insertion | Frame_Shift_Ins | novel | c.641dupT | p.Leu214PhefsTer13 | p.L214Ffs*13 | Q9H9A5 | protein_coding | TCGA-AR-A1AH-01 | Breast | breast invasive carcinoma | Female | <65 | I/II | Unspecific | PD | |||
| CNOT10 | SNV | Missense_Mutation | novel | c.56G>A | p.Arg19His | p.R19H | Q9H9A5 | protein_coding | tolerated_low_confidence(0.63) | benign(0) | TCGA-2W-A8YY-01 | Cervix | cervical & endocervical cancer | Female | <65 | I/II | Chemotherapy | cisplatin | CR |
| CNOT10 | SNV | Missense_Mutation | c.1612N>C | p.Asp538His | p.D538H | Q9H9A5 | protein_coding | deleterious(0) | possibly_damaging(0.873) | TCGA-DR-A0ZM-01 | Cervix | cervical & endocervical cancer | Female | <65 | III/IV | Unspecific | Cisplatin | SD | |
| CNOT10 | SNV | Missense_Mutation | novel | c.697N>T | p.Ala233Ser | p.A233S | Q9H9A5 | protein_coding | tolerated(0.67) | benign(0.013) | TCGA-EA-A97N-01 | Cervix | cervical & endocervical cancer | Female | <65 | I/II | Unknown | Unknown | SD |
| CNOT10 | SNV | Missense_Mutation | c.1856N>G | p.Leu619Arg | p.L619R | Q9H9A5 | protein_coding | deleterious(0) | probably_damaging(0.997) | TCGA-FU-A3HZ-01 | Cervix | cervical & endocervical cancer | Female | <65 | I/II | Chemotherapy | cisplatin | CR | |
| CNOT10 | SNV | Missense_Mutation | c.949A>C | p.Ser317Arg | p.S317R | Q9H9A5 | protein_coding | deleterious(0.01) | benign(0.387) | TCGA-AA-A010-01 | Colorectum | colon adenocarcinoma | Female | <65 | I/II | Chemotherapy | folinic | CR | |
| CNOT10 | SNV | Missense_Mutation | c.2312N>G | p.Ala771Gly | p.A771G | Q9H9A5 | protein_coding | tolerated(0.38) | benign(0.023) | TCGA-AA-A01R-01 | Colorectum | colon adenocarcinoma | Male | <65 | III/IV | Chemotherapy | 5-fluorouracil | PD |
| Page: 1 2 3 4 5 6 7 |
Top |
Related drugs of malignant transformation related genes |
| Identification of chemicals and drugs interact with genes involved in malignant transfromation |
| (DGIdb 4.0) |
| Entrez ID | Symbol | Category | Interaction Types | Drug Claim Name | Drug Name | PMIDs |
| Page: 1 |

Copyright 2023-Present -The University of Texas Health Science Center at Houston |