
|
|||||
|
 | |
| |
| |
| |
| |
| |
|
Gene: CNNM1 |
Gene summary for CNNM1 |
| Gene information | Species | Human | Gene symbol | CNNM1 | Gene ID | 26507 |
| Gene name | cyclin and CBS domain divalent metal cation transport mediator 1 | |
| Gene Alias | ACDP1 | |
| Cytomap | 10q24.2 | |
| Gene Type | protein-coding | GO ID | GO:0006810 | UniProtAcc | B4DKF7 |
Top |
Malignant transformation analysis |
| Identification of the aberrant gene expression in precancerous and cancerous lesions by comparing the gene expression of stem-like cells in diseased tissues with normal stem cells |
| Entrez ID | Symbol | Replicates | Species | Organ | Tissue | Adj P-value | Log2FC | Malignancy |
| 26507 | CNNM1 | HCC1 | Human | Liver | HCC | 2.22e-07 | 1.43e+00 | 0.5336 |
| 26507 | CNNM1 | HCC2 | Human | Liver | HCC | 3.48e-04 | 4.53e-01 | 0.5341 |
| 26507 | CNNM1 | HCC5 | Human | Liver | HCC | 3.22e-06 | 6.79e-01 | 0.4932 |
| Page: 1 |
| Tissue | Expression Dynamics | Abbreviation |
| Liver | 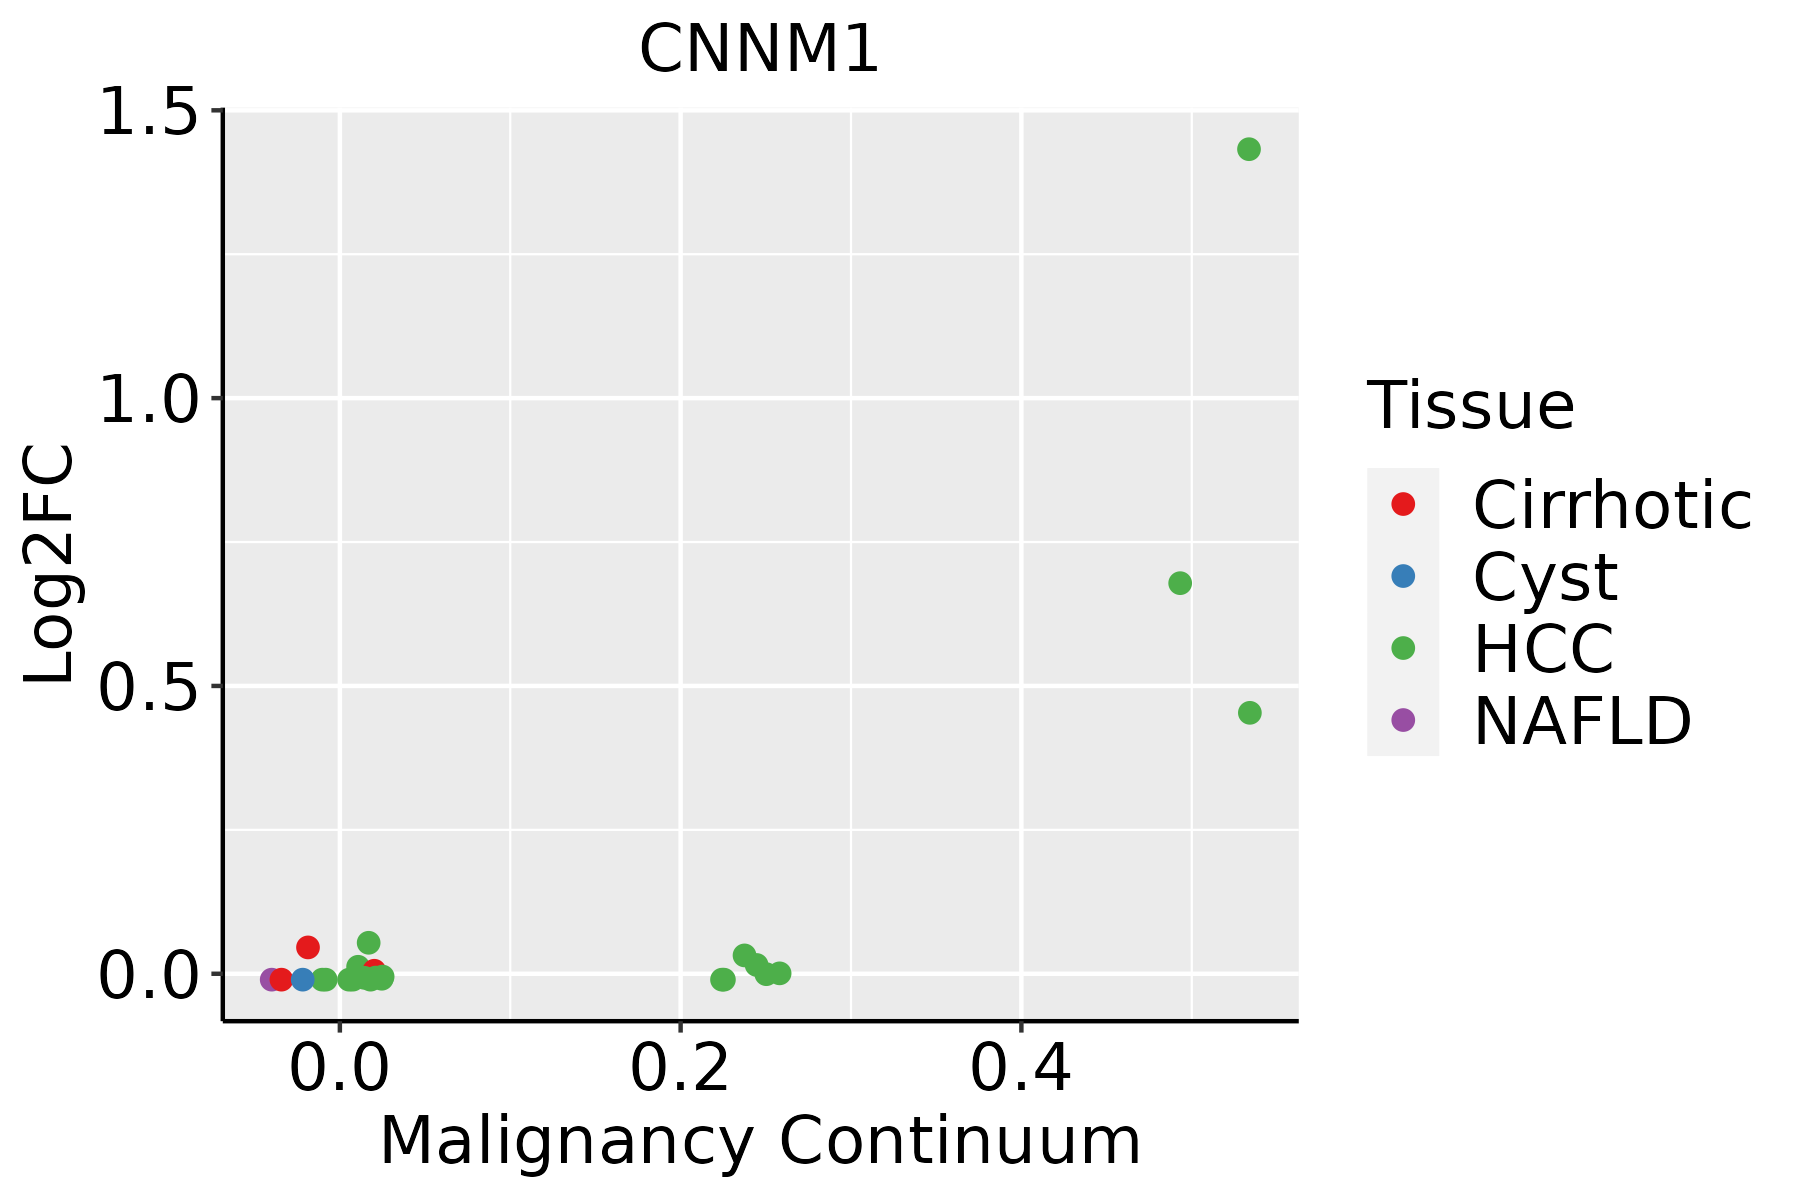 | HCC: Hepatocellular carcinoma |
| NAFLD: Non-alcoholic fatty liver disease |
| ∗log2FC in expression of this searched gene in stem-like cells from each diseased tissue sample relative to stem-like cells in normal samples in each tissue plotted against the malignancy continuum. Samples are colored based on if they are from different disease stage. |
Top |
Malignant transformation related pathway analysis |
| Find out the enriched GO biological processes and KEGG pathways involved in transition from healthy to precancer to cancer |
| Tissue | Disease Stage | Enriched GO biological Processes |
| Colorectum | AD |  |
| Colorectum | SER |  |
| Colorectum | MSS |  |
| Colorectum | MSI-H |  |
| Colorectum | FAP |  |
| ∗Top 15 enriched GO BP terms are showed in the bar plot of each disease state in each tissue. Each row represents a significant GO biological process which is colored according to the -log10(p.adjust). |
| Page: 1 2 3 4 5 6 7 8 9 |
| GO ID | Tissue | Disease Stage | Description | Gene Ratio | Bg Ratio | pvalue | p.adjust | Count |
| Page: 1 |
| Pathway ID | Tissue | Disease Stage | Description | Gene Ratio | Bg Ratio | pvalue | p.adjust | qvalue | Count |
| Page: 1 |
Top |
Cell-cell communication analysis |
| Identification of potential cell-cell interactions between two cell types and their ligand-receptor pairs for different disease states |
| Ligand | Receptor | LRpair | Pathway | Tissue | Disease Stage |
| Page: 1 |
Top |
Single-cell gene regulatory network inference analysis |
| Find out the significant the regulons (TFs) and the target genes of each regulon across cell types for different disease states |
| TF | Cell Type | Tissue | Disease Stage | Target Gene | RSS | Regulon Activity |
| ∗The dot plots of a searched regulon are shown for all cell subpopulations in each disease state of each tissue based on the regulon specific score inferred using pySCENIC and by calculating the average expression. |
| Page: 1 |
Top |
Somatic mutation of malignant transformation related genes |
| Annotation of somatic variants for genes involved in malignant transformation |
| Hugo Symbol | Variant Class | Variant Classification | dbSNP RS | HGVSc | HGVSp | HGVSp Short | SWISSPROT | BIOTYPE | SIFT | PolyPhen | Tumor Sample Barcode | Tissue | Histology | Sex | Age | Stage | Therapy Types | Drugs | Outcome |
| CNNM1 | SNV | Missense_Mutation | c.2047N>T | p.Val683Phe | p.V683F | Q9NRU3 | protein_coding | tolerated(0.07) | benign(0.017) | TCGA-A2-A0EX-01 | Breast | breast invasive carcinoma | Female | <65 | I/II | Hormone Therapy | tamoxiphen | SD | |
| CNNM1 | SNV | Missense_Mutation | c.2711C>G | p.Thr904Arg | p.T904R | Q9NRU3 | protein_coding | tolerated_low_confidence(0.24) | benign(0.057) | TCGA-A2-A0T4-01 | Breast | breast invasive carcinoma | Female | <65 | I/II | Hormone Therapy | femara | SD | |
| CNNM1 | SNV | Missense_Mutation | rs746769483 | c.2042N>G | p.Val681Gly | p.V681G | Q9NRU3 | protein_coding | deleterious(0) | probably_damaging(0.969) | TCGA-A7-A26F-01 | Breast | breast invasive carcinoma | Female | <65 | I/II | Chemotherapy | taxotere | SD |
| CNNM1 | insertion | Frame_Shift_Ins | novel | c.2008_2009insCATCTCCCTGTCTGTTAGACTTGCAGTGCCCTAGAGCAGTGCC | p.Tyr670SerfsTer23 | p.Y670Sfs*23 | Q9NRU3 | protein_coding | TCGA-BH-A0EE-01 | Breast | breast invasive carcinoma | Female | >=65 | I/II | Chemotherapy | docetaxel | SD | ||
| CNNM1 | SNV | Missense_Mutation | novel | c.2677T>C | p.Ser893Pro | p.S893P | Q9NRU3 | protein_coding | tolerated_low_confidence(0.15) | benign(0.161) | TCGA-C5-A8YT-01 | Cervix | cervical & endocervical cancer | Female | <65 | I/II | Chemotherapy | cisplatin | PD |
| CNNM1 | SNV | Missense_Mutation | c.79C>T | p.Leu27Phe | p.L27F | Q9NRU3 | protein_coding | tolerated_low_confidence(0.07) | probably_damaging(0.986) | TCGA-EA-A410-01 | Cervix | cervical & endocervical cancer | Female | <65 | I/II | Unknown | Unknown | SD | |
| CNNM1 | SNV | Missense_Mutation | c.190N>A | p.Ala64Thr | p.A64T | Q9NRU3 | protein_coding | deleterious(0.02) | possibly_damaging(0.602) | TCGA-A6-2686-01 | Colorectum | colon adenocarcinoma | Female | >=65 | I/II | Unknown | Unknown | SD | |
| CNNM1 | SNV | Missense_Mutation | c.1760N>C | p.Lys587Thr | p.K587T | Q9NRU3 | protein_coding | deleterious(0.02) | benign(0.024) | TCGA-AA-3684-01 | Colorectum | colon adenocarcinoma | Female | >=65 | III/IV | Unknown | Unknown | SD | |
| CNNM1 | SNV | Missense_Mutation | c.1336N>A | p.Ala446Thr | p.A446T | Q9NRU3 | protein_coding | tolerated(0.07) | benign(0.026) | TCGA-AA-3833-01 | Colorectum | colon adenocarcinoma | Female | <65 | I/II | Unknown | Unknown | SD | |
| CNNM1 | SNV | Missense_Mutation | c.1762N>T | p.Arg588Trp | p.R588W | Q9NRU3 | protein_coding | deleterious(0.01) | possibly_damaging(0.735) | TCGA-AA-3864-01 | Colorectum | colon adenocarcinoma | Male | >=65 | I/II | Unknown | Unknown | SD |
| Page: 1 2 3 4 5 6 7 8 9 10 11 |
Top |
Related drugs of malignant transformation related genes |
| Identification of chemicals and drugs interact with genes involved in malignant transfromation |
| (DGIdb 4.0) |
| Entrez ID | Symbol | Category | Interaction Types | Drug Claim Name | Drug Name | PMIDs |
| Page: 1 |

Copyright 2023-Present -The University of Texas Health Science Center at Houston |