
|
|||||
|
 | |
| |
| |
| |
| |
| |
|
Gene: CNN2 |
Gene summary for CNN2 |
| Gene information | Species | Human | Gene symbol | CNN2 | Gene ID | 1265 |
| Gene name | calponin 2 | |
| Gene Alias | CNN2 | |
| Cytomap | 19p13.3 | |
| Gene Type | protein-coding | GO ID | GO:0002376 | UniProtAcc | B4DDF4 |
Top |
Malignant transformation analysis |
| Identification of the aberrant gene expression in precancerous and cancerous lesions by comparing the gene expression of stem-like cells in diseased tissues with normal stem cells |
| Entrez ID | Symbol | Replicates | Species | Organ | Tissue | Adj P-value | Log2FC | Malignancy |
| 1265 | CNN2 | LZE4T | Human | Esophagus | ESCC | 7.05e-23 | 8.85e-01 | 0.0811 |
| 1265 | CNN2 | LZE5T | Human | Esophagus | ESCC | 2.94e-03 | 1.03e+00 | 0.0514 |
| 1265 | CNN2 | LZE7T | Human | Esophagus | ESCC | 1.13e-14 | 1.46e+00 | 0.0667 |
| 1265 | CNN2 | LZE8T | Human | Esophagus | ESCC | 8.42e-23 | 1.35e+00 | 0.067 |
| 1265 | CNN2 | LZE20T | Human | Esophagus | ESCC | 5.39e-13 | 8.25e-01 | 0.0662 |
| 1265 | CNN2 | LZE22T | Human | Esophagus | ESCC | 3.55e-07 | 1.16e+00 | 0.068 |
| 1265 | CNN2 | LZE24T | Human | Esophagus | ESCC | 2.79e-37 | 1.57e+00 | 0.0596 |
| 1265 | CNN2 | LZE21T | Human | Esophagus | ESCC | 4.38e-13 | 1.57e+00 | 0.0655 |
| 1265 | CNN2 | LZE6T | Human | Esophagus | ESCC | 1.04e-09 | 7.19e-01 | 0.0845 |
| 1265 | CNN2 | P1T-E | Human | Esophagus | ESCC | 1.22e-14 | 1.73e+00 | 0.0875 |
| 1265 | CNN2 | P2T-E | Human | Esophagus | ESCC | 7.54e-73 | 1.64e+00 | 0.1177 |
| 1265 | CNN2 | P4T-E | Human | Esophagus | ESCC | 3.70e-56 | 1.58e+00 | 0.1323 |
| 1265 | CNN2 | P5T-E | Human | Esophagus | ESCC | 6.44e-27 | 8.47e-01 | 0.1327 |
| 1265 | CNN2 | P8T-E | Human | Esophagus | ESCC | 6.38e-43 | 1.16e+00 | 0.0889 |
| 1265 | CNN2 | P9T-E | Human | Esophagus | ESCC | 4.97e-25 | 1.05e+00 | 0.1131 |
| 1265 | CNN2 | P10T-E | Human | Esophagus | ESCC | 6.72e-71 | 1.59e+00 | 0.116 |
| 1265 | CNN2 | P11T-E | Human | Esophagus | ESCC | 1.14e-23 | 1.65e+00 | 0.1426 |
| 1265 | CNN2 | P12T-E | Human | Esophagus | ESCC | 6.72e-57 | 1.47e+00 | 0.1122 |
| 1265 | CNN2 | P15T-E | Human | Esophagus | ESCC | 1.76e-51 | 1.91e+00 | 0.1149 |
| 1265 | CNN2 | P16T-E | Human | Esophagus | ESCC | 2.01e-88 | 2.43e+00 | 0.1153 |
| Page: 1 2 3 4 5 6 |
| Tissue | Expression Dynamics | Abbreviation |
| Esophagus |  | ESCC: Esophageal squamous cell carcinoma |
| HGIN: High-grade intraepithelial neoplasias | ||
| LGIN: Low-grade intraepithelial neoplasias | ||
| Liver | 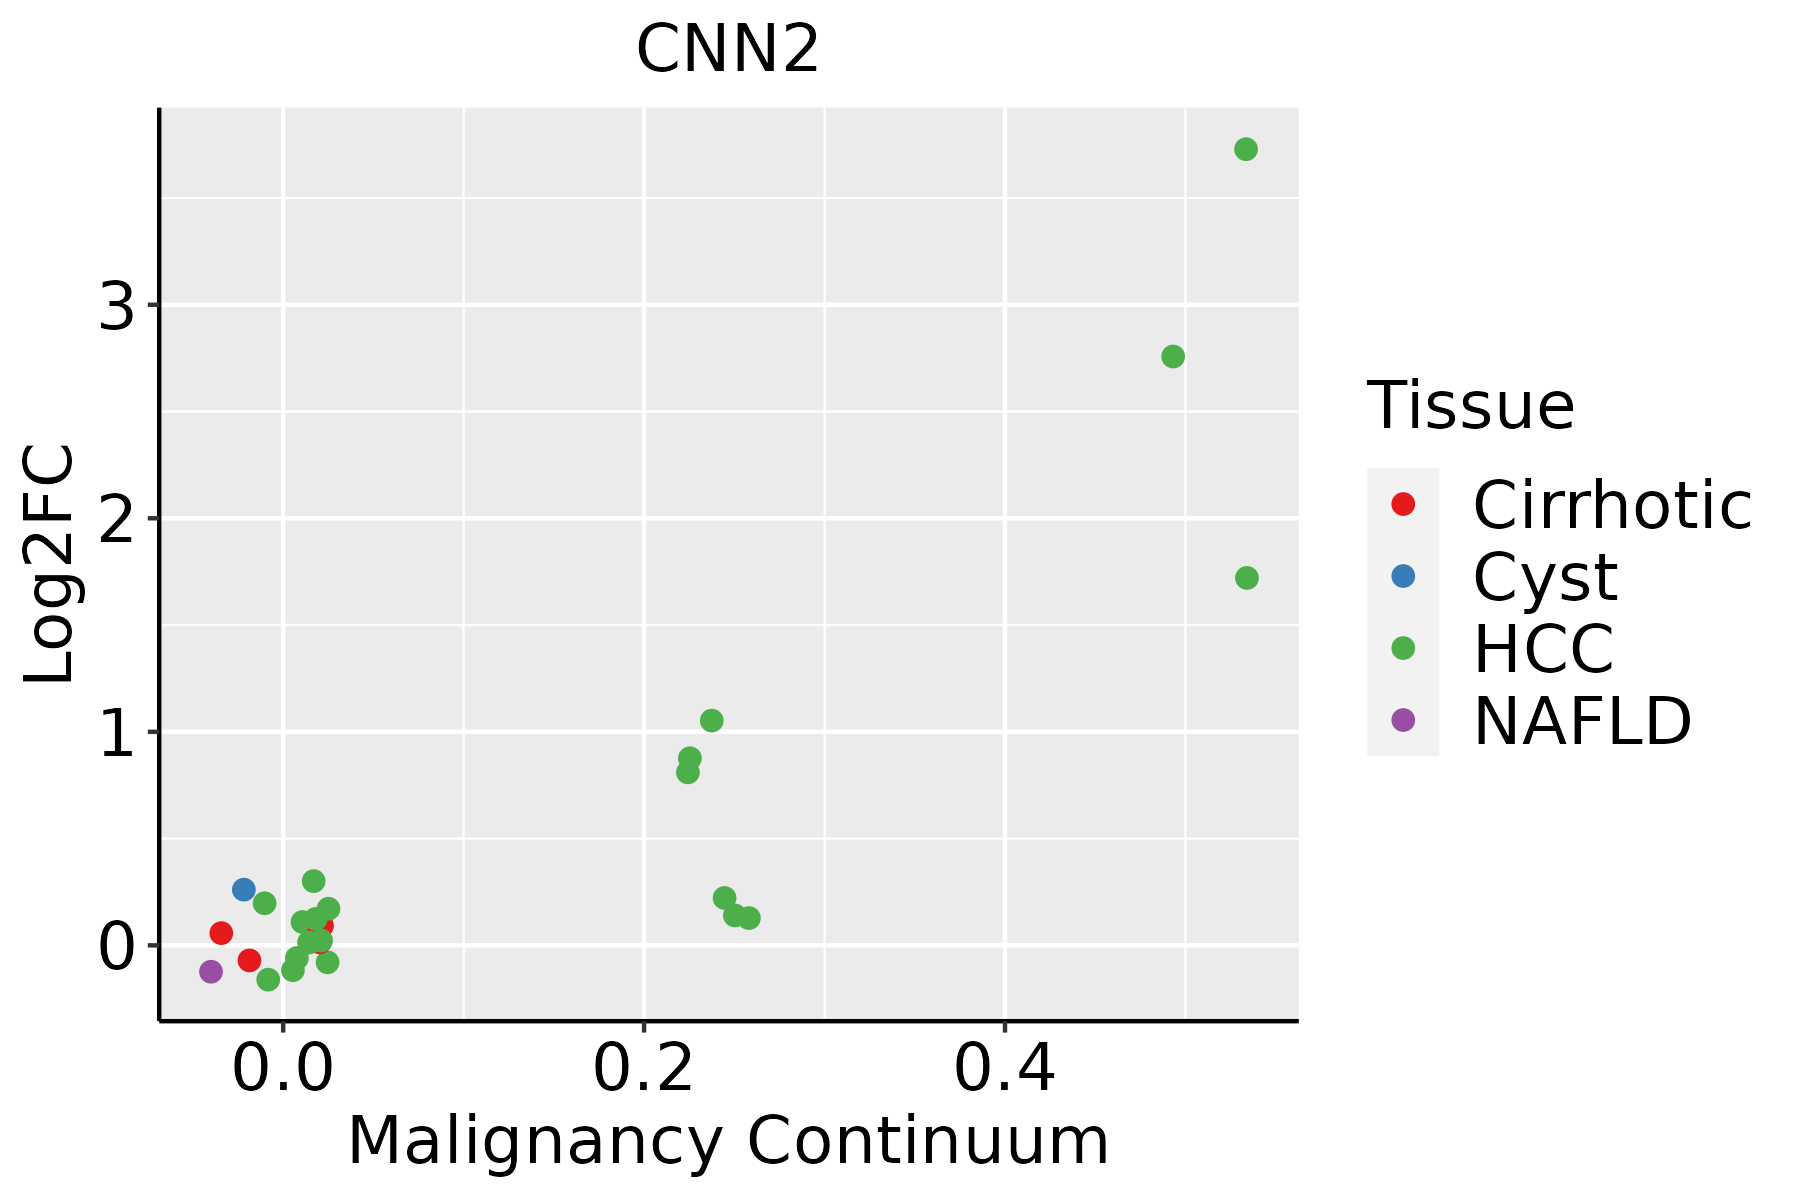 | HCC: Hepatocellular carcinoma |
| NAFLD: Non-alcoholic fatty liver disease | ||
| Oral Cavity | 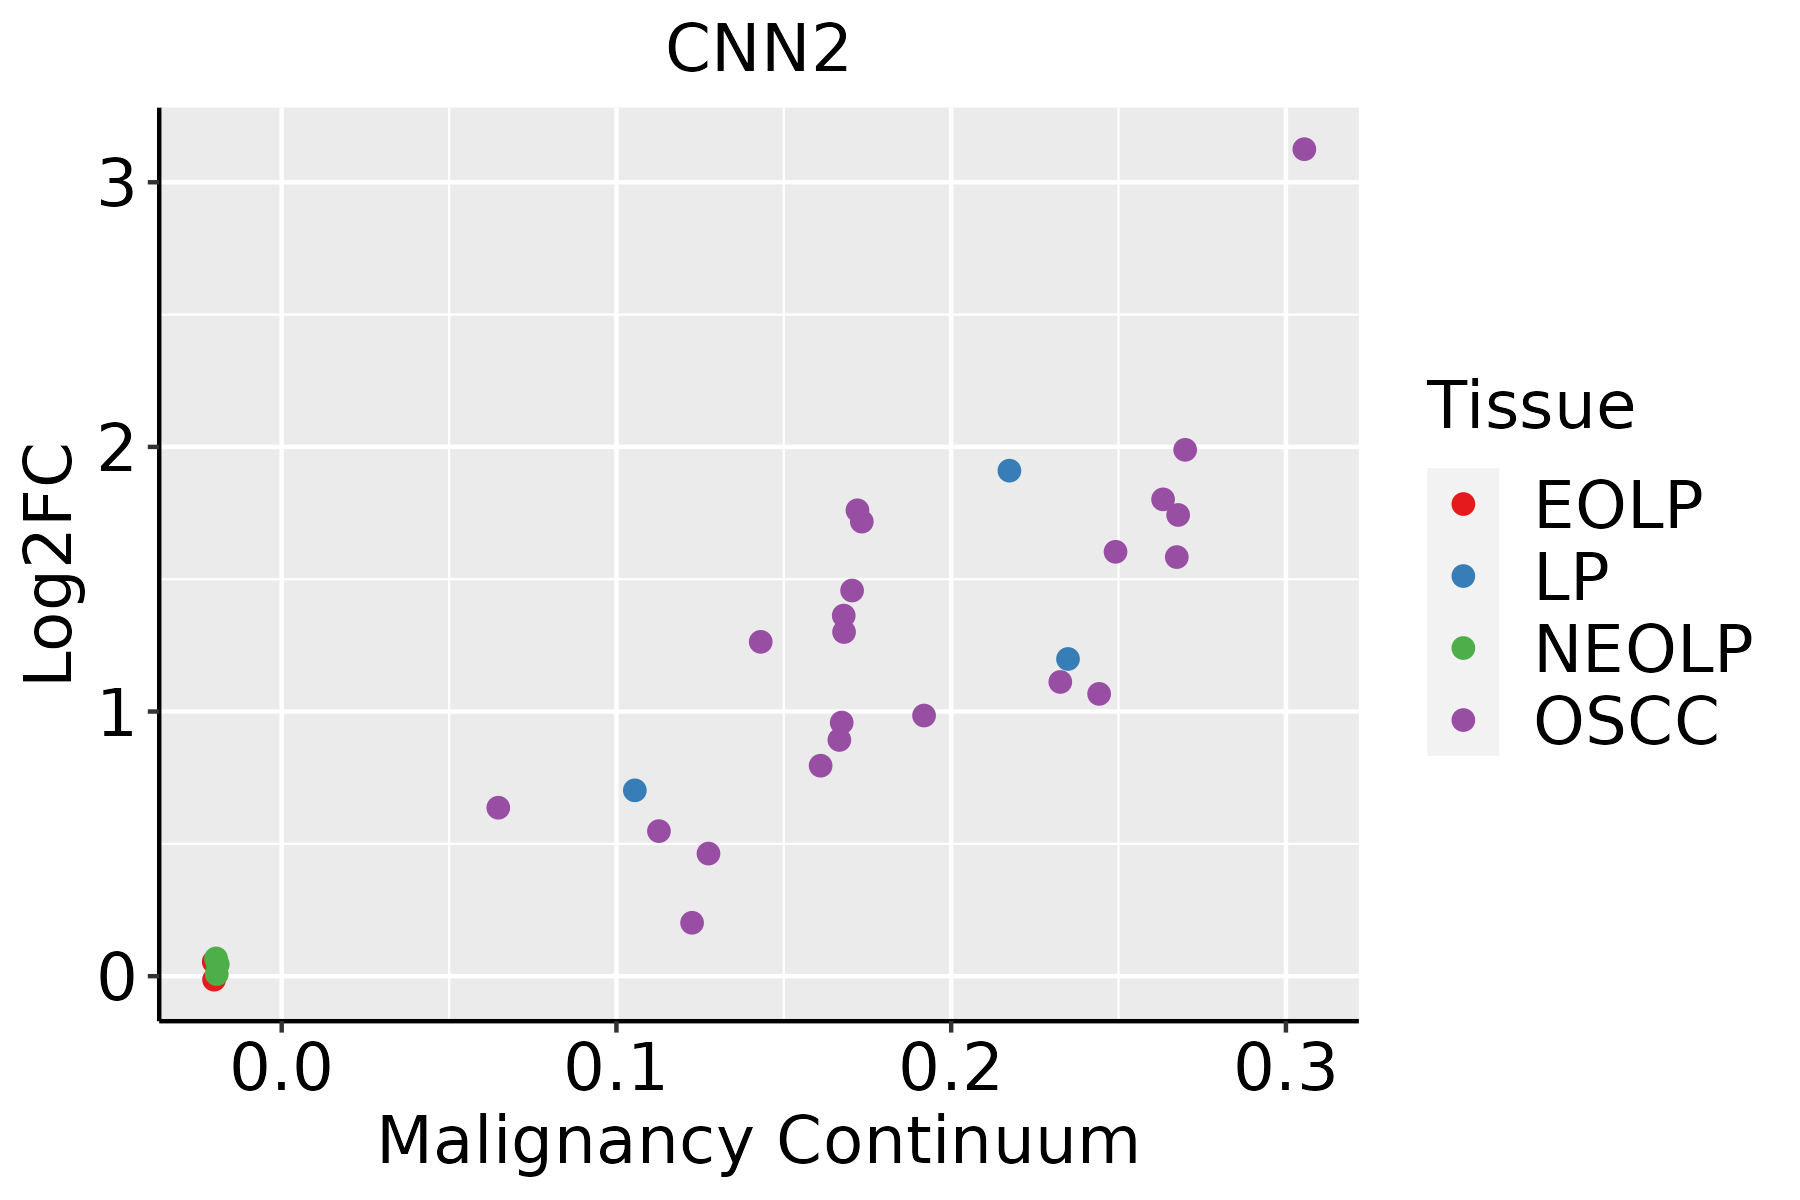 | EOLP: Erosive Oral lichen planus |
| LP: leukoplakia | ||
| NEOLP: Non-erosive oral lichen planus | ||
| OSCC: Oral squamous cell carcinoma | ||
| Skin | 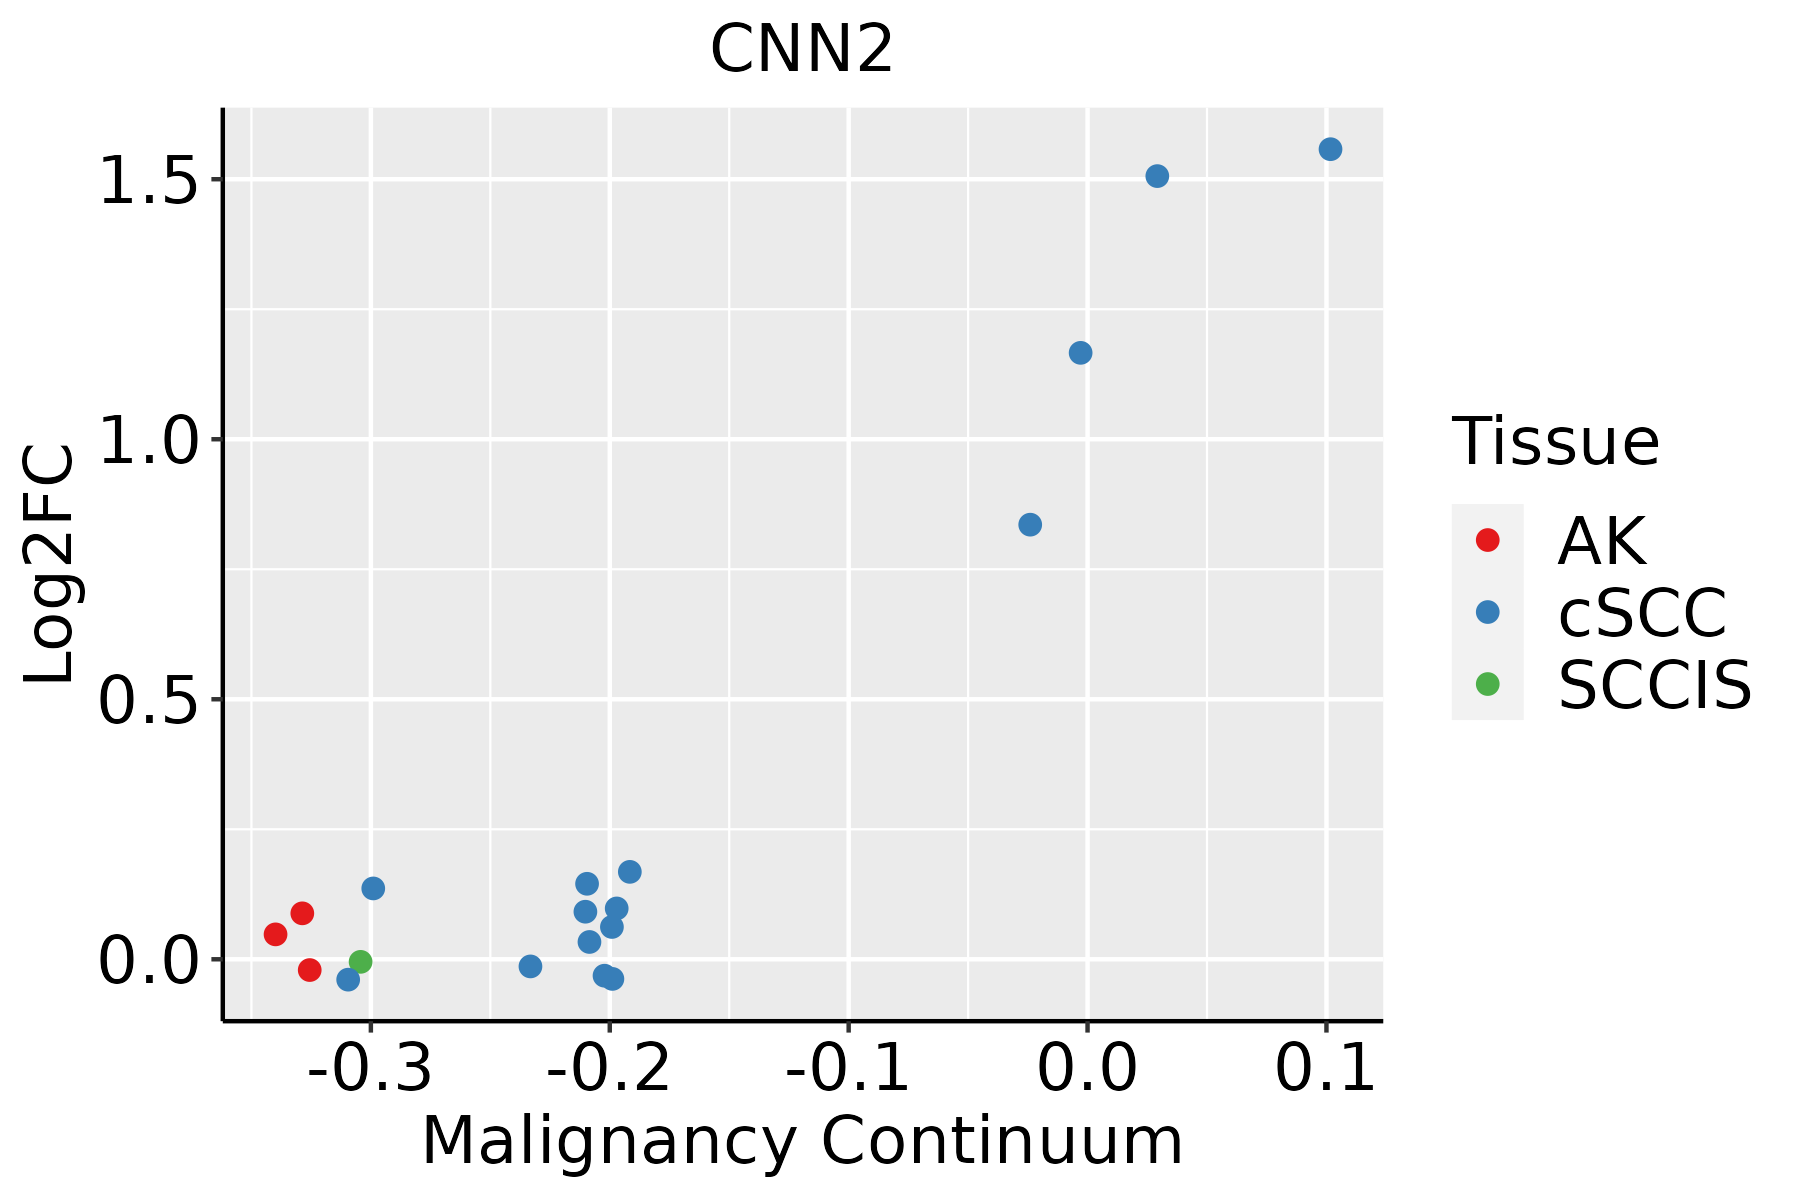 | AK: Actinic keratosis |
| cSCC: Cutaneous squamous cell carcinoma | ||
| SCCIS:squamous cell carcinoma in situ | ||
| Thyroid | 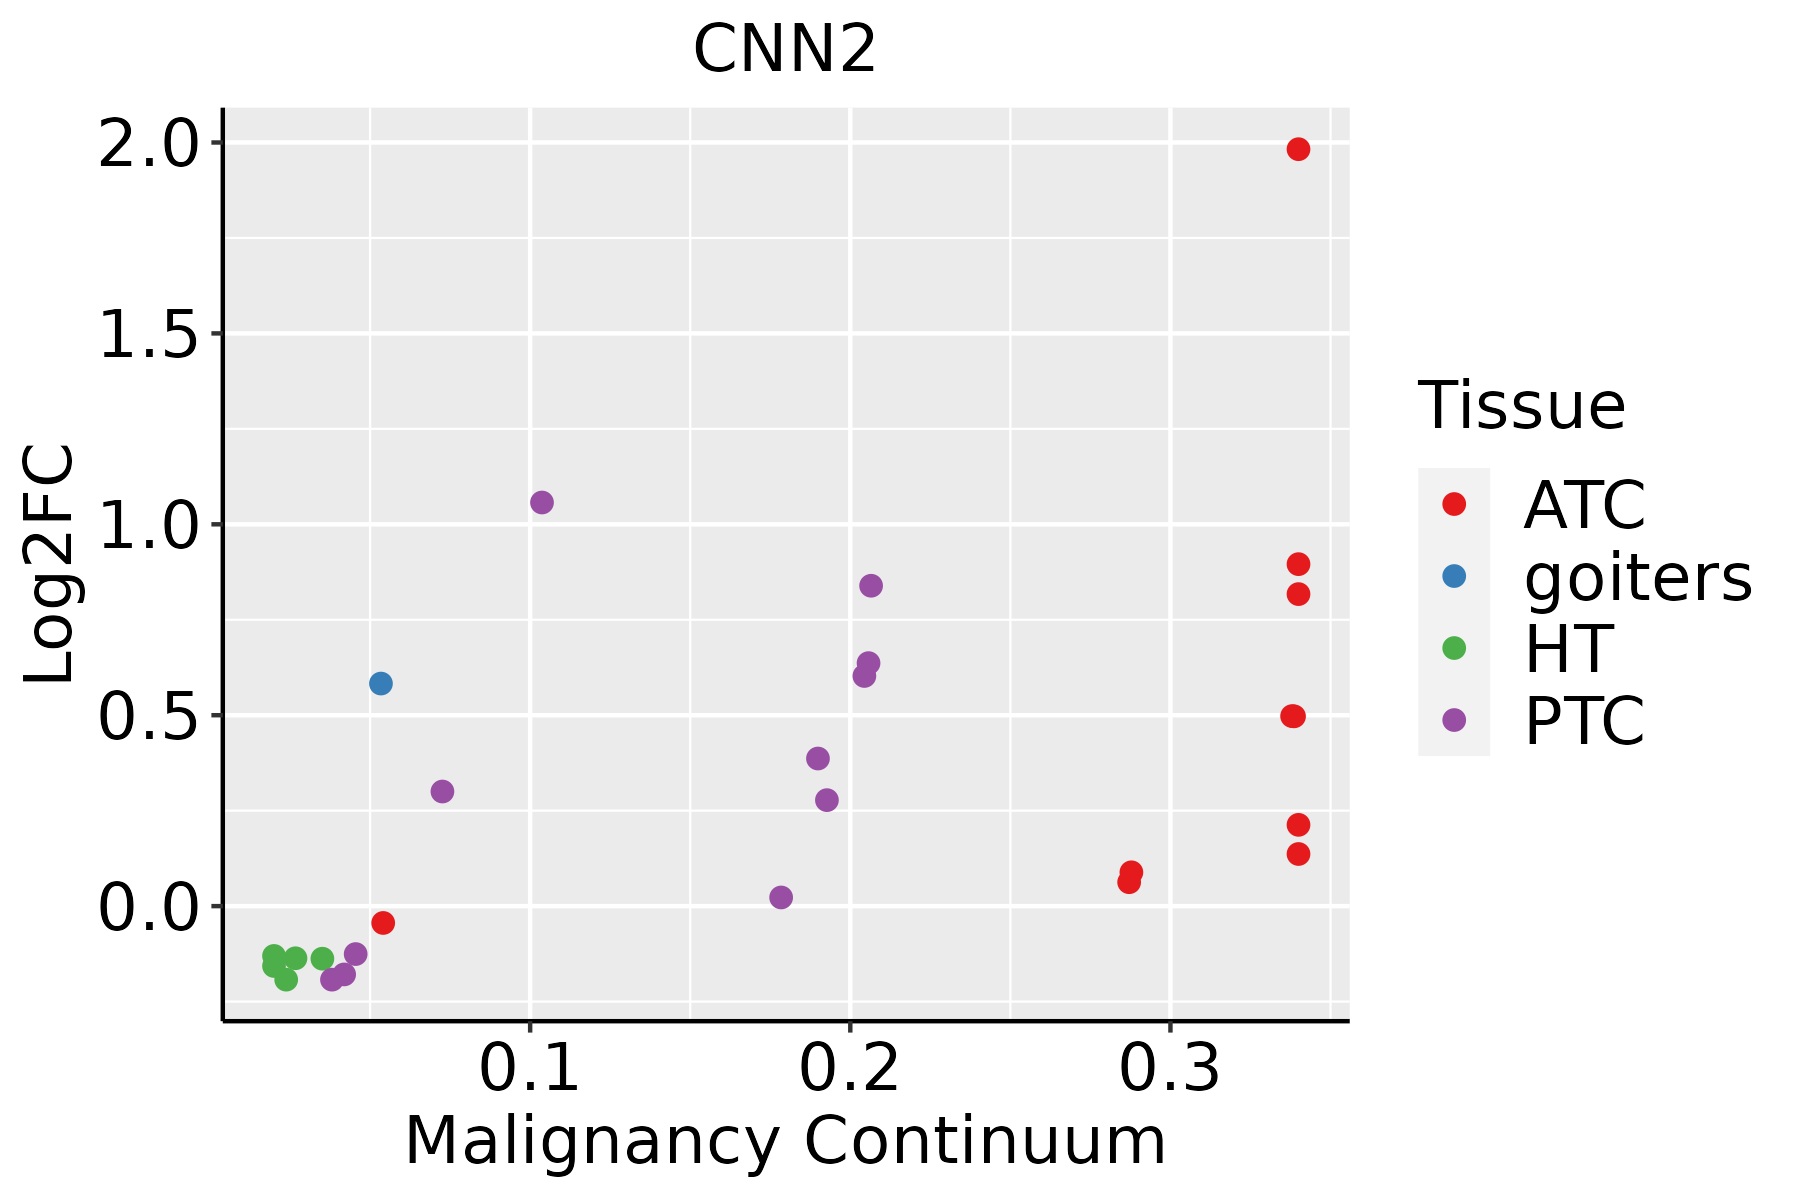 | ATC: Anaplastic thyroid cancer |
| HT: Hashimoto's thyroiditis | ||
| PTC: Papillary thyroid cancer |
| ∗log2FC in expression of this searched gene in stem-like cells from each diseased tissue sample relative to stem-like cells in normal samples in each tissue plotted against the malignancy continuum. Samples are colored based on if they are from different disease stage. |
Top |
Malignant transformation related pathway analysis |
| Find out the enriched GO biological processes and KEGG pathways involved in transition from healthy to precancer to cancer |
| Tissue | Disease Stage | Enriched GO biological Processes |
| Colorectum | AD |  |
| Colorectum | SER |  |
| Colorectum | MSS |  |
| Colorectum | MSI-H |  |
| Colorectum | FAP |  |
| ∗Top 15 enriched GO BP terms are showed in the bar plot of each disease state in each tissue. Each row represents a significant GO biological process which is colored according to the -log10(p.adjust). |
| Page: 1 2 3 4 5 6 7 8 9 |
| GO ID | Tissue | Disease Stage | Description | Gene Ratio | Bg Ratio | pvalue | p.adjust | Count |
| GO:0071496111 | Esophagus | ESCC | cellular response to external stimulus | 215/8552 | 320/18723 | 4.29e-15 | 2.43e-13 | 215 |
| GO:007121419 | Esophagus | ESCC | cellular response to abiotic stimulus | 206/8552 | 331/18723 | 7.52e-10 | 1.88e-08 | 206 |
| GO:010400419 | Esophagus | ESCC | cellular response to environmental stimulus | 206/8552 | 331/18723 | 7.52e-10 | 1.88e-08 | 206 |
| GO:0032970111 | Esophagus | ESCC | regulation of actin filament-based process | 231/8552 | 397/18723 | 2.91e-07 | 4.20e-06 | 231 |
| GO:004206027 | Esophagus | ESCC | wound healing | 243/8552 | 422/18723 | 4.62e-07 | 6.25e-06 | 243 |
| GO:00712606 | Esophagus | ESCC | cellular response to mechanical stimulus | 54/8552 | 81/18723 | 1.09e-04 | 7.64e-04 | 54 |
| GO:000961216 | Esophagus | ESCC | response to mechanical stimulus | 124/8552 | 216/18723 | 3.30e-04 | 1.94e-03 | 124 |
| GO:003103219 | Esophagus | ESCC | actomyosin structure organization | 108/8552 | 196/18723 | 4.86e-03 | 1.88e-02 | 108 |
| GO:003297012 | Liver | Cirrhotic | regulation of actin filament-based process | 152/4634 | 397/18723 | 1.12e-09 | 5.00e-08 | 152 |
| GO:004206012 | Liver | Cirrhotic | wound healing | 155/4634 | 422/18723 | 2.12e-08 | 7.56e-07 | 155 |
| GO:007149612 | Liver | Cirrhotic | cellular response to external stimulus | 123/4634 | 320/18723 | 3.27e-08 | 1.10e-06 | 123 |
| GO:007121411 | Liver | Cirrhotic | cellular response to abiotic stimulus | 115/4634 | 331/18723 | 2.62e-05 | 3.38e-04 | 115 |
| GO:010400411 | Liver | Cirrhotic | cellular response to environmental stimulus | 115/4634 | 331/18723 | 2.62e-05 | 3.38e-04 | 115 |
| GO:003103212 | Liver | Cirrhotic | actomyosin structure organization | 74/4634 | 196/18723 | 3.39e-05 | 4.17e-04 | 74 |
| GO:0071260 | Liver | Cirrhotic | cellular response to mechanical stimulus | 32/4634 | 81/18723 | 2.34e-03 | 1.42e-02 | 32 |
| GO:00510514 | Liver | Cirrhotic | negative regulation of transport | 141/4634 | 470/18723 | 5.06e-03 | 2.62e-02 | 141 |
| GO:007149622 | Liver | HCC | cellular response to external stimulus | 191/7958 | 320/18723 | 3.40e-10 | 1.13e-08 | 191 |
| GO:003297022 | Liver | HCC | regulation of actin filament-based process | 222/7958 | 397/18723 | 3.81e-08 | 8.30e-07 | 222 |
| GO:007121421 | Liver | HCC | cellular response to abiotic stimulus | 183/7958 | 331/18723 | 1.59e-06 | 2.26e-05 | 183 |
| GO:010400421 | Liver | HCC | cellular response to environmental stimulus | 183/7958 | 331/18723 | 1.59e-06 | 2.26e-05 | 183 |
| Page: 1 2 3 4 |
| Pathway ID | Tissue | Disease Stage | Description | Gene Ratio | Bg Ratio | pvalue | p.adjust | qvalue | Count |
| Page: 1 |
Top |
Cell-cell communication analysis |
| Identification of potential cell-cell interactions between two cell types and their ligand-receptor pairs for different disease states |
| Ligand | Receptor | LRpair | Pathway | Tissue | Disease Stage |
| Page: 1 |
Top |
Single-cell gene regulatory network inference analysis |
| Find out the significant the regulons (TFs) and the target genes of each regulon across cell types for different disease states |
| TF | Cell Type | Tissue | Disease Stage | Target Gene | RSS | Regulon Activity |
| ∗The dot plots of a searched regulon are shown for all cell subpopulations in each disease state of each tissue based on the regulon specific score inferred using pySCENIC and by calculating the average expression. |
| Page: 1 |
Top |
Somatic mutation of malignant transformation related genes |
| Annotation of somatic variants for genes involved in malignant transformation |
| Hugo Symbol | Variant Class | Variant Classification | dbSNP RS | HGVSc | HGVSp | HGVSp Short | SWISSPROT | BIOTYPE | SIFT | PolyPhen | Tumor Sample Barcode | Tissue | Histology | Sex | Age | Stage | Therapy Types | Drugs | Outcome |
| CNN2 | SNV | Missense_Mutation | rs80117328 | c.904N>A | p.Asp302Asn | p.D302N | protein_coding | tolerated(0.31) | benign(0.001) | TCGA-AN-A046-01 | Breast | breast invasive carcinoma | Female | >=65 | I/II | Unknown | Unknown | SD | |
| CNN2 | SNV | Missense_Mutation | rs568958979 | c.225N>G | p.Ile75Met | p.I75M | protein_coding | deleterious(0) | possibly_damaging(0.907) | TCGA-BH-A0AU-01 | Breast | breast invasive carcinoma | Female | <65 | I/II | Unknown | Unknown | SD | |
| CNN2 | insertion | Nonsense_Mutation | novel | c.877_878insGGCAATCCACCCGCCTCGACCTCCCAAACTGCT | p.Lys293delinsArgGlnSerThrArgLeuAspLeuProAsnCysTer | p.K293delinsRQSTRLDLPNC* | protein_coding | TCGA-A8-A09N-01 | Breast | breast invasive carcinoma | Female | <65 | III/IV | Unknown | Unknown | SD | |||
| CNN2 | insertion | In_Frame_Ins | novel | c.879_880insGGT | p.Lys293_Tyr294insGly | p.K293_Y294insG | protein_coding | TCGA-A8-A09N-01 | Breast | breast invasive carcinoma | Female | <65 | III/IV | Unknown | Unknown | SD | |||
| CNN2 | SNV | Missense_Mutation | rs747535545 | c.349N>G | p.Met117Val | p.M117V | protein_coding | tolerated(0.17) | benign(0.007) | TCGA-EA-A50E-01 | Cervix | cervical & endocervical cancer | Female | <65 | I/II | Unknown | Unknown | PD | |
| CNN2 | SNV | Missense_Mutation | novel | c.908G>T | p.Gly303Val | p.G303V | protein_coding | tolerated(0.08) | benign(0.012) | TCGA-5M-AAT6-01 | Colorectum | colon adenocarcinoma | Female | <65 | III/IV | Unknown | Unknown | PD | |
| CNN2 | SNV | Missense_Mutation | c.957N>C | p.Glu319Asp | p.E319D | protein_coding | tolerated(0.13) | benign(0) | TCGA-AA-3492-01 | Colorectum | colon adenocarcinoma | Female | >=65 | I/II | Unknown | Unknown | SD | ||
| CNN2 | SNV | Missense_Mutation | c.494N>C | p.Val165Ala | p.V165A | protein_coding | tolerated(0.06) | benign(0.114) | TCGA-AA-3848-01 | Colorectum | colon adenocarcinoma | Female | >=65 | III/IV | Unknown | Unknown | PD | ||
| CNN2 | SNV | Missense_Mutation | c.880N>G | p.Tyr294Asp | p.Y294D | protein_coding | deleterious(0) | possibly_damaging(0.9) | TCGA-AA-A02F-01 | Colorectum | colon adenocarcinoma | Female | >=65 | III/IV | Chemotherapy | folinic | PR | ||
| CNN2 | SNV | Missense_Mutation | rs757933615 | c.755N>G | p.Tyr252Cys | p.Y252C | protein_coding | deleterious(0.04) | benign(0.081) | TCGA-CK-4951-01 | Colorectum | colon adenocarcinoma | Female | >=65 | I/II | Unknown | Unknown | PD |
| Page: 1 2 3 |
Top |
Related drugs of malignant transformation related genes |
| Identification of chemicals and drugs interact with genes involved in malignant transfromation |
| (DGIdb 4.0) |
| Entrez ID | Symbol | Category | Interaction Types | Drug Claim Name | Drug Name | PMIDs |
| Page: 1 |

Copyright 2023-Present -The University of Texas Health Science Center at Houston |