
|
|||||
|
 | |
| |
| |
| |
| |
| |
|
Gene: CNKSR1 |
Gene summary for CNKSR1 |
| Gene information | Species | Human | Gene symbol | CNKSR1 | Gene ID | 10256 |
| Gene name | connector enhancer of kinase suppressor of Ras 1 | |
| Gene Alias | CNK | |
| Cytomap | 1p36.11 | |
| Gene Type | protein-coding | GO ID | GO:0007154 | UniProtAcc | B4DL25 |
Top |
Malignant transformation analysis |
| Identification of the aberrant gene expression in precancerous and cancerous lesions by comparing the gene expression of stem-like cells in diseased tissues with normal stem cells |
| Entrez ID | Symbol | Replicates | Species | Organ | Tissue | Adj P-value | Log2FC | Malignancy |
| 10256 | CNKSR1 | HTA11_2487_2000001011 | Human | Colorectum | SER | 1.36e-06 | 4.57e-01 | -0.1808 |
| 10256 | CNKSR1 | HTA11_1938_2000001011 | Human | Colorectum | AD | 1.19e-04 | 3.99e-01 | -0.0811 |
| 10256 | CNKSR1 | HTA11_347_2000001011 | Human | Colorectum | AD | 2.73e-08 | 3.51e-01 | -0.1954 |
| 10256 | CNKSR1 | HTA11_411_2000001011 | Human | Colorectum | SER | 2.01e-05 | 8.62e-01 | -0.2602 |
| 10256 | CNKSR1 | HTA11_866_2000001011 | Human | Colorectum | AD | 1.60e-02 | 2.58e-01 | -0.1001 |
| 10256 | CNKSR1 | HTA11_1391_2000001011 | Human | Colorectum | AD | 4.57e-06 | 3.46e-01 | -0.059 |
| 10256 | CNKSR1 | HTA11_546_2000001011 | Human | Colorectum | AD | 2.06e-02 | 3.38e-01 | -0.0842 |
| 10256 | CNKSR1 | HTA11_866_3004761011 | Human | Colorectum | AD | 2.77e-03 | 2.18e-01 | 0.096 |
| 10256 | CNKSR1 | HTA11_6818_2000001011 | Human | Colorectum | AD | 3.88e-02 | 4.43e-01 | 0.0112 |
| 10256 | CNKSR1 | HTA11_99999965104_69814 | Human | Colorectum | MSS | 5.07e-03 | 4.02e-01 | 0.281 |
| 10256 | CNKSR1 | HTA11_99999971662_82457 | Human | Colorectum | MSS | 4.47e-07 | 3.78e-01 | 0.3859 |
| 10256 | CNKSR1 | LZE4T | Human | Esophagus | ESCC | 6.70e-03 | 9.83e-02 | 0.0811 |
| 10256 | CNKSR1 | LZE5T | Human | Esophagus | ESCC | 7.95e-05 | 2.92e-01 | 0.0514 |
| 10256 | CNKSR1 | LZE7T | Human | Esophagus | ESCC | 1.51e-06 | 3.08e-01 | 0.0667 |
| 10256 | CNKSR1 | LZE8T | Human | Esophagus | ESCC | 2.57e-02 | 1.24e-01 | 0.067 |
| 10256 | CNKSR1 | LZE20T | Human | Esophagus | ESCC | 5.93e-05 | 2.18e-01 | 0.0662 |
| 10256 | CNKSR1 | LZE22D1 | Human | Esophagus | HGIN | 9.32e-04 | 1.94e-01 | 0.0595 |
| 10256 | CNKSR1 | LZE22T | Human | Esophagus | ESCC | 1.06e-02 | 2.92e-01 | 0.068 |
| 10256 | CNKSR1 | LZE24T | Human | Esophagus | ESCC | 8.78e-21 | 5.23e-01 | 0.0596 |
| 10256 | CNKSR1 | P1T-E | Human | Esophagus | ESCC | 1.82e-10 | 5.56e-01 | 0.0875 |
| Page: 1 2 3 4 5 |
| Tissue | Expression Dynamics | Abbreviation |
| Colorectum (GSE201348) |  | FAP: Familial adenomatous polyposis |
| CRC: Colorectal cancer | ||
| Colorectum (HTA11) |  | AD: Adenomas |
| SER: Sessile serrated lesions | ||
| MSI-H: Microsatellite-high colorectal cancer | ||
| MSS: Microsatellite stable colorectal cancer | ||
| Esophagus | 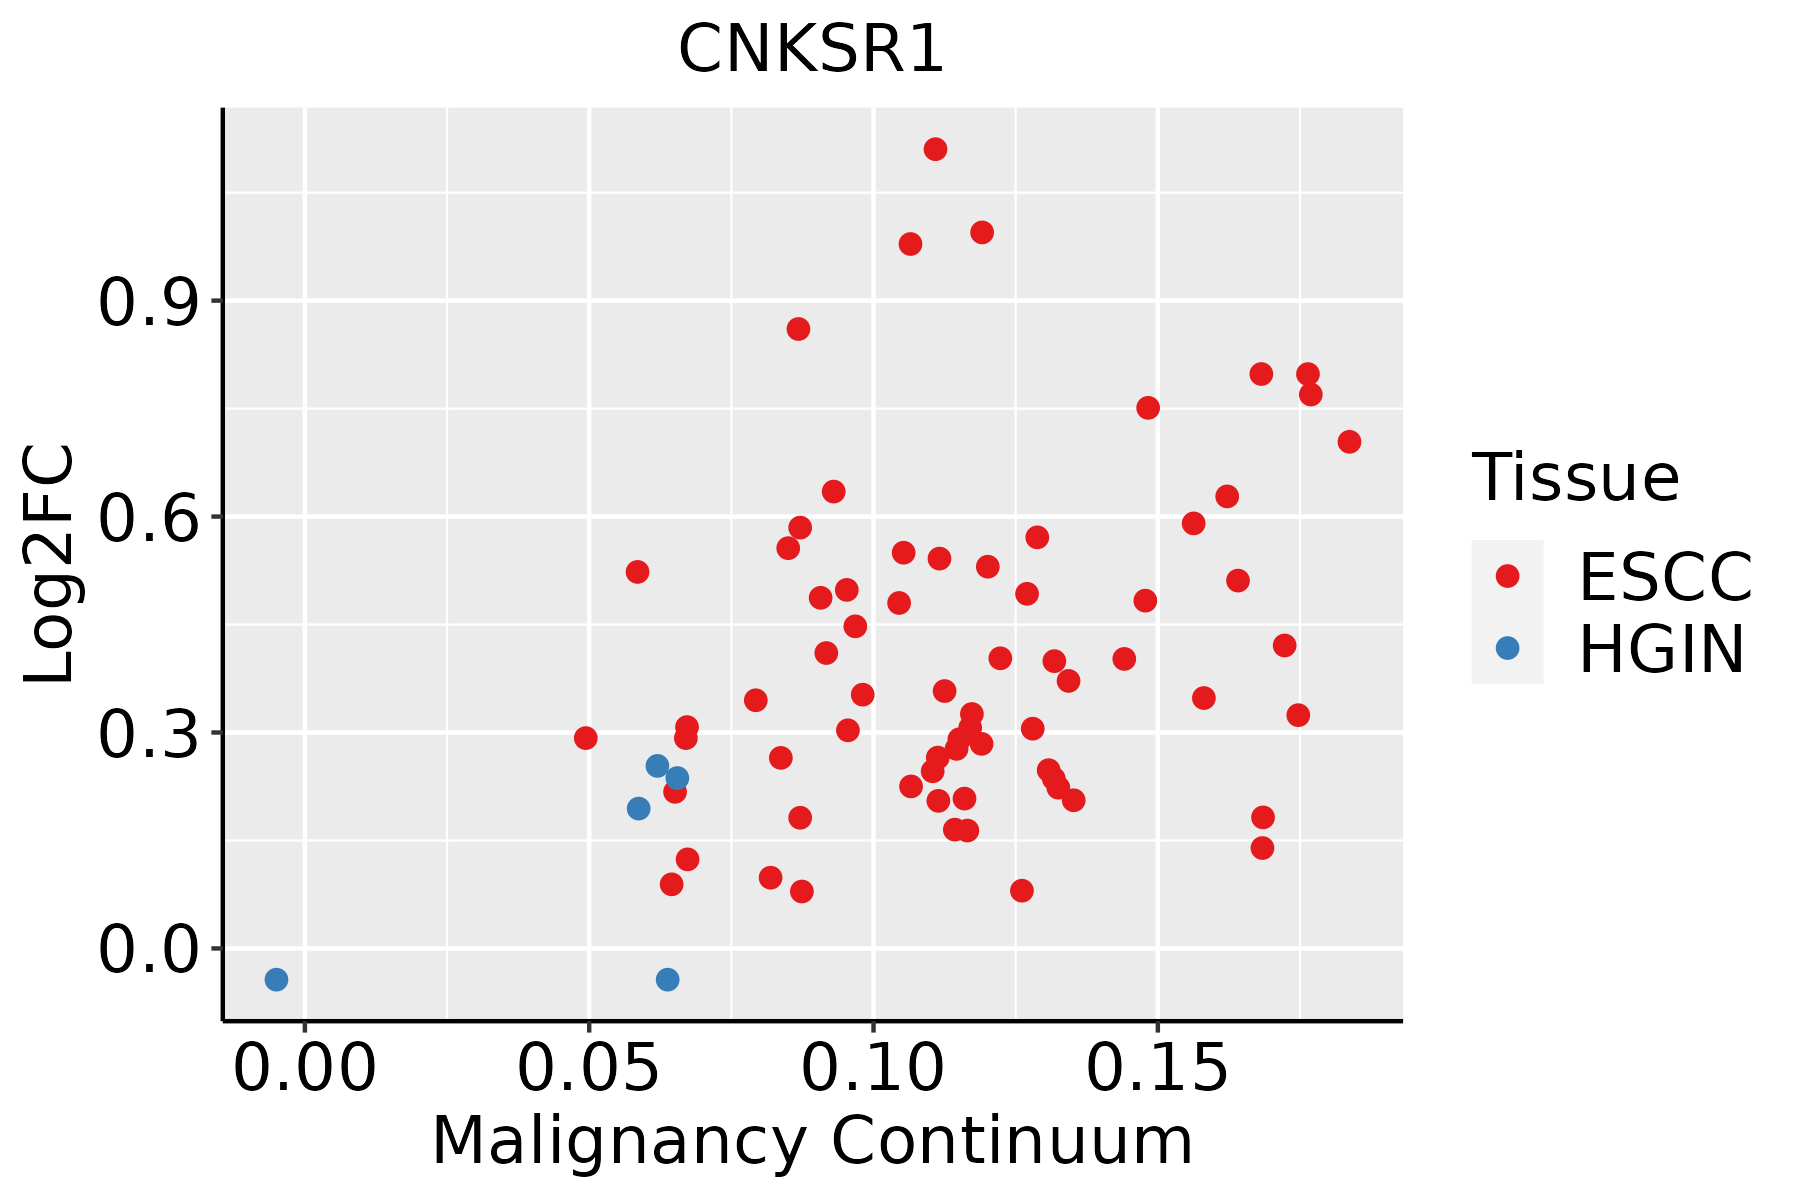 | ESCC: Esophageal squamous cell carcinoma |
| HGIN: High-grade intraepithelial neoplasias | ||
| LGIN: Low-grade intraepithelial neoplasias | ||
| Oral Cavity | 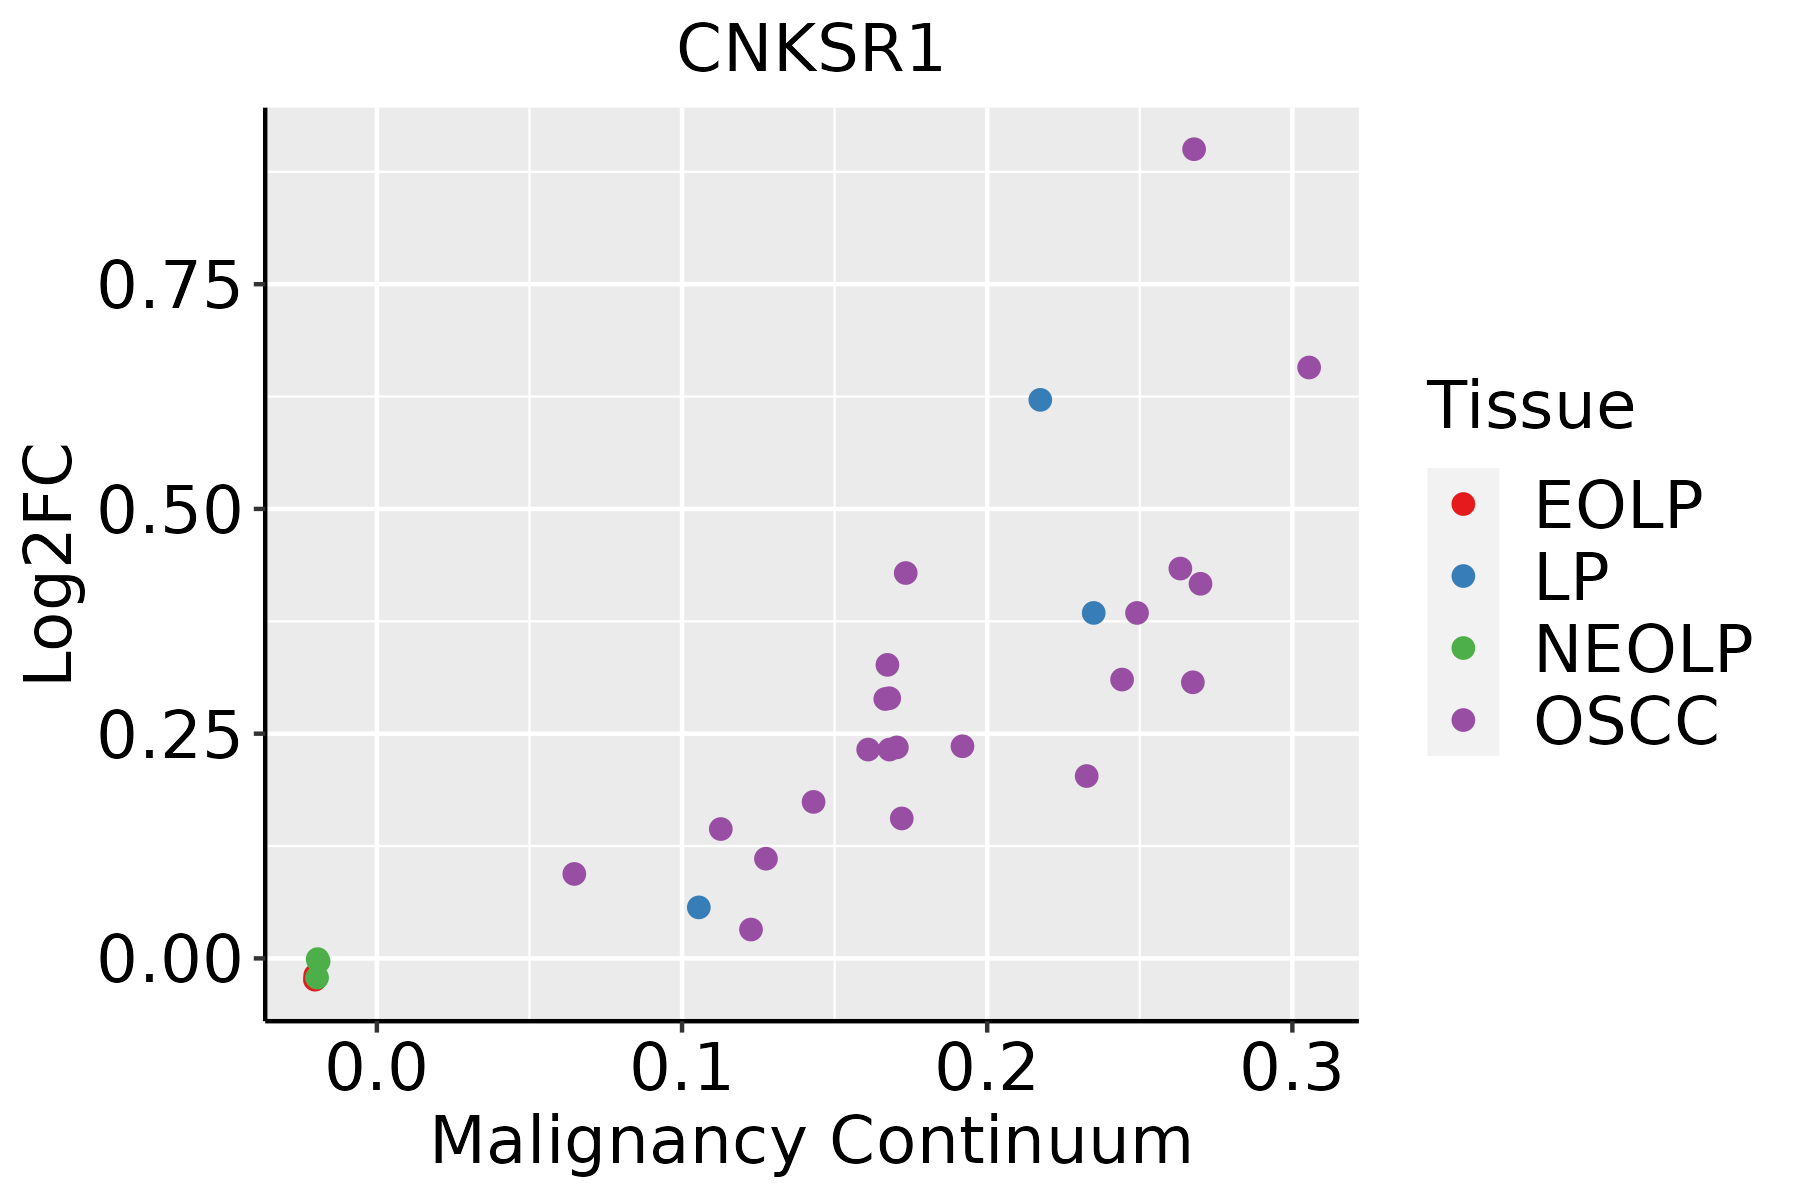 | EOLP: Erosive Oral lichen planus |
| LP: leukoplakia | ||
| NEOLP: Non-erosive oral lichen planus | ||
| OSCC: Oral squamous cell carcinoma | ||
| Skin |  | AK: Actinic keratosis |
| cSCC: Cutaneous squamous cell carcinoma | ||
| SCCIS:squamous cell carcinoma in situ |
| ∗log2FC in expression of this searched gene in stem-like cells from each diseased tissue sample relative to stem-like cells in normal samples in each tissue plotted against the malignancy continuum. Samples are colored based on if they are from different disease stage. |
Top |
Malignant transformation related pathway analysis |
| Find out the enriched GO biological processes and KEGG pathways involved in transition from healthy to precancer to cancer |
| Tissue | Disease Stage | Enriched GO biological Processes |
| Colorectum | AD |  |
| Colorectum | SER |  |
| Colorectum | MSS |  |
| Colorectum | MSI-H |  |
| Colorectum | FAP |  |
| ∗Top 15 enriched GO BP terms are showed in the bar plot of each disease state in each tissue. Each row represents a significant GO biological process which is colored according to the -log10(p.adjust). |
| Page: 1 2 3 4 5 6 7 8 9 |
| GO ID | Tissue | Disease Stage | Description | Gene Ratio | Bg Ratio | pvalue | p.adjust | Count |
| GO:0007265 | Colorectum | AD | Ras protein signal transduction | 104/3918 | 337/18723 | 1.01e-05 | 2.35e-04 | 104 |
| GO:0007266 | Colorectum | AD | Rho protein signal transduction | 42/3918 | 137/18723 | 4.64e-03 | 3.16e-02 | 42 |
| GO:00072651 | Colorectum | MSS | Ras protein signal transduction | 91/3467 | 337/18723 | 7.20e-05 | 1.21e-03 | 91 |
| GO:000726510 | Esophagus | ESCC | Ras protein signal transduction | 201/8552 | 337/18723 | 1.44e-07 | 2.30e-06 | 201 |
| GO:000726610 | Esophagus | ESCC | Rho protein signal transduction | 81/8552 | 137/18723 | 1.03e-03 | 5.20e-03 | 81 |
| GO:00072659 | Oral cavity | OSCC | Ras protein signal transduction | 185/7305 | 337/18723 | 1.95e-09 | 4.60e-08 | 185 |
| GO:00072669 | Oral cavity | OSCC | Rho protein signal transduction | 76/7305 | 137/18723 | 6.64e-05 | 5.37e-04 | 76 |
| GO:000726515 | Oral cavity | LP | Ras protein signal transduction | 109/4623 | 337/18723 | 8.44e-04 | 7.36e-03 | 109 |
| GO:000726516 | Skin | AK | Ras protein signal transduction | 68/1910 | 337/18723 | 2.83e-08 | 1.57e-06 | 68 |
| GO:000726616 | Skin | AK | Rho protein signal transduction | 31/1910 | 137/18723 | 1.60e-05 | 3.09e-04 | 31 |
| GO:000726523 | Skin | cSCC | Ras protein signal transduction | 132/4864 | 337/18723 | 6.17e-08 | 1.57e-06 | 132 |
| GO:000726617 | Skin | cSCC | Rho protein signal transduction | 51/4864 | 137/18723 | 2.38e-03 | 1.38e-02 | 51 |
| Page: 1 |
| Pathway ID | Tissue | Disease Stage | Description | Gene Ratio | Bg Ratio | pvalue | p.adjust | qvalue | Count |
| Page: 1 |
Top |
Cell-cell communication analysis |
| Identification of potential cell-cell interactions between two cell types and their ligand-receptor pairs for different disease states |
| Ligand | Receptor | LRpair | Pathway | Tissue | Disease Stage |
| Page: 1 |
Top |
Single-cell gene regulatory network inference analysis |
| Find out the significant the regulons (TFs) and the target genes of each regulon across cell types for different disease states |
| TF | Cell Type | Tissue | Disease Stage | Target Gene | RSS | Regulon Activity |
| ∗The dot plots of a searched regulon are shown for all cell subpopulations in each disease state of each tissue based on the regulon specific score inferred using pySCENIC and by calculating the average expression. |
| Page: 1 |
Top |
Somatic mutation of malignant transformation related genes |
| Annotation of somatic variants for genes involved in malignant transformation |
| Hugo Symbol | Variant Class | Variant Classification | dbSNP RS | HGVSc | HGVSp | HGVSp Short | SWISSPROT | BIOTYPE | SIFT | PolyPhen | Tumor Sample Barcode | Tissue | Histology | Sex | Age | Stage | Therapy Types | Drugs | Outcome |
| CNKSR1 | SNV | Missense_Mutation | novel | c.874N>G | p.Gln292Glu | p.Q292E | Q969H4 | protein_coding | tolerated(0.16) | benign(0.058) | TCGA-A8-A07P-01 | Breast | breast invasive carcinoma | Female | >=65 | I/II | Chemotherapy | 5-fluorouracil | SD |
| CNKSR1 | SNV | Missense_Mutation | c.1025N>T | p.Ser342Phe | p.S342F | Q969H4 | protein_coding | deleterious(0.01) | benign(0.127) | TCGA-AN-A0XW-01 | Breast | breast invasive carcinoma | Female | <65 | III/IV | Unknown | Unknown | SD | |
| CNKSR1 | SNV | Missense_Mutation | c.115N>T | p.Leu39Phe | p.L39F | Q969H4 | protein_coding | deleterious(0) | probably_damaging(0.999) | TCGA-BH-A0EE-01 | Breast | breast invasive carcinoma | Female | >=65 | I/II | Chemotherapy | docetaxel | SD | |
| CNKSR1 | SNV | Missense_Mutation | c.175C>G | p.Leu59Val | p.L59V | Q969H4 | protein_coding | deleterious(0.04) | possibly_damaging(0.871) | TCGA-BH-A0HK-01 | Breast | breast invasive carcinoma | Female | >=65 | I/II | Hormone Therapy | arimidex | SD | |
| CNKSR1 | SNV | Missense_Mutation | c.412A>C | p.Asn138His | p.N138H | Q969H4 | protein_coding | tolerated(0.13) | probably_damaging(1) | TCGA-D8-A27M-01 | Breast | breast invasive carcinoma | Female | <65 | I/II | Chemotherapy | methotrexate+5 | SD | |
| CNKSR1 | SNV | Missense_Mutation | novel | c.1180C>T | p.Arg394Trp | p.R394W | Q969H4 | protein_coding | deleterious(0) | probably_damaging(0.999) | TCGA-PE-A5DE-01 | Breast | breast invasive carcinoma | Female | <65 | I/II | Chemotherapy | taxotere | CR |
| CNKSR1 | SNV | Missense_Mutation | rs372242005 | c.1304N>T | p.Thr435Met | p.T435M | Q969H4 | protein_coding | tolerated(0.11) | benign(0.211) | TCGA-Z7-A8R5-01 | Breast | breast invasive carcinoma | Female | <65 | III/IV | Chemotherapy | adriamycin | PD |
| CNKSR1 | insertion | In_Frame_Ins | novel | c.1884_1885insGAGCTCCAGAAACAG | p.Ser628_Thr629insGluLeuGlnLysGln | p.S628_T629insELQKQ | Q969H4 | protein_coding | TCGA-A8-A06X-01 | Breast | breast invasive carcinoma | Female | >=65 | I/II | Unknown | Unknown | SD | ||
| CNKSR1 | insertion | Frame_Shift_Ins | novel | c.875_876insGAGTT | p.Thr293SerfsTer2 | p.T293Sfs*2 | Q969H4 | protein_coding | TCGA-A8-A07P-01 | Breast | breast invasive carcinoma | Female | >=65 | I/II | Chemotherapy | 5-fluorouracil | SD | ||
| CNKSR1 | insertion | Nonsense_Mutation | novel | c.40_41insTCCTGCTATGTTGCCCAGGGTGGCTTTGACTC | p.Thr14IlefsTer10 | p.T14Ifs*10 | Q969H4 | protein_coding | TCGA-A8-A07U-01 | Breast | breast invasive carcinoma | Female | >=65 | III/IV | Chemotherapy | 5-fluorouracil | SD |
| Page: 1 2 3 4 5 6 7 8 9 |
Top |
Related drugs of malignant transformation related genes |
| Identification of chemicals and drugs interact with genes involved in malignant transfromation |
| (DGIdb 4.0) |
| Entrez ID | Symbol | Category | Interaction Types | Drug Claim Name | Drug Name | PMIDs |
| Page: 1 |

Copyright 2023-Present -The University of Texas Health Science Center at Houston |