
|
|||||
|
 | |
| |
| |
| |
| |
| |
|
Gene: CNIH1 |
Gene summary for CNIH1 |
| Gene information | Species | Human | Gene symbol | CNIH1 | Gene ID | 10175 |
| Gene name | cornichon family AMPA receptor auxiliary protein 1 | |
| Gene Alias | CNIH | |
| Cytomap | 14q22.2 | |
| Gene Type | protein-coding | GO ID | GO:0002376 | UniProtAcc | B2R4P1 |
Top |
Malignant transformation analysis |
| Identification of the aberrant gene expression in precancerous and cancerous lesions by comparing the gene expression of stem-like cells in diseased tissues with normal stem cells |
| Entrez ID | Symbol | Replicates | Species | Organ | Tissue | Adj P-value | Log2FC | Malignancy |
| 10175 | CNIH1 | HTA11_347_2000001011 | Human | Colorectum | AD | 4.75e-03 | 2.51e-01 | -0.1954 |
| 10175 | CNIH1 | HTA11_866_3004761011 | Human | Colorectum | AD | 4.90e-04 | 3.48e-01 | 0.096 |
| 10175 | CNIH1 | HTA11_99999970781_79442 | Human | Colorectum | MSS | 3.48e-15 | 6.56e-01 | 0.294 |
| 10175 | CNIH1 | A018-E-020 | Human | Colorectum | FAP | 1.39e-03 | -1.52e-01 | -0.2034 |
| 10175 | CNIH1 | LZE3D | Human | Esophagus | HGIN | 3.02e-02 | 7.70e-01 | 0.0668 |
| 10175 | CNIH1 | LZE4T | Human | Esophagus | ESCC | 2.01e-23 | 1.10e+00 | 0.0811 |
| 10175 | CNIH1 | LZE7T | Human | Esophagus | ESCC | 6.22e-05 | 2.58e-01 | 0.0667 |
| 10175 | CNIH1 | LZE21D1 | Human | Esophagus | HGIN | 1.67e-05 | 4.48e-01 | 0.0632 |
| 10175 | CNIH1 | LZE24T | Human | Esophagus | ESCC | 5.62e-13 | 6.90e-01 | 0.0596 |
| 10175 | CNIH1 | LZE6T | Human | Esophagus | ESCC | 9.51e-03 | 7.36e-01 | 0.0845 |
| 10175 | CNIH1 | P2T-E | Human | Esophagus | ESCC | 1.48e-20 | 6.84e-01 | 0.1177 |
| 10175 | CNIH1 | P4T-E | Human | Esophagus | ESCC | 1.07e-44 | 1.59e+00 | 0.1323 |
| 10175 | CNIH1 | P5T-E | Human | Esophagus | ESCC | 2.10e-29 | 1.01e+00 | 0.1327 |
| 10175 | CNIH1 | P8T-E | Human | Esophagus | ESCC | 7.46e-43 | 1.13e+00 | 0.0889 |
| 10175 | CNIH1 | P9T-E | Human | Esophagus | ESCC | 3.20e-13 | 7.22e-01 | 0.1131 |
| 10175 | CNIH1 | P10T-E | Human | Esophagus | ESCC | 1.24e-56 | 1.30e+00 | 0.116 |
| 10175 | CNIH1 | P11T-E | Human | Esophagus | ESCC | 4.29e-09 | 1.01e+00 | 0.1426 |
| 10175 | CNIH1 | P12T-E | Human | Esophagus | ESCC | 6.97e-54 | 1.49e+00 | 0.1122 |
| 10175 | CNIH1 | P15T-E | Human | Esophagus | ESCC | 2.60e-65 | 2.37e+00 | 0.1149 |
| 10175 | CNIH1 | P16T-E | Human | Esophagus | ESCC | 8.59e-18 | 5.59e-01 | 0.1153 |
| Page: 1 2 3 4 5 6 7 |
| Tissue | Expression Dynamics | Abbreviation |
| Colorectum (GSE201348) |  | FAP: Familial adenomatous polyposis |
| CRC: Colorectal cancer | ||
| Colorectum (HTA11) |  | AD: Adenomas |
| SER: Sessile serrated lesions | ||
| MSI-H: Microsatellite-high colorectal cancer | ||
| MSS: Microsatellite stable colorectal cancer | ||
| Esophagus |  | ESCC: Esophageal squamous cell carcinoma |
| HGIN: High-grade intraepithelial neoplasias | ||
| LGIN: Low-grade intraepithelial neoplasias | ||
| Liver | 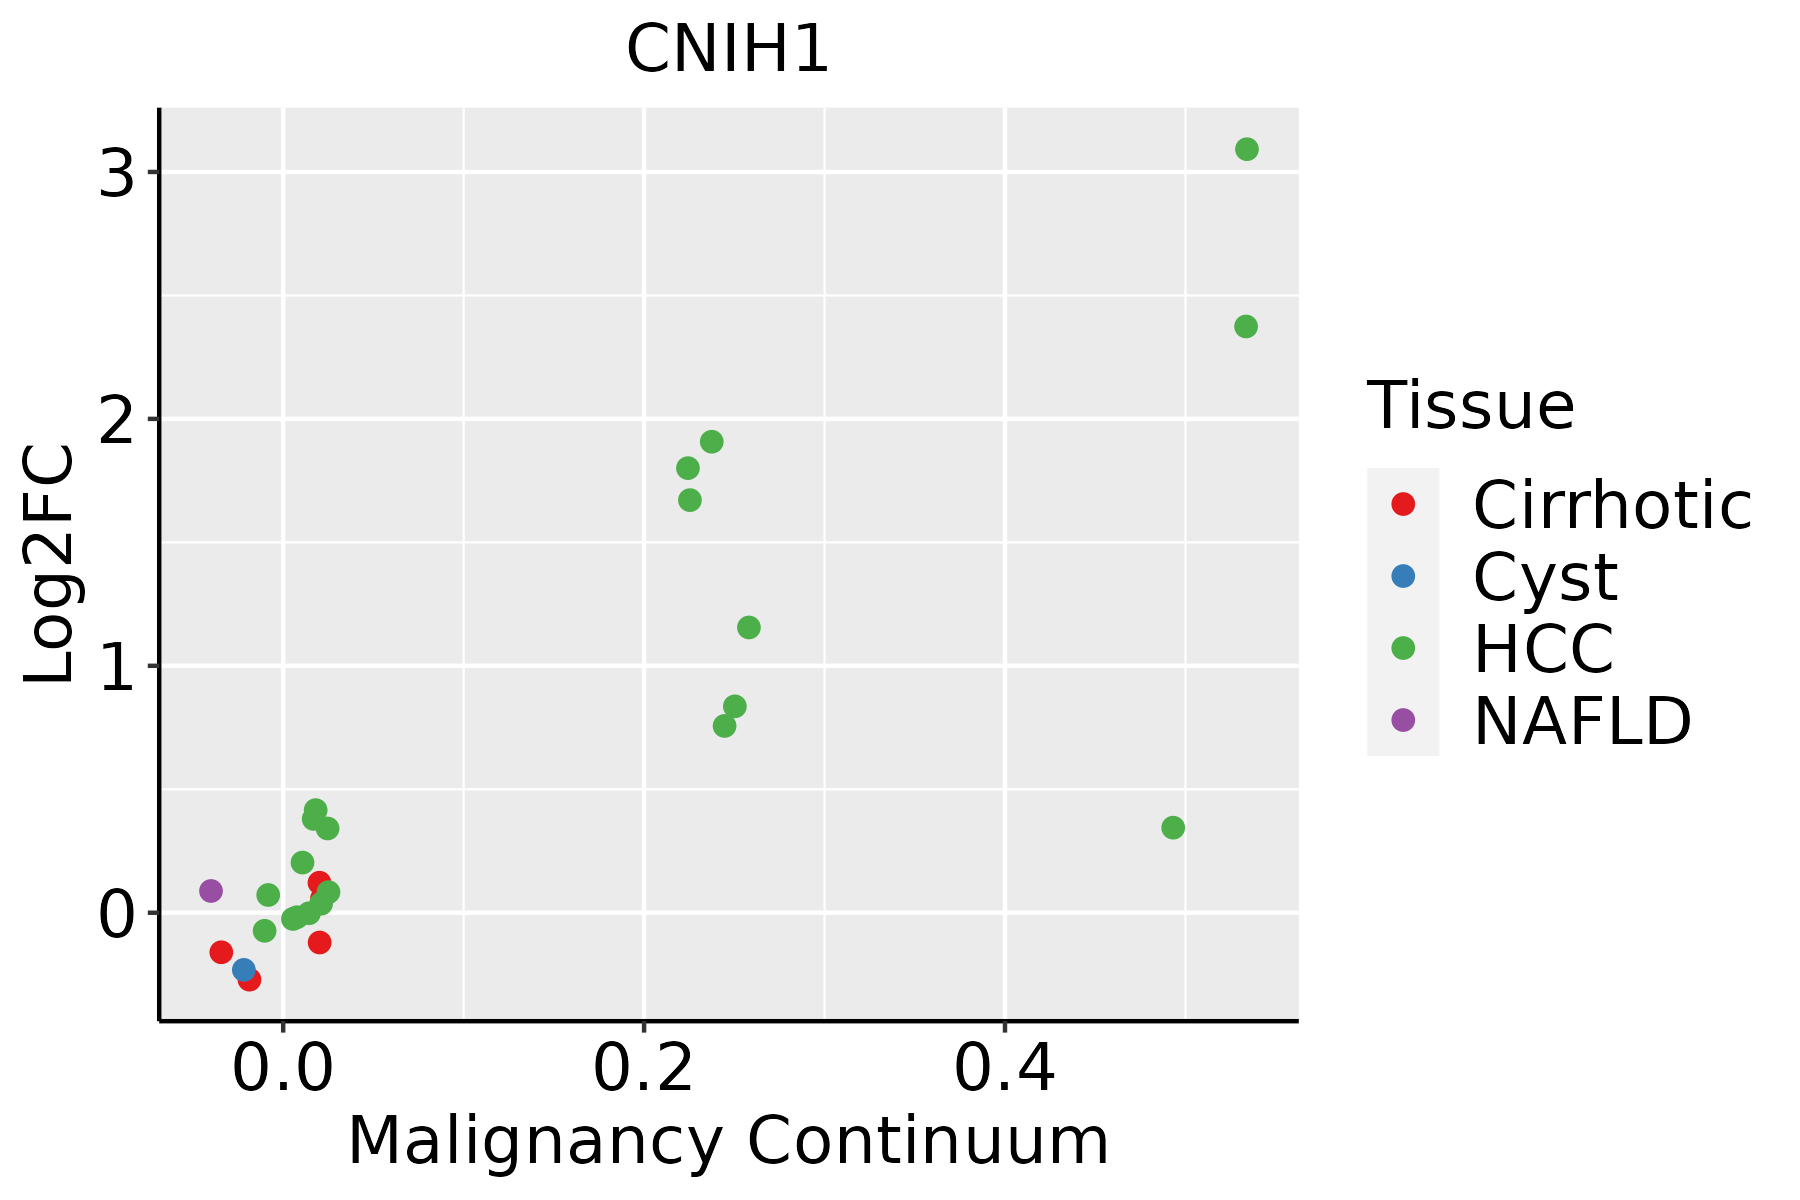 | HCC: Hepatocellular carcinoma |
| NAFLD: Non-alcoholic fatty liver disease | ||
| Oral Cavity | 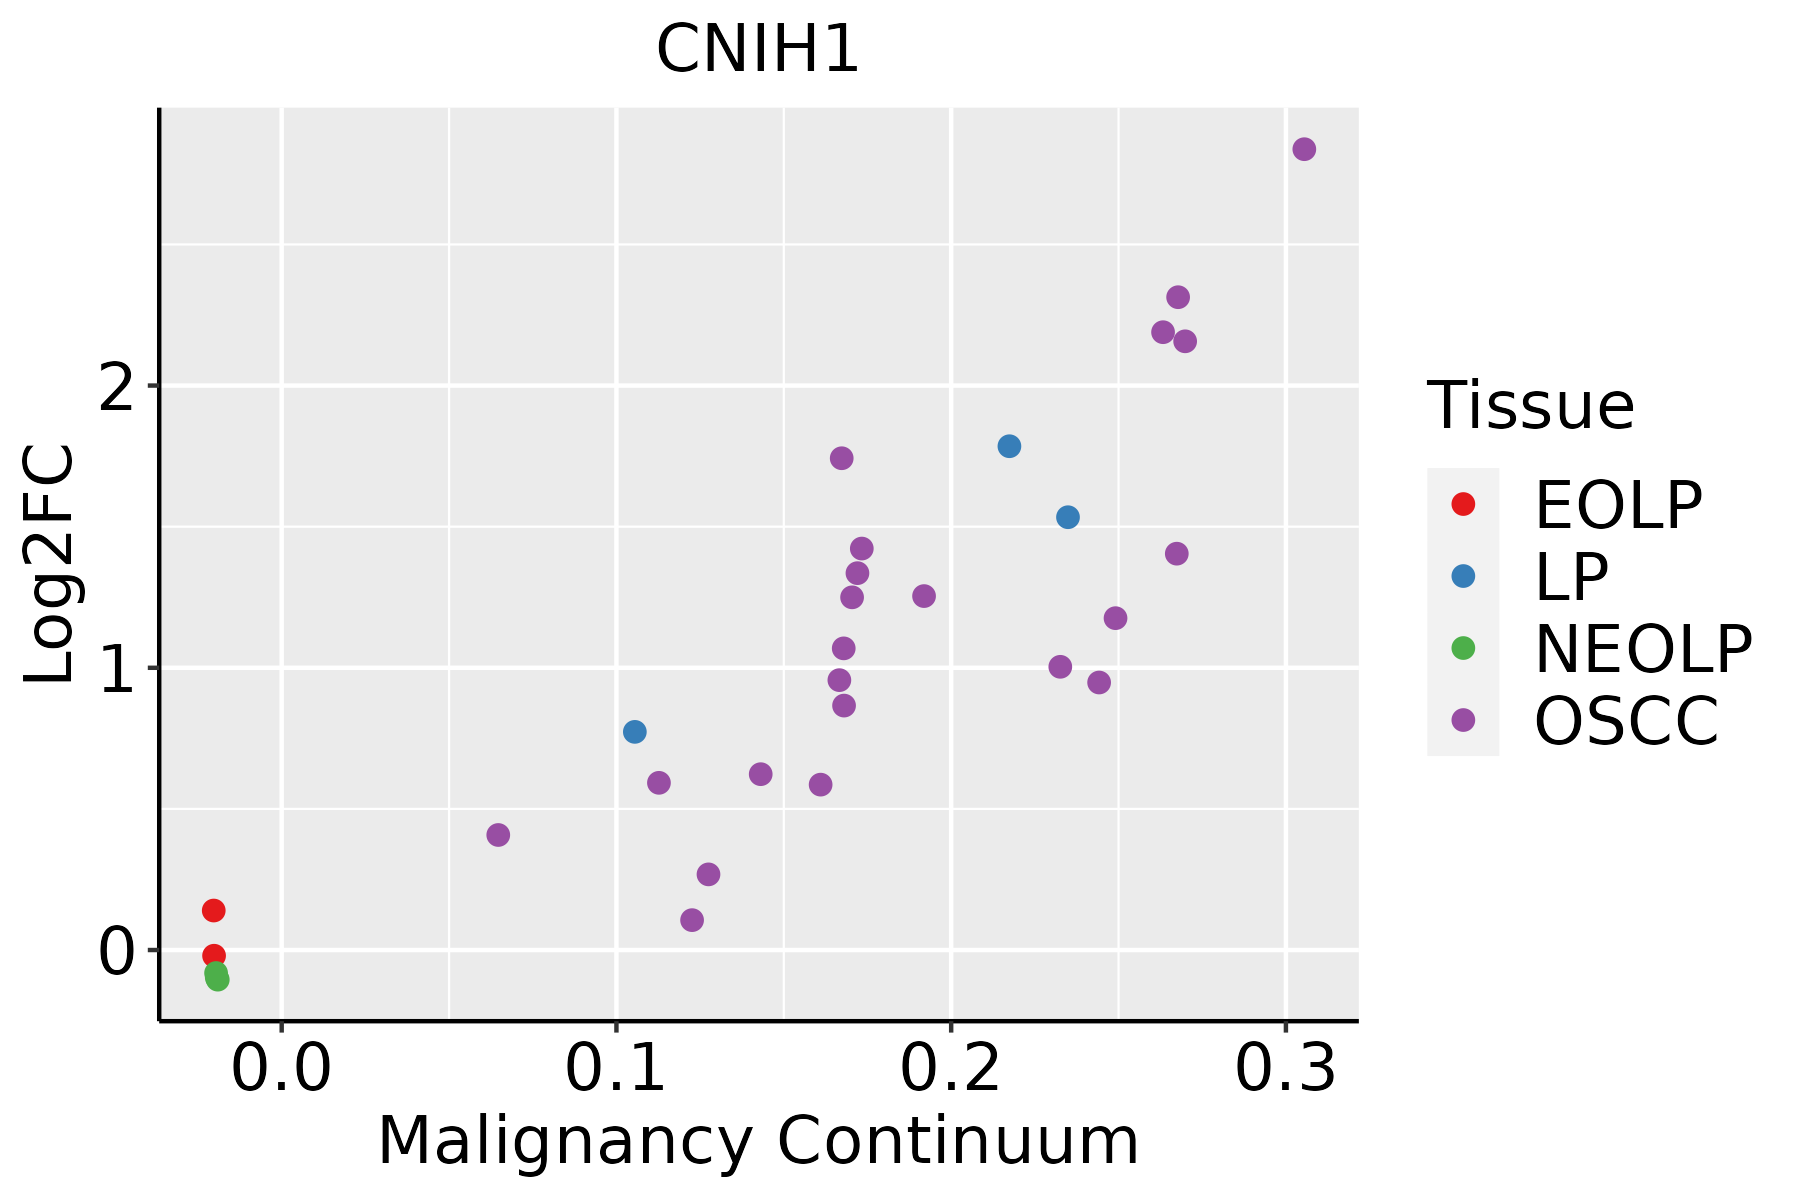 | EOLP: Erosive Oral lichen planus |
| LP: leukoplakia | ||
| NEOLP: Non-erosive oral lichen planus | ||
| OSCC: Oral squamous cell carcinoma | ||
| Skin | 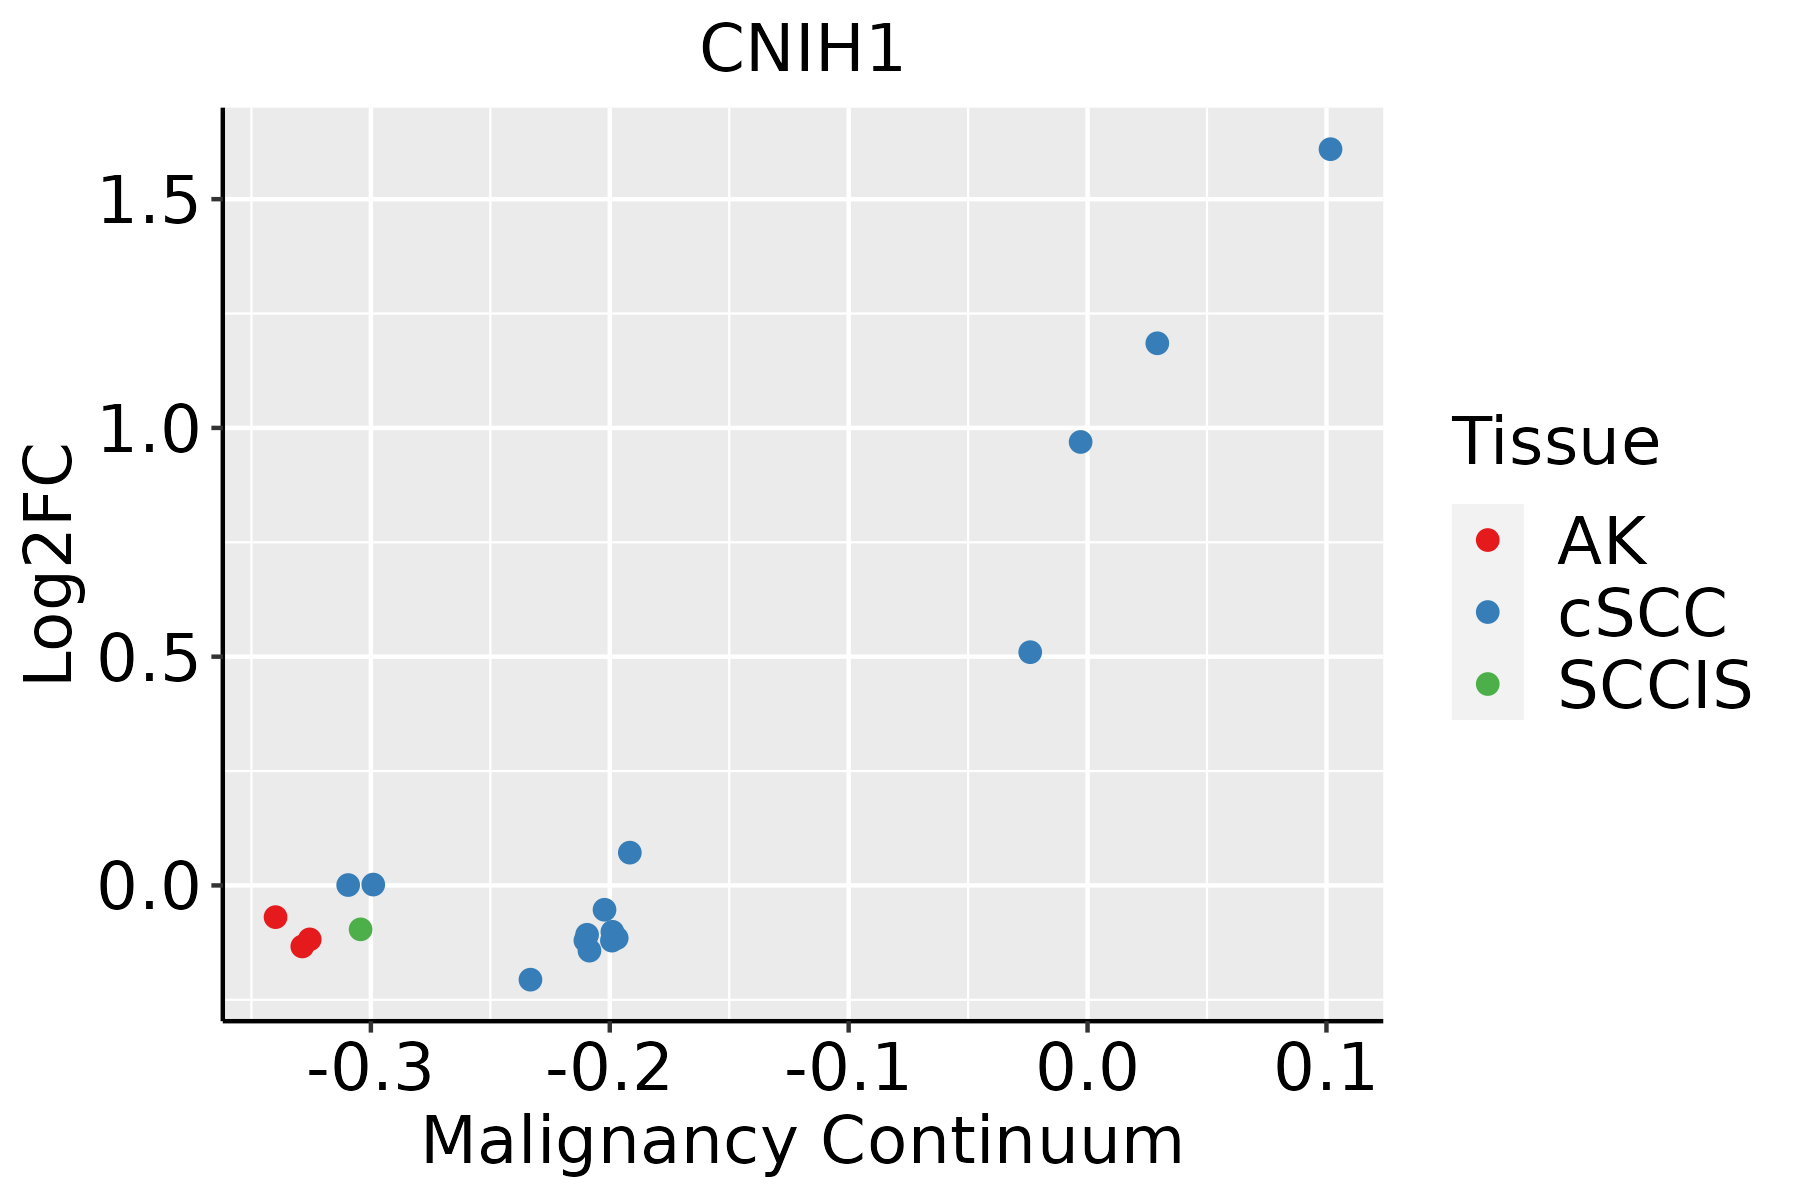 | AK: Actinic keratosis |
| cSCC: Cutaneous squamous cell carcinoma | ||
| SCCIS:squamous cell carcinoma in situ | ||
| Thyroid | 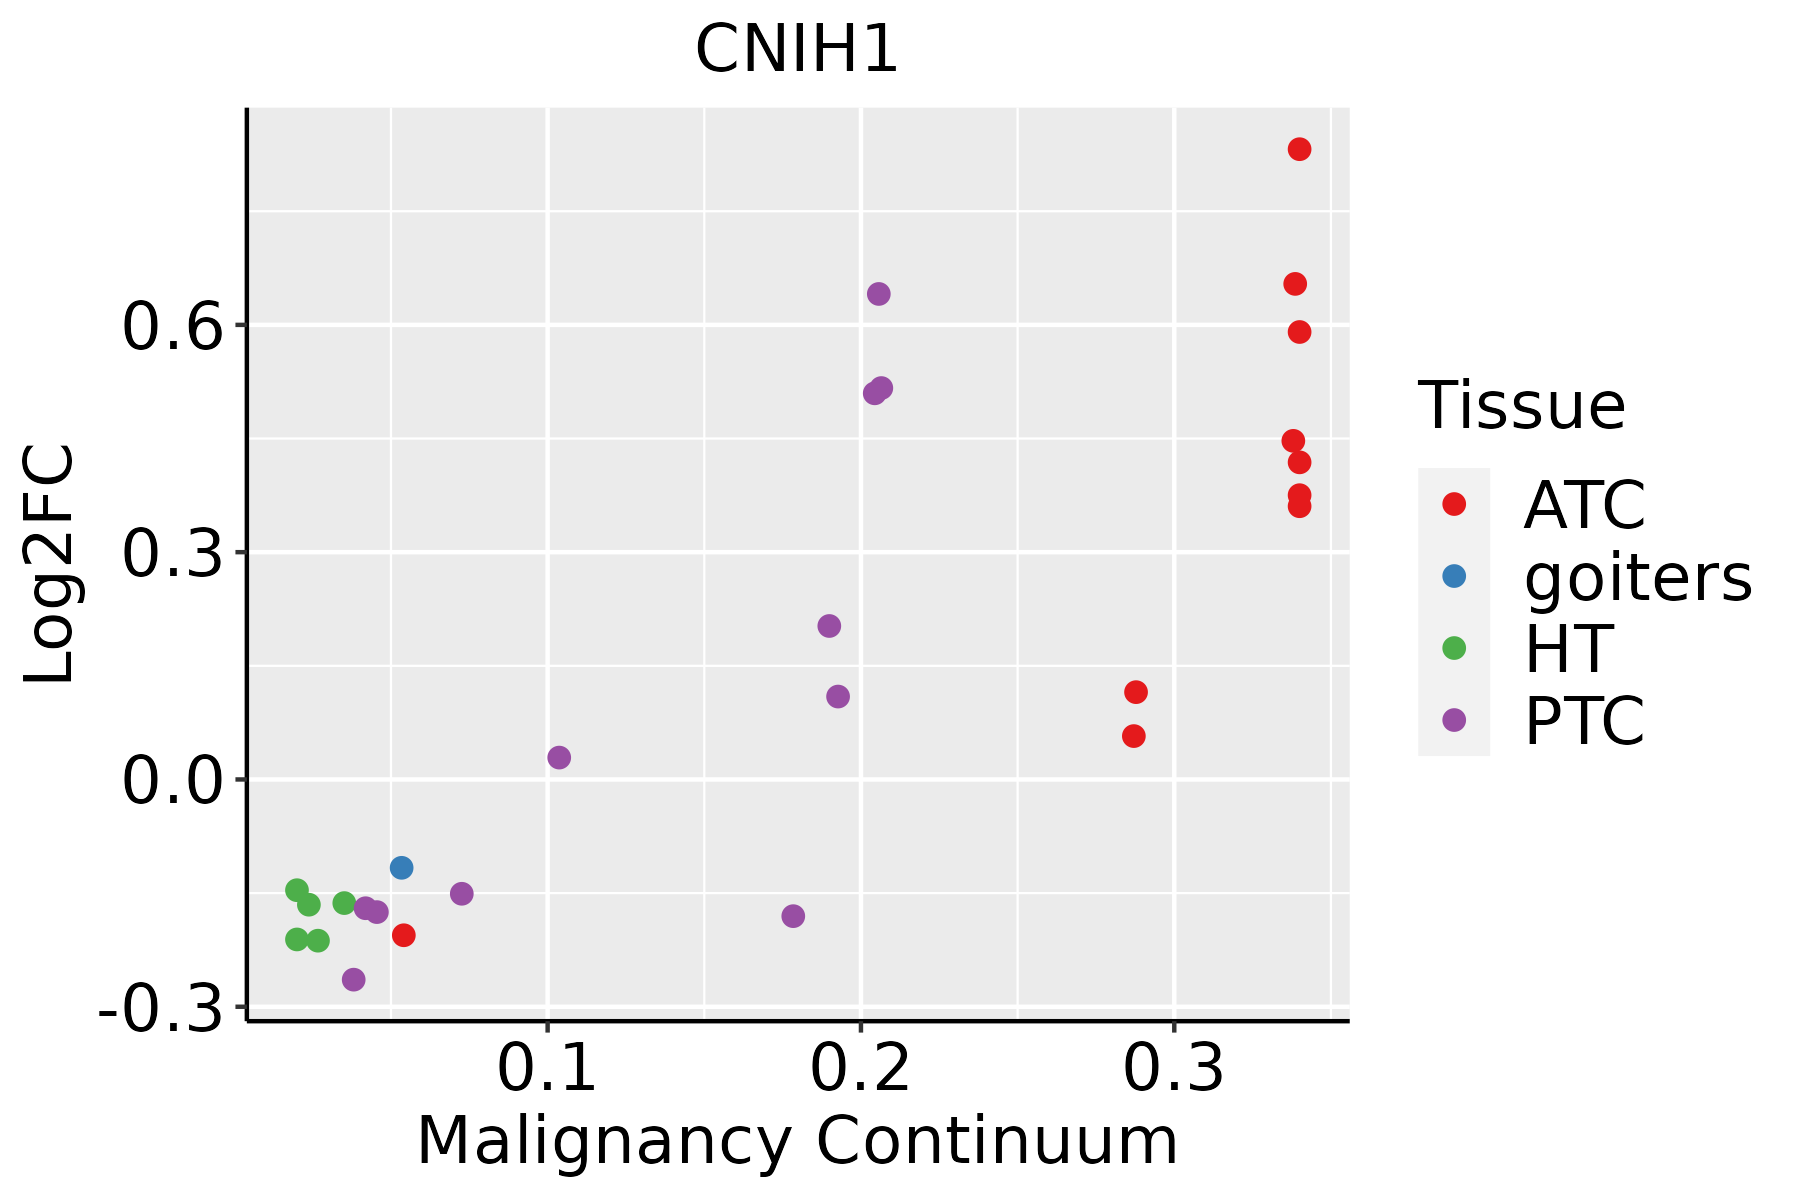 | ATC: Anaplastic thyroid cancer |
| HT: Hashimoto's thyroiditis | ||
| PTC: Papillary thyroid cancer |
| ∗log2FC in expression of this searched gene in stem-like cells from each diseased tissue sample relative to stem-like cells in normal samples in each tissue plotted against the malignancy continuum. Samples are colored based on if they are from different disease stage. |
Top |
Malignant transformation related pathway analysis |
| Find out the enriched GO biological processes and KEGG pathways involved in transition from healthy to precancer to cancer |
| Tissue | Disease Stage | Enriched GO biological Processes |
| Colorectum | AD |  |
| Colorectum | SER |  |
| Colorectum | MSS |  |
| Colorectum | MSI-H |  |
| Colorectum | FAP |  |
| ∗Top 15 enriched GO BP terms are showed in the bar plot of each disease state in each tissue. Each row represents a significant GO biological process which is colored according to the -log10(p.adjust). |
| Page: 1 2 3 4 5 6 7 8 9 |
| GO ID | Tissue | Disease Stage | Description | Gene Ratio | Bg Ratio | pvalue | p.adjust | Count |
| Page: 1 |
| Pathway ID | Tissue | Disease Stage | Description | Gene Ratio | Bg Ratio | pvalue | p.adjust | qvalue | Count |
| Page: 1 |
Top |
Cell-cell communication analysis |
| Identification of potential cell-cell interactions between two cell types and their ligand-receptor pairs for different disease states |
| Ligand | Receptor | LRpair | Pathway | Tissue | Disease Stage |
| Page: 1 |
Top |
Single-cell gene regulatory network inference analysis |
| Find out the significant the regulons (TFs) and the target genes of each regulon across cell types for different disease states |
| TF | Cell Type | Tissue | Disease Stage | Target Gene | RSS | Regulon Activity |
| ∗The dot plots of a searched regulon are shown for all cell subpopulations in each disease state of each tissue based on the regulon specific score inferred using pySCENIC and by calculating the average expression. |
| Page: 1 |
Top |
Somatic mutation of malignant transformation related genes |
| Annotation of somatic variants for genes involved in malignant transformation |
| Hugo Symbol | Variant Class | Variant Classification | dbSNP RS | HGVSc | HGVSp | HGVSp Short | SWISSPROT | BIOTYPE | SIFT | PolyPhen | Tumor Sample Barcode | Tissue | Histology | Sex | Age | Stage | Therapy Types | Drugs | Outcome |
| CNIH1 | insertion | In_Frame_Ins | novel | c.281_282insCTATCA | p.Val94_Met95insTyrGln | p.V94_M95insYQ | O95406 | protein_coding | TCGA-A8-A079-01 | Breast | breast invasive carcinoma | Female | >=65 | III/IV | Chemotherapy | 5-fluorouracil | SD | ||
| CNIH1 | insertion | Nonsense_Mutation | novel | c.279_280insTTTGTTGTGTTTTAAGGTT | p.Val94PhefsTer5 | p.V94Ffs*5 | O95406 | protein_coding | TCGA-A8-A079-01 | Breast | breast invasive carcinoma | Female | >=65 | III/IV | Chemotherapy | 5-fluorouracil | SD | ||
| CNIH1 | SNV | Missense_Mutation | c.97N>A | p.Glu33Lys | p.E33K | O95406 | protein_coding | deleterious(0.02) | possibly_damaging(0.755) | TCGA-DR-A0ZM-01 | Cervix | cervical & endocervical cancer | Female | <65 | III/IV | Unspecific | Cisplatin | SD | |
| CNIH1 | SNV | Missense_Mutation | c.208N>A | p.Ala70Thr | p.A70T | O95406 | protein_coding | tolerated(0.14) | benign(0.023) | TCGA-AA-A01R-01 | Colorectum | colon adenocarcinoma | Male | <65 | III/IV | Chemotherapy | 5-fluorouracil | PD | |
| CNIH1 | SNV | Missense_Mutation | c.400N>A | p.Leu134Ile | p.L134I | O95406 | protein_coding | deleterious(0.04) | probably_damaging(0.999) | TCGA-D5-6928-01 | Colorectum | colon adenocarcinoma | Male | >=65 | I/II | Unknown | Unknown | SD | |
| CNIH1 | SNV | Missense_Mutation | c.208N>A | p.Ala70Thr | p.A70T | O95406 | protein_coding | tolerated(0.14) | benign(0.023) | TCGA-G4-6320-01 | Colorectum | colon adenocarcinoma | Male | >=65 | III/IV | Chemotherapy | oxaliplatin | SD | |
| CNIH1 | deletion | Frame_Shift_Del | c.394delT | p.Tyr132ThrfsTer6 | p.Y132Tfs*6 | O95406 | protein_coding | TCGA-AA-3833-01 | Colorectum | colon adenocarcinoma | Female | <65 | I/II | Unknown | Unknown | SD | |||
| CNIH1 | deletion | Frame_Shift_Del | c.394delT | p.Tyr132ThrfsTer6 | p.Y132Tfs*6 | O95406 | protein_coding | TCGA-AA-A022-01 | Colorectum | colon adenocarcinoma | Female | >=65 | I/II | Unknown | Unknown | SD | |||
| CNIH1 | deletion | Frame_Shift_Del | c.394delN | p.Tyr132ThrfsTer6 | p.Y132Tfs*6 | O95406 | protein_coding | TCGA-AZ-6598-01 | Colorectum | colon adenocarcinoma | Female | >=65 | I/II | Unknown | Unknown | SD | |||
| CNIH1 | SNV | Missense_Mutation | c.286N>C | p.Ser96Arg | p.S96R | O95406 | protein_coding | deleterious(0.02) | possibly_damaging(0.88) | TCGA-AP-A059-01 | Endometrium | uterine corpus endometrioid carcinoma | Female | >=65 | I/II | Unknown | Unknown | SD |
| Page: 1 2 3 |
Top |
Related drugs of malignant transformation related genes |
| Identification of chemicals and drugs interact with genes involved in malignant transfromation |
| (DGIdb 4.0) |
| Entrez ID | Symbol | Category | Interaction Types | Drug Claim Name | Drug Name | PMIDs |
| Page: 1 |

Copyright 2023-Present -The University of Texas Health Science Center at Houston |