
|
|||||
|
 | |
| |
| |
| |
| |
| |
|
Gene: CNGB1 |
Gene summary for CNGB1 |
| Gene information | Species | Human | Gene symbol | CNGB1 | Gene ID | 1258 |
| Gene name | cyclic nucleotide gated channel subunit beta 1 | |
| Gene Alias | CNCG2 | |
| Cytomap | 16q21 | |
| Gene Type | protein-coding | GO ID | GO:0001894 | UniProtAcc | Q14028 |
Top |
Malignant transformation analysis |
| Identification of the aberrant gene expression in precancerous and cancerous lesions by comparing the gene expression of stem-like cells in diseased tissues with normal stem cells |
| Entrez ID | Symbol | Replicates | Species | Organ | Tissue | Adj P-value | Log2FC | Malignancy |
| 1258 | CNGB1 | C04 | Human | Oral cavity | OSCC | 2.02e-04 | 2.00e-01 | 0.2633 |
| 1258 | CNGB1 | C21 | Human | Oral cavity | OSCC | 8.63e-03 | 1.16e-01 | 0.2678 |
| 1258 | CNGB1 | C51 | Human | Oral cavity | OSCC | 3.74e-18 | 6.08e-01 | 0.2674 |
| 1258 | CNGB1 | C06 | Human | Oral cavity | OSCC | 5.31e-08 | 1.03e+00 | 0.2699 |
| 1258 | CNGB1 | C09 | Human | Oral cavity | OSCC | 1.83e-17 | 4.24e-01 | 0.1431 |
| 1258 | CNGB1 | SYSMH3 | Human | Oral cavity | OSCC | 4.88e-03 | 1.59e-01 | 0.2442 |
| Page: 1 |
| Tissue | Expression Dynamics | Abbreviation |
| Oral Cavity | 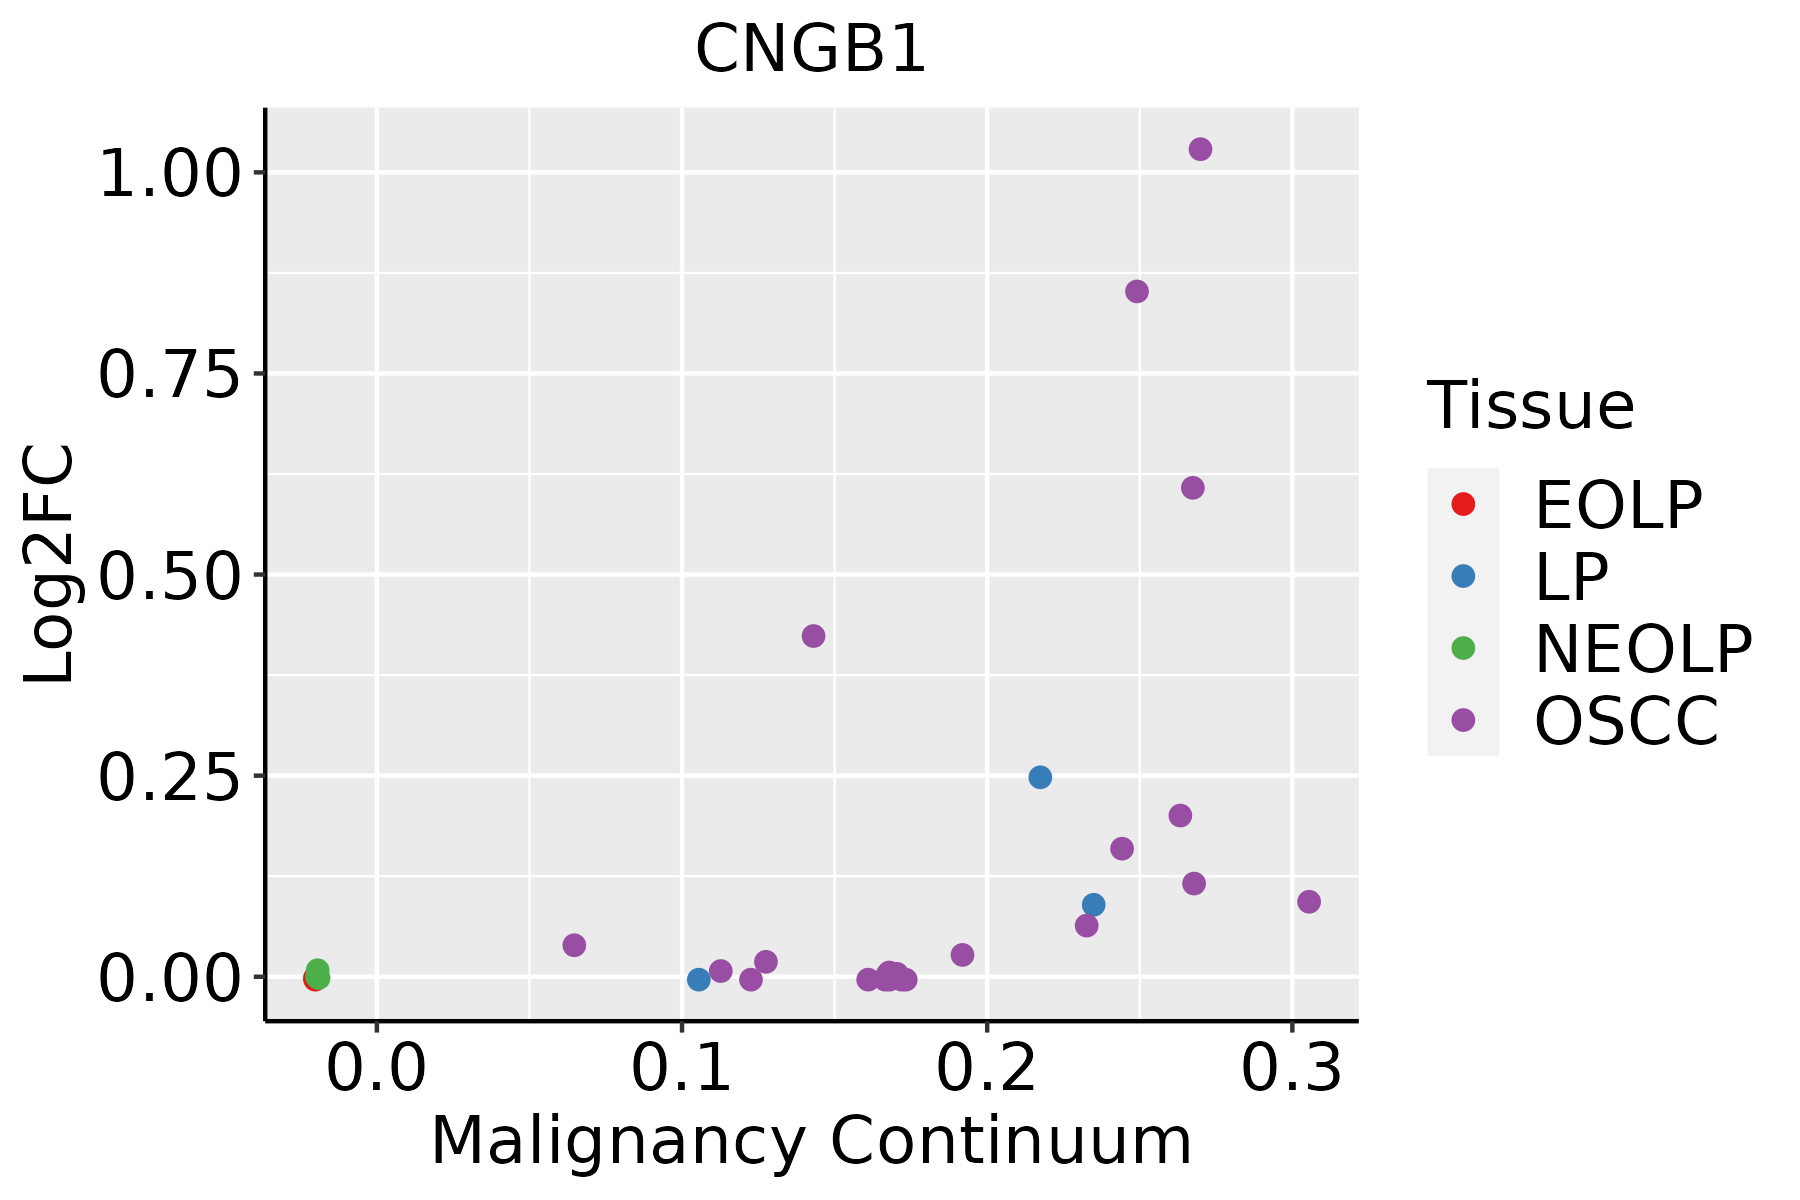 | EOLP: Erosive Oral lichen planus |
| LP: leukoplakia | ||
| NEOLP: Non-erosive oral lichen planus | ||
| OSCC: Oral squamous cell carcinoma |
| ∗log2FC in expression of this searched gene in stem-like cells from each diseased tissue sample relative to stem-like cells in normal samples in each tissue plotted against the malignancy continuum. Samples are colored based on if they are from different disease stage. |
Top |
Malignant transformation related pathway analysis |
| Find out the enriched GO biological processes and KEGG pathways involved in transition from healthy to precancer to cancer |
| Tissue | Disease Stage | Enriched GO biological Processes |
| Colorectum | AD |  |
| Colorectum | SER |  |
| Colorectum | MSS |  |
| Colorectum | MSI-H |  |
| Colorectum | FAP |  |
| ∗Top 15 enriched GO BP terms are showed in the bar plot of each disease state in each tissue. Each row represents a significant GO biological process which is colored according to the -log10(p.adjust). |
| Page: 1 2 3 4 5 6 7 8 9 |
| GO ID | Tissue | Disease Stage | Description | Gene Ratio | Bg Ratio | pvalue | p.adjust | Count |
| GO:000931416 | Oral cavity | OSCC | response to radiation | 241/7305 | 456/18723 | 9.76e-10 | 2.40e-08 | 241 |
| GO:00094164 | Oral cavity | OSCC | response to light stimulus | 159/7305 | 320/18723 | 5.98e-05 | 4.92e-04 | 159 |
| Page: 1 |
| Pathway ID | Tissue | Disease Stage | Description | Gene Ratio | Bg Ratio | pvalue | p.adjust | qvalue | Count |
| Page: 1 |
Top |
Cell-cell communication analysis |
| Identification of potential cell-cell interactions between two cell types and their ligand-receptor pairs for different disease states |
| Ligand | Receptor | LRpair | Pathway | Tissue | Disease Stage |
| Page: 1 |
Top |
Single-cell gene regulatory network inference analysis |
| Find out the significant the regulons (TFs) and the target genes of each regulon across cell types for different disease states |
| TF | Cell Type | Tissue | Disease Stage | Target Gene | RSS | Regulon Activity |
| ∗The dot plots of a searched regulon are shown for all cell subpopulations in each disease state of each tissue based on the regulon specific score inferred using pySCENIC and by calculating the average expression. |
| Page: 1 |
Top |
Somatic mutation of malignant transformation related genes |
| Annotation of somatic variants for genes involved in malignant transformation |
| Hugo Symbol | Variant Class | Variant Classification | dbSNP RS | HGVSc | HGVSp | HGVSp Short | SWISSPROT | BIOTYPE | SIFT | PolyPhen | Tumor Sample Barcode | Tissue | Histology | Sex | Age | Stage | Therapy Types | Drugs | Outcome |
| CNGB1 | SNV | Missense_Mutation | c.2797N>A | p.Glu933Lys | p.E933K | Q14028 | protein_coding | deleterious(0) | probably_damaging(0.912) | TCGA-AC-A23H-01 | Breast | breast invasive carcinoma | Female | >=65 | I/II | Unknown | Unknown | PD | |
| CNGB1 | SNV | Missense_Mutation | c.464G>A | p.Gly155Glu | p.G155E | Q14028 | protein_coding | deleterious_low_confidence(0.01) | benign(0.36) | TCGA-BH-A0C7-01 | Breast | breast invasive carcinoma | Female | <65 | I/II | Chemotherapy | adriamycin | CR | |
| CNGB1 | SNV | Missense_Mutation | novel | c.3131C>A | p.Ala1044Asp | p.A1044D | Q14028 | protein_coding | deleterious(0) | probably_damaging(1) | TCGA-D8-A27M-01 | Breast | breast invasive carcinoma | Female | <65 | I/II | Chemotherapy | methotrexate+5 | SD |
| CNGB1 | SNV | Missense_Mutation | c.547G>A | p.Glu183Lys | p.E183K | Q14028 | protein_coding | tolerated_low_confidence(0.07) | benign(0.014) | TCGA-E2-A10C-01 | Breast | breast invasive carcinoma | Female | <65 | I/II | Chemotherapy | cytoxan | SD | |
| CNGB1 | insertion | Frame_Shift_Ins | novel | c.2439_2440insAGAGCCACCATCCATTATGAGACTT | p.Ala814ArgfsTer46 | p.A814Rfs*46 | Q14028 | protein_coding | TCGA-A7-A0D9-01 | Breast | breast invasive carcinoma | Female | <65 | I/II | Chemotherapy | taxotere | SD | ||
| CNGB1 | insertion | In_Frame_Ins | novel | c.258_259insCTCATGAAGGGCGTAGAGAAGGTGATCCCGCAGCCTGTTCACAGCATC | p.Arg86_Ala87insLeuMetLysGlyValGluLysValIleProGlnProValHisSerIle | p.R86_A87insLMKGVEKVIPQPVHSI | Q14028 | protein_coding | TCGA-AN-A041-01 | Breast | breast invasive carcinoma | Female | <65 | I/II | Unknown | Unknown | SD | ||
| CNGB1 | insertion | Nonsense_Mutation | novel | c.2415_2416insAACCCCAGCACTTTGGGAGGCCAAGGCAGGCGGATCACCTGATATC | p.Ser806AsnfsTer14 | p.S806Nfs*14 | Q14028 | protein_coding | TCGA-AN-A04A-01 | Breast | breast invasive carcinoma | Female | <65 | III/IV | Unknown | Unknown | SD | ||
| CNGB1 | insertion | Frame_Shift_Ins | novel | c.428_429insTCAACTTCCCCTAGCT | p.Asn144GlnfsTer7 | p.N144Qfs*7 | Q14028 | protein_coding | TCGA-AO-A128-01 | Breast | breast invasive carcinoma | Female | <65 | I/II | Chemotherapy | doxorubicin | SD | ||
| CNGB1 | insertion | Frame_Shift_Ins | novel | c.600_601insTGTCTTCTCCTTTGTTTCAGGGGTGATGG | p.Gln201CysfsTer86 | p.Q201Cfs*86 | Q14028 | protein_coding | TCGA-BH-A0E7-01 | Breast | breast invasive carcinoma | Female | >=65 | I/II | Hormone Therapy | arimidex | SD | ||
| CNGB1 | insertion | Frame_Shift_Ins | novel | c.450_451insCGGGCATTTACTGAGTTCTGTTGCTTTGCATT | p.Asp151ArgfsTer137 | p.D151Rfs*137 | Q14028 | protein_coding | TCGA-BH-A0EE-01 | Breast | breast invasive carcinoma | Female | >=65 | I/II | Chemotherapy | docetaxel | SD |
| Page: 1 2 3 4 5 6 7 8 9 10 11 12 13 14 15 16 |
Top |
Related drugs of malignant transformation related genes |
| Identification of chemicals and drugs interact with genes involved in malignant transfromation |
| (DGIdb 4.0) |
| Entrez ID | Symbol | Category | Interaction Types | Drug Claim Name | Drug Name | PMIDs |
| Page: 1 |

Copyright 2023-Present -The University of Texas Health Science Center at Houston |