
|
|||||
|
 | |
| |
| |
| |
| |
| |
|
Gene: CNFN |
Gene summary for CNFN |
| Gene information | Species | Human | Gene symbol | CNFN | Gene ID | 84518 |
| Gene name | cornifelin | |
| Gene Alias | PLAC8L2 | |
| Cytomap | 19q13.2 | |
| Gene Type | protein-coding | GO ID | GO:0007275 | UniProtAcc | Q9BYD5 |
Top |
Malignant transformation analysis |
| Identification of the aberrant gene expression in precancerous and cancerous lesions by comparing the gene expression of stem-like cells in diseased tissues with normal stem cells |
| Entrez ID | Symbol | Replicates | Species | Organ | Tissue | Adj P-value | Log2FC | Malignancy |
| 84518 | CNFN | GSM4909281 | Human | Breast | IDC | 9.99e-11 | 2.30e-01 | 0.21 |
| 84518 | CNFN | GSM4909287 | Human | Breast | IDC | 3.93e-14 | 5.40e-01 | 0.2057 |
| 84518 | CNFN | GSM4909298 | Human | Breast | IDC | 9.79e-07 | 1.71e-01 | 0.1551 |
| 84518 | CNFN | GSM4909299 | Human | Breast | IDC | 4.84e-08 | 2.46e-01 | 0.035 |
| 84518 | CNFN | GSM4909304 | Human | Breast | IDC | 2.48e-36 | 6.20e-01 | 0.1636 |
| 84518 | CNFN | GSM4909315 | Human | Breast | IDC | 2.27e-09 | 3.92e-01 | 0.21 |
| 84518 | CNFN | GSM4909316 | Human | Breast | IDC | 3.64e-03 | 3.84e-01 | 0.21 |
| 84518 | CNFN | GSM4909319 | Human | Breast | IDC | 2.06e-03 | -3.90e-02 | 0.1563 |
| 84518 | CNFN | DCIS2 | Human | Breast | DCIS | 1.22e-24 | 1.47e-02 | 0.0085 |
| 84518 | CNFN | LZE4T | Human | Esophagus | ESCC | 1.27e-07 | 5.23e-02 | 0.0811 |
| 84518 | CNFN | LZE5T | Human | Esophagus | ESCC | 1.02e-03 | 9.49e-01 | 0.0514 |
| 84518 | CNFN | LZE7T | Human | Esophagus | ESCC | 1.17e-03 | 2.01e-01 | 0.0667 |
| 84518 | CNFN | LZE24T | Human | Esophagus | ESCC | 3.04e-08 | 1.86e-01 | 0.0596 |
| 84518 | CNFN | P1T-E | Human | Esophagus | ESCC | 4.67e-05 | 1.98e-01 | 0.0875 |
| 84518 | CNFN | P2T-E | Human | Esophagus | ESCC | 4.86e-08 | 8.56e-02 | 0.1177 |
| 84518 | CNFN | P4T-E | Human | Esophagus | ESCC | 1.43e-13 | 3.04e-01 | 0.1323 |
| 84518 | CNFN | P5T-E | Human | Esophagus | ESCC | 2.15e-13 | 1.20e-01 | 0.1327 |
| 84518 | CNFN | P8T-E | Human | Esophagus | ESCC | 2.72e-45 | 1.04e+00 | 0.0889 |
| 84518 | CNFN | P9T-E | Human | Esophagus | ESCC | 1.08e-08 | 2.57e-01 | 0.1131 |
| 84518 | CNFN | P10T-E | Human | Esophagus | ESCC | 8.38e-80 | 1.54e+00 | 0.116 |
| Page: 1 2 3 4 5 |
| Tissue | Expression Dynamics | Abbreviation |
| Breast | 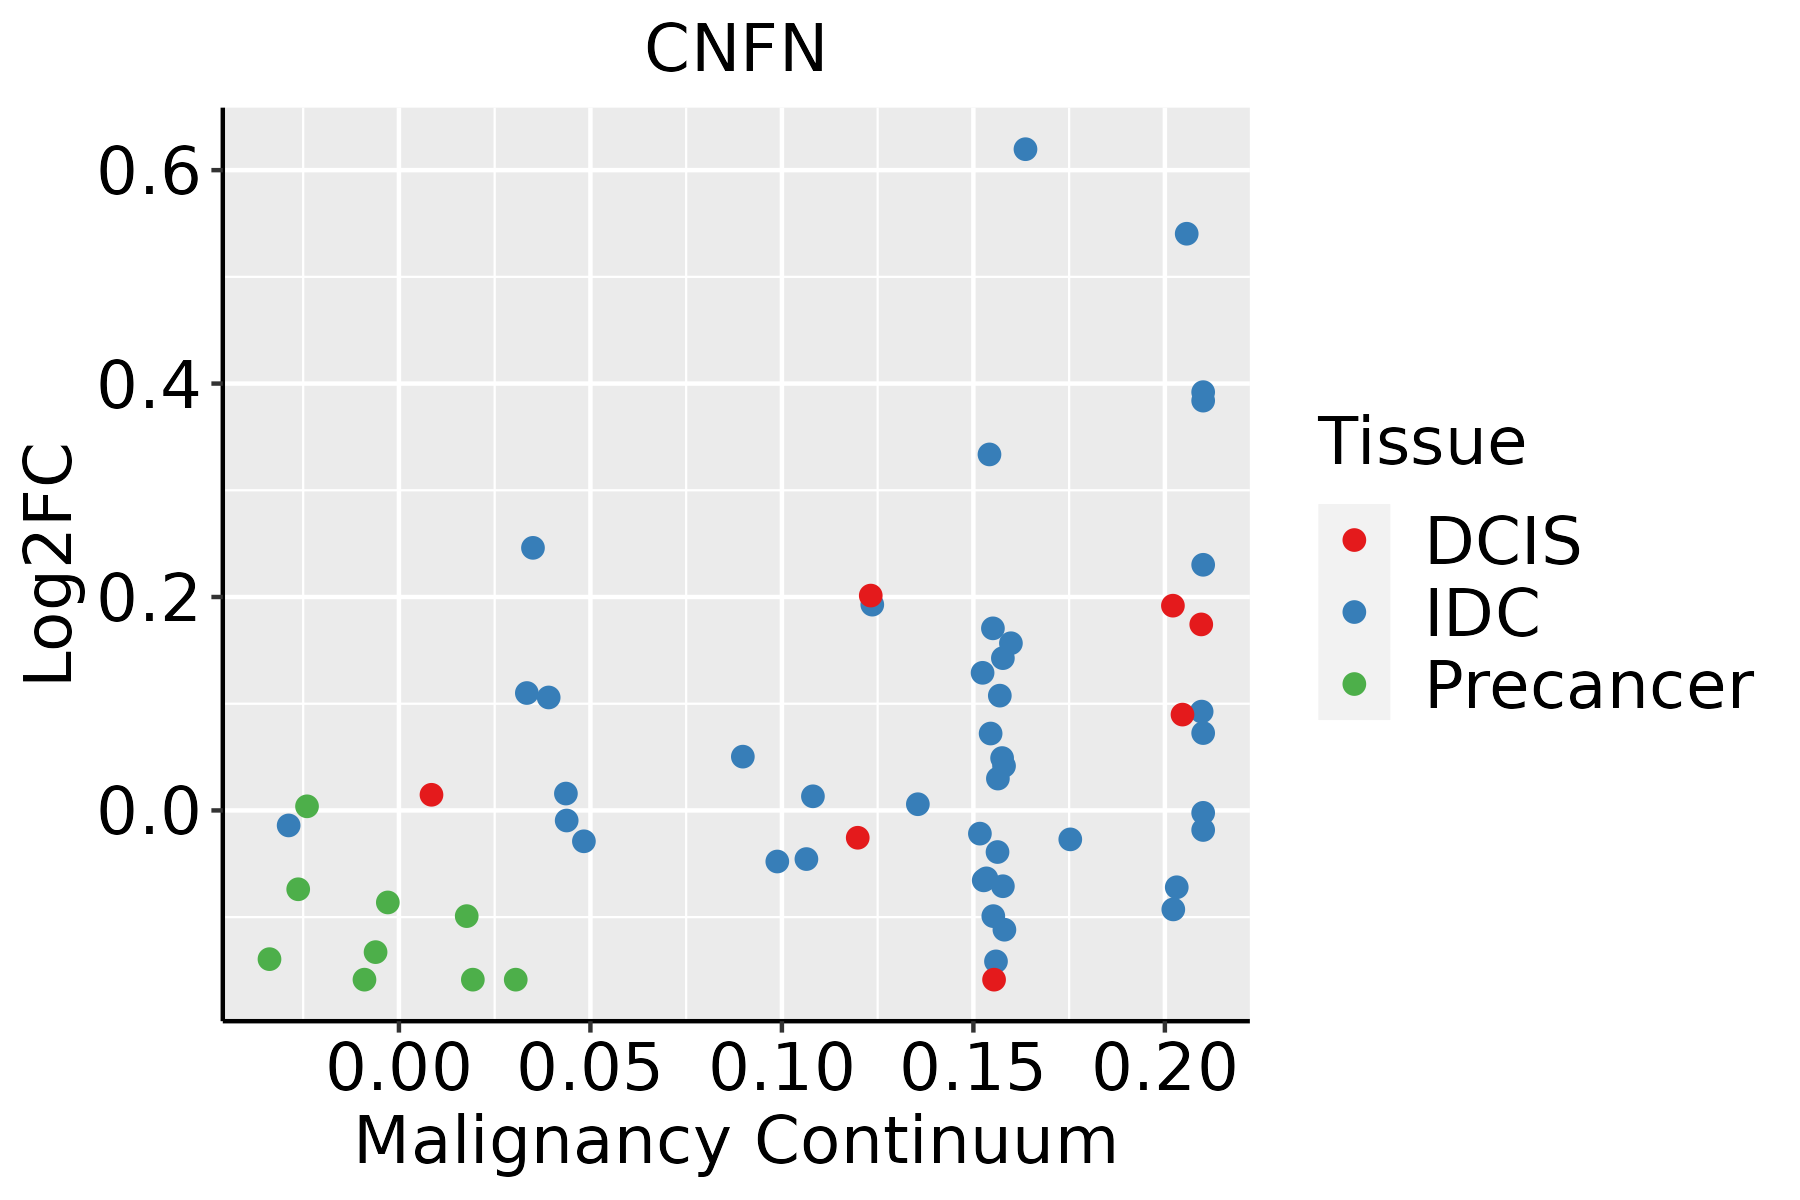 | IDC: Invasive ductal carcinoma |
| DCIS: Ductal carcinoma in situ | ||
| Precancer(BRCA1-mut): Precancerous lesion from BRCA1 mutation carriers | ||
| Esophagus | 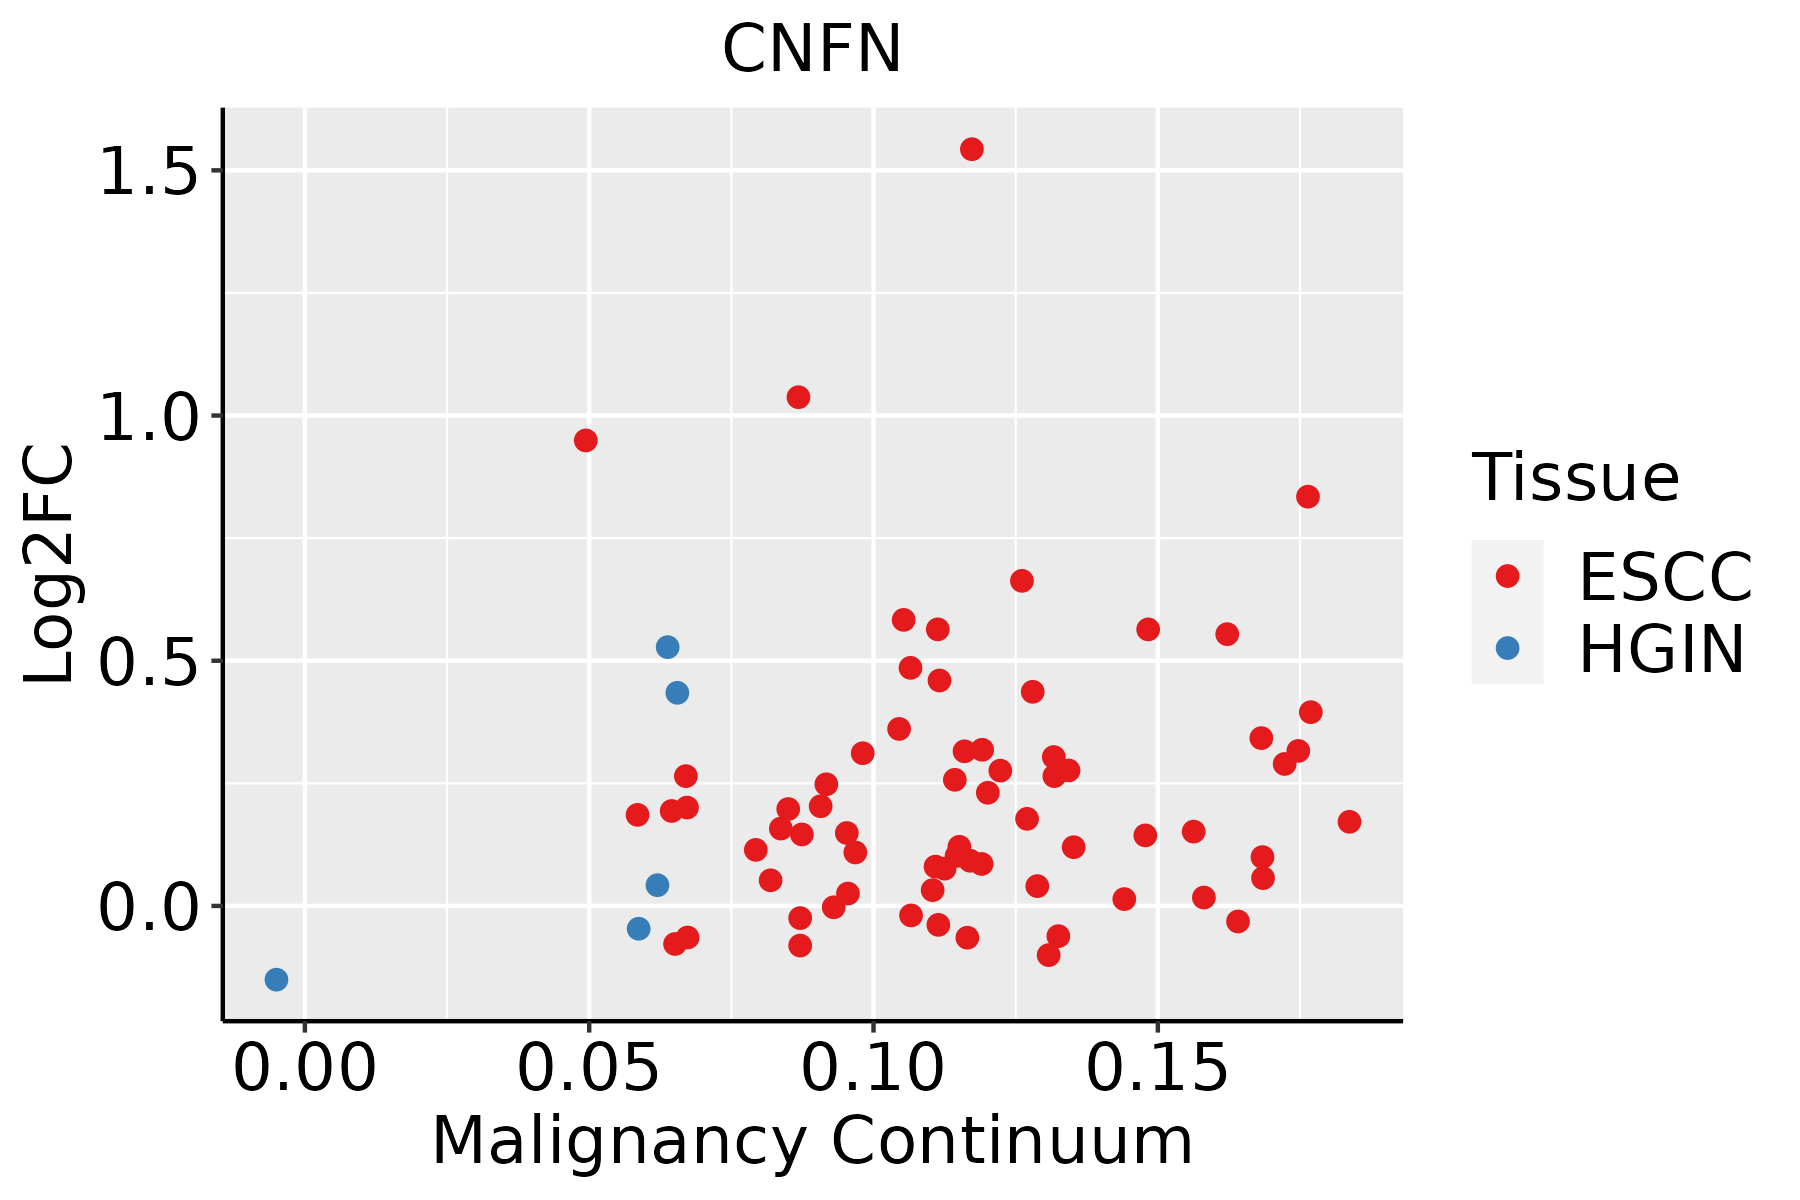 | ESCC: Esophageal squamous cell carcinoma |
| HGIN: High-grade intraepithelial neoplasias | ||
| LGIN: Low-grade intraepithelial neoplasias | ||
| Liver | 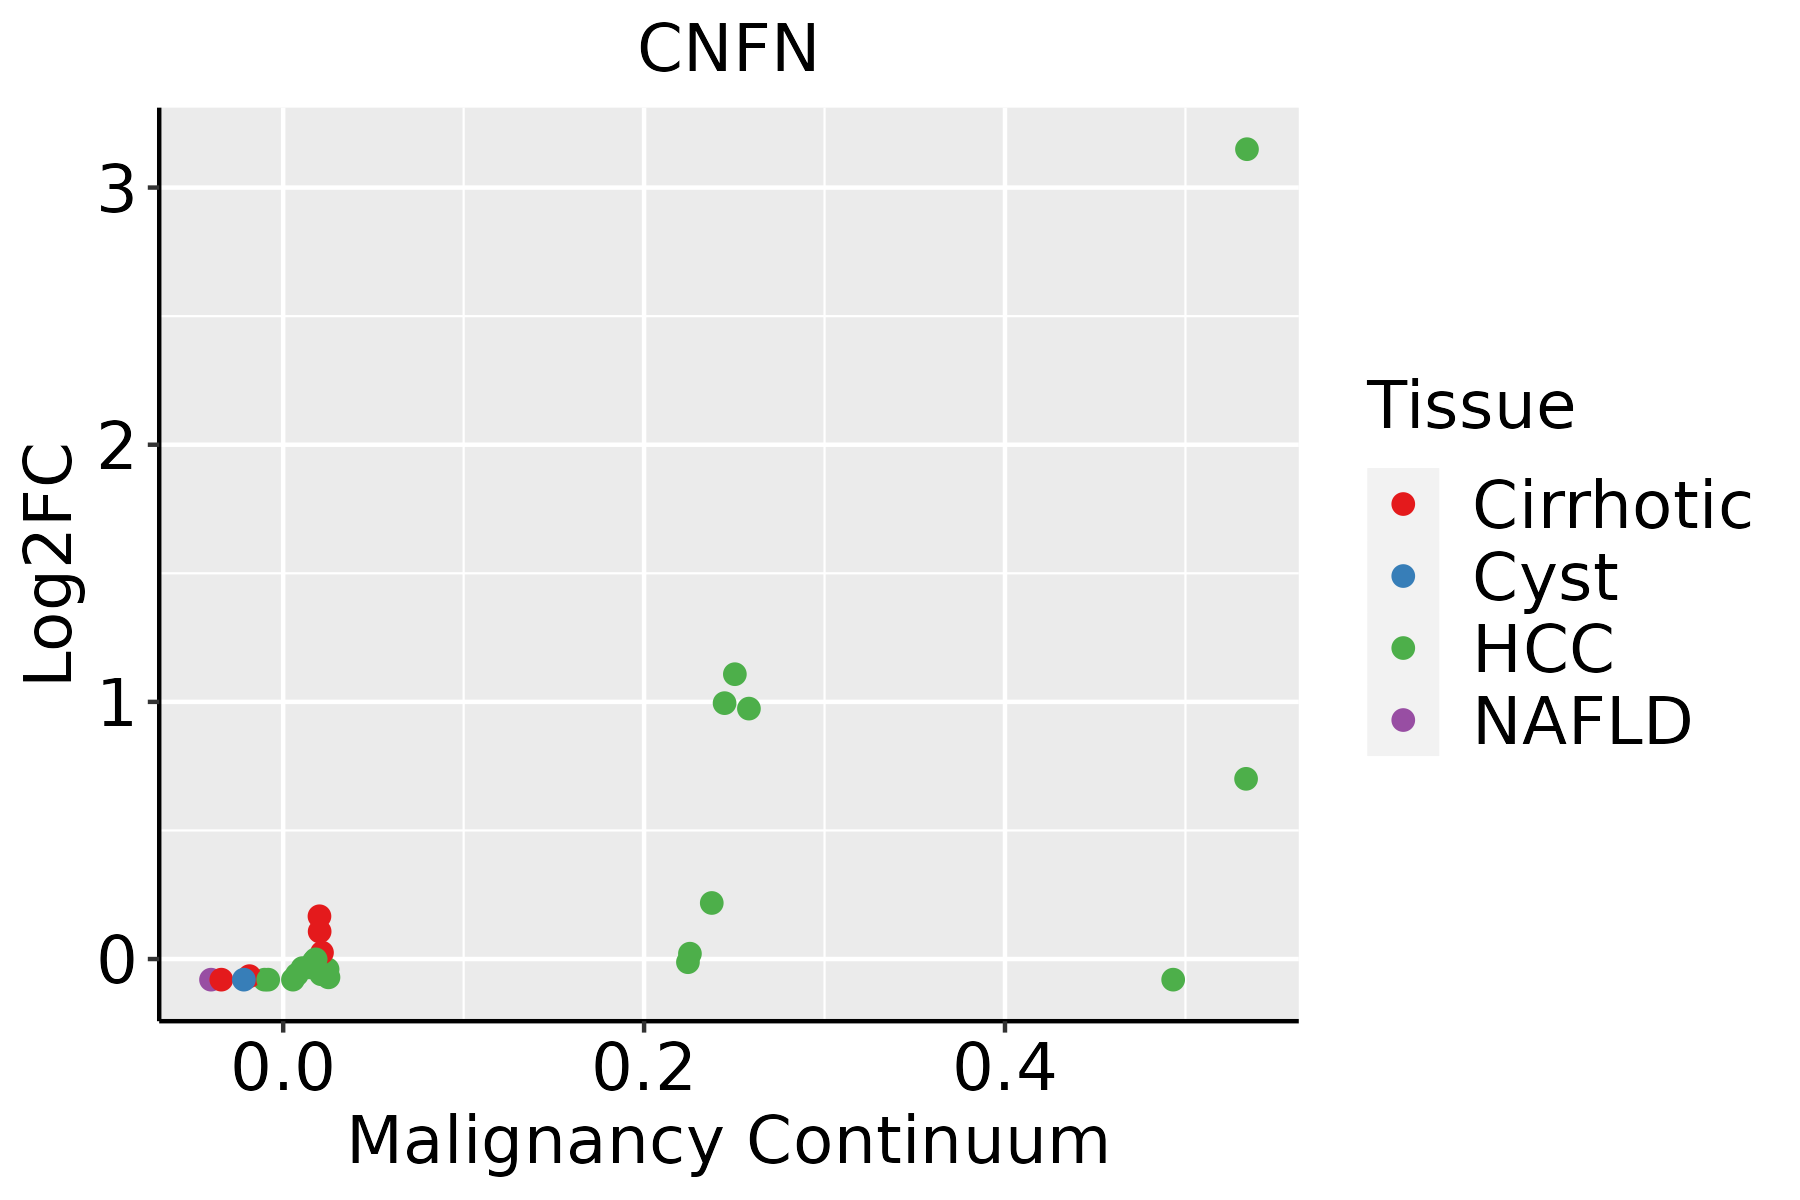 | HCC: Hepatocellular carcinoma |
| NAFLD: Non-alcoholic fatty liver disease | ||
| Oral Cavity |  | EOLP: Erosive Oral lichen planus |
| LP: leukoplakia | ||
| NEOLP: Non-erosive oral lichen planus | ||
| OSCC: Oral squamous cell carcinoma |
| ∗log2FC in expression of this searched gene in stem-like cells from each diseased tissue sample relative to stem-like cells in normal samples in each tissue plotted against the malignancy continuum. Samples are colored based on if they are from different disease stage. |
Top |
Malignant transformation related pathway analysis |
| Find out the enriched GO biological processes and KEGG pathways involved in transition from healthy to precancer to cancer |
| Tissue | Disease Stage | Enriched GO biological Processes |
| Colorectum | AD |  |
| Colorectum | SER |  |
| Colorectum | MSS |  |
| Colorectum | MSI-H |  |
| Colorectum | FAP |  |
| ∗Top 15 enriched GO BP terms are showed in the bar plot of each disease state in each tissue. Each row represents a significant GO biological process which is colored according to the -log10(p.adjust). |
| Page: 1 2 3 4 5 6 7 8 9 |
| GO ID | Tissue | Disease Stage | Description | Gene Ratio | Bg Ratio | pvalue | p.adjust | Count |
| GO:000854412 | Breast | IDC | epidermis development | 41/1434 | 324/18723 | 1.03e-03 | 1.14e-02 | 41 |
| GO:000991312 | Breast | IDC | epidermal cell differentiation | 28/1434 | 202/18723 | 1.62e-03 | 1.60e-02 | 28 |
| GO:00302161 | Breast | IDC | keratinocyte differentiation | 21/1434 | 139/18723 | 2.06e-03 | 1.95e-02 | 21 |
| GO:00435883 | Breast | IDC | skin development | 33/1434 | 263/18723 | 3.46e-03 | 2.87e-02 | 33 |
| GO:000854422 | Breast | DCIS | epidermis development | 40/1390 | 324/18723 | 1.05e-03 | 1.16e-02 | 40 |
| GO:000991322 | Breast | DCIS | epidermal cell differentiation | 27/1390 | 202/18723 | 2.11e-03 | 1.97e-02 | 27 |
| GO:00302162 | Breast | DCIS | keratinocyte differentiation | 20/1390 | 139/18723 | 3.24e-03 | 2.74e-02 | 20 |
| GO:004358812 | Breast | DCIS | skin development | 31/1390 | 263/18723 | 7.15e-03 | 4.85e-02 | 31 |
| GO:00435888 | Esophagus | ESCC | skin development | 163/8552 | 263/18723 | 6.48e-08 | 1.14e-06 | 163 |
| GO:000854410 | Esophagus | ESCC | epidermis development | 193/8552 | 324/18723 | 2.87e-07 | 4.19e-06 | 193 |
| GO:000991310 | Esophagus | ESCC | epidermal cell differentiation | 122/8552 | 202/18723 | 1.69e-05 | 1.51e-04 | 122 |
| GO:00302167 | Esophagus | ESCC | keratinocyte differentiation | 86/8552 | 139/18723 | 8.53e-05 | 6.19e-04 | 86 |
| GO:00435887 | Oral cavity | OSCC | skin development | 143/7305 | 263/18723 | 2.77e-07 | 4.27e-06 | 143 |
| GO:00085449 | Oral cavity | OSCC | epidermis development | 171/7305 | 324/18723 | 2.89e-07 | 4.43e-06 | 171 |
| GO:00302166 | Oral cavity | OSCC | keratinocyte differentiation | 81/7305 | 139/18723 | 3.16e-06 | 3.81e-05 | 81 |
| GO:00099139 | Oral cavity | OSCC | epidermal cell differentiation | 109/7305 | 202/18723 | 1.08e-05 | 1.14e-04 | 109 |
| GO:000854416 | Oral cavity | LP | epidermis development | 112/4623 | 324/18723 | 3.81e-05 | 5.61e-04 | 112 |
| GO:004358816 | Oral cavity | LP | skin development | 93/4623 | 263/18723 | 6.47e-05 | 8.70e-04 | 93 |
| GO:003021613 | Oral cavity | LP | keratinocyte differentiation | 51/4623 | 139/18723 | 1.05e-03 | 8.84e-03 | 51 |
| GO:000991315 | Oral cavity | LP | epidermal cell differentiation | 69/4623 | 202/18723 | 1.53e-03 | 1.19e-02 | 69 |
| Page: 1 |
| Pathway ID | Tissue | Disease Stage | Description | Gene Ratio | Bg Ratio | pvalue | p.adjust | qvalue | Count |
| Page: 1 |
Top |
Cell-cell communication analysis |
| Identification of potential cell-cell interactions between two cell types and their ligand-receptor pairs for different disease states |
| Ligand | Receptor | LRpair | Pathway | Tissue | Disease Stage |
| Page: 1 |
Top |
Single-cell gene regulatory network inference analysis |
| Find out the significant the regulons (TFs) and the target genes of each regulon across cell types for different disease states |
| TF | Cell Type | Tissue | Disease Stage | Target Gene | RSS | Regulon Activity |
| ∗The dot plots of a searched regulon are shown for all cell subpopulations in each disease state of each tissue based on the regulon specific score inferred using pySCENIC and by calculating the average expression. |
| Page: 1 |
Top |
Somatic mutation of malignant transformation related genes |
| Annotation of somatic variants for genes involved in malignant transformation |
| Hugo Symbol | Variant Class | Variant Classification | dbSNP RS | HGVSc | HGVSp | HGVSp Short | SWISSPROT | BIOTYPE | SIFT | PolyPhen | Tumor Sample Barcode | Tissue | Histology | Sex | Age | Stage | Therapy Types | Drugs | Outcome |
| CNFN | deletion | Frame_Shift_Del | novel | c.39delN | p.Thr14ProfsTer95 | p.T14Pfs*95 | Q9BYD5 | protein_coding | TCGA-D8-A27V-01 | Breast | breast invasive carcinoma | Female | <65 | I/II | Hormone Therapy | tamoxiphen | SD | ||
| CNFN | SNV | Missense_Mutation | c.45N>A | p.Ser15Arg | p.S15R | Q9BYD5 | protein_coding | tolerated(0.25) | benign(0) | TCGA-AA-3492-01 | Colorectum | colon adenocarcinoma | Female | >=65 | I/II | Unknown | Unknown | SD | |
| CNFN | SNV | Missense_Mutation | novel | c.100N>A | p.Asp34Asn | p.D34N | Q9BYD5 | protein_coding | deleterious(0.01) | possibly_damaging(0.822) | TCGA-EI-6917-01 | Colorectum | rectum adenocarcinoma | Male | <65 | III/IV | Chemotherapy | 5fluorouracil+oxaciplatina+l-folinian | SD |
| CNFN | SNV | Missense_Mutation | novel | c.292N>T | p.Pro98Ser | p.P98S | Q9BYD5 | protein_coding | deleterious(0.01) | probably_damaging(0.928) | TCGA-D1-A2G0-01 | Endometrium | uterine corpus endometrioid carcinoma | Female | >=65 | I/II | Unknown | Unknown | SD |
| CNFN | SNV | Missense_Mutation | novel | c.321N>C | p.Glu107Asp | p.E107D | Q9BYD5 | protein_coding | deleterious(0.03) | probably_damaging(0.987) | TCGA-EY-A1GD-01 | Endometrium | uterine corpus endometrioid carcinoma | Female | <65 | I/II | Unknown | Unknown | SD |
| CNFN | SNV | Missense_Mutation | c.271N>T | p.Ala91Ser | p.A91S | Q9BYD5 | protein_coding | tolerated(0.06) | possibly_damaging(0.75) | TCGA-60-2698-01 | Lung | lung squamous cell carcinoma | Male | <65 | I/II | Chemotherapy | mithramycin | PD | |
| CNFN | SNV | Missense_Mutation | novel | c.86C>T | p.Thr29Met | p.T29M | Q9BYD5 | protein_coding | tolerated(0.22) | benign(0.018) | TCGA-63-A5MM-01 | Lung | lung squamous cell carcinoma | Female | >=65 | I/II | Chemotherapy | cisplatin | PD |
| Page: 1 |
Top |
Related drugs of malignant transformation related genes |
| Identification of chemicals and drugs interact with genes involved in malignant transfromation |
| (DGIdb 4.0) |
| Entrez ID | Symbol | Category | Interaction Types | Drug Claim Name | Drug Name | PMIDs |
| Page: 1 |

Copyright 2023-Present -The University of Texas Health Science Center at Houston |