
|
|||||
|
 | |
| |
| |
| |
| |
| |
|
Gene: CNEP1R1 |
Gene summary for CNEP1R1 |
| Gene information | Species | Human | Gene symbol | CNEP1R1 | Gene ID | 255919 |
| Gene name | CTD nuclear envelope phosphatase 1 regulatory subunit 1 | |
| Gene Alias | C16orf69 | |
| Cytomap | 16q12.1 | |
| Gene Type | protein-coding | GO ID | GO:0006464 | UniProtAcc | B8YCP3 |
Top |
Malignant transformation analysis |
| Identification of the aberrant gene expression in precancerous and cancerous lesions by comparing the gene expression of stem-like cells in diseased tissues with normal stem cells |
| Entrez ID | Symbol | Replicates | Species | Organ | Tissue | Adj P-value | Log2FC | Malignancy |
| 255919 | CNEP1R1 | C21 | Human | Oral cavity | OSCC | 2.35e-22 | 5.32e-01 | 0.2678 |
| 255919 | CNEP1R1 | C30 | Human | Oral cavity | OSCC | 2.49e-09 | 5.02e-01 | 0.3055 |
| 255919 | CNEP1R1 | C51 | Human | Oral cavity | OSCC | 2.04e-04 | 2.11e-01 | 0.2674 |
| 255919 | CNEP1R1 | C57 | Human | Oral cavity | OSCC | 3.39e-03 | 1.40e-01 | 0.1679 |
| 255919 | CNEP1R1 | C06 | Human | Oral cavity | OSCC | 2.85e-02 | 4.66e-01 | 0.2699 |
| 255919 | CNEP1R1 | C08 | Human | Oral cavity | OSCC | 7.29e-03 | 1.15e-01 | 0.1919 |
| 255919 | CNEP1R1 | C09 | Human | Oral cavity | OSCC | 2.14e-03 | 1.11e-01 | 0.1431 |
| 255919 | CNEP1R1 | SYSMH2 | Human | Oral cavity | OSCC | 4.33e-04 | 9.57e-02 | 0.2326 |
| Page: 1 |
| Tissue | Expression Dynamics | Abbreviation |
| Oral Cavity | 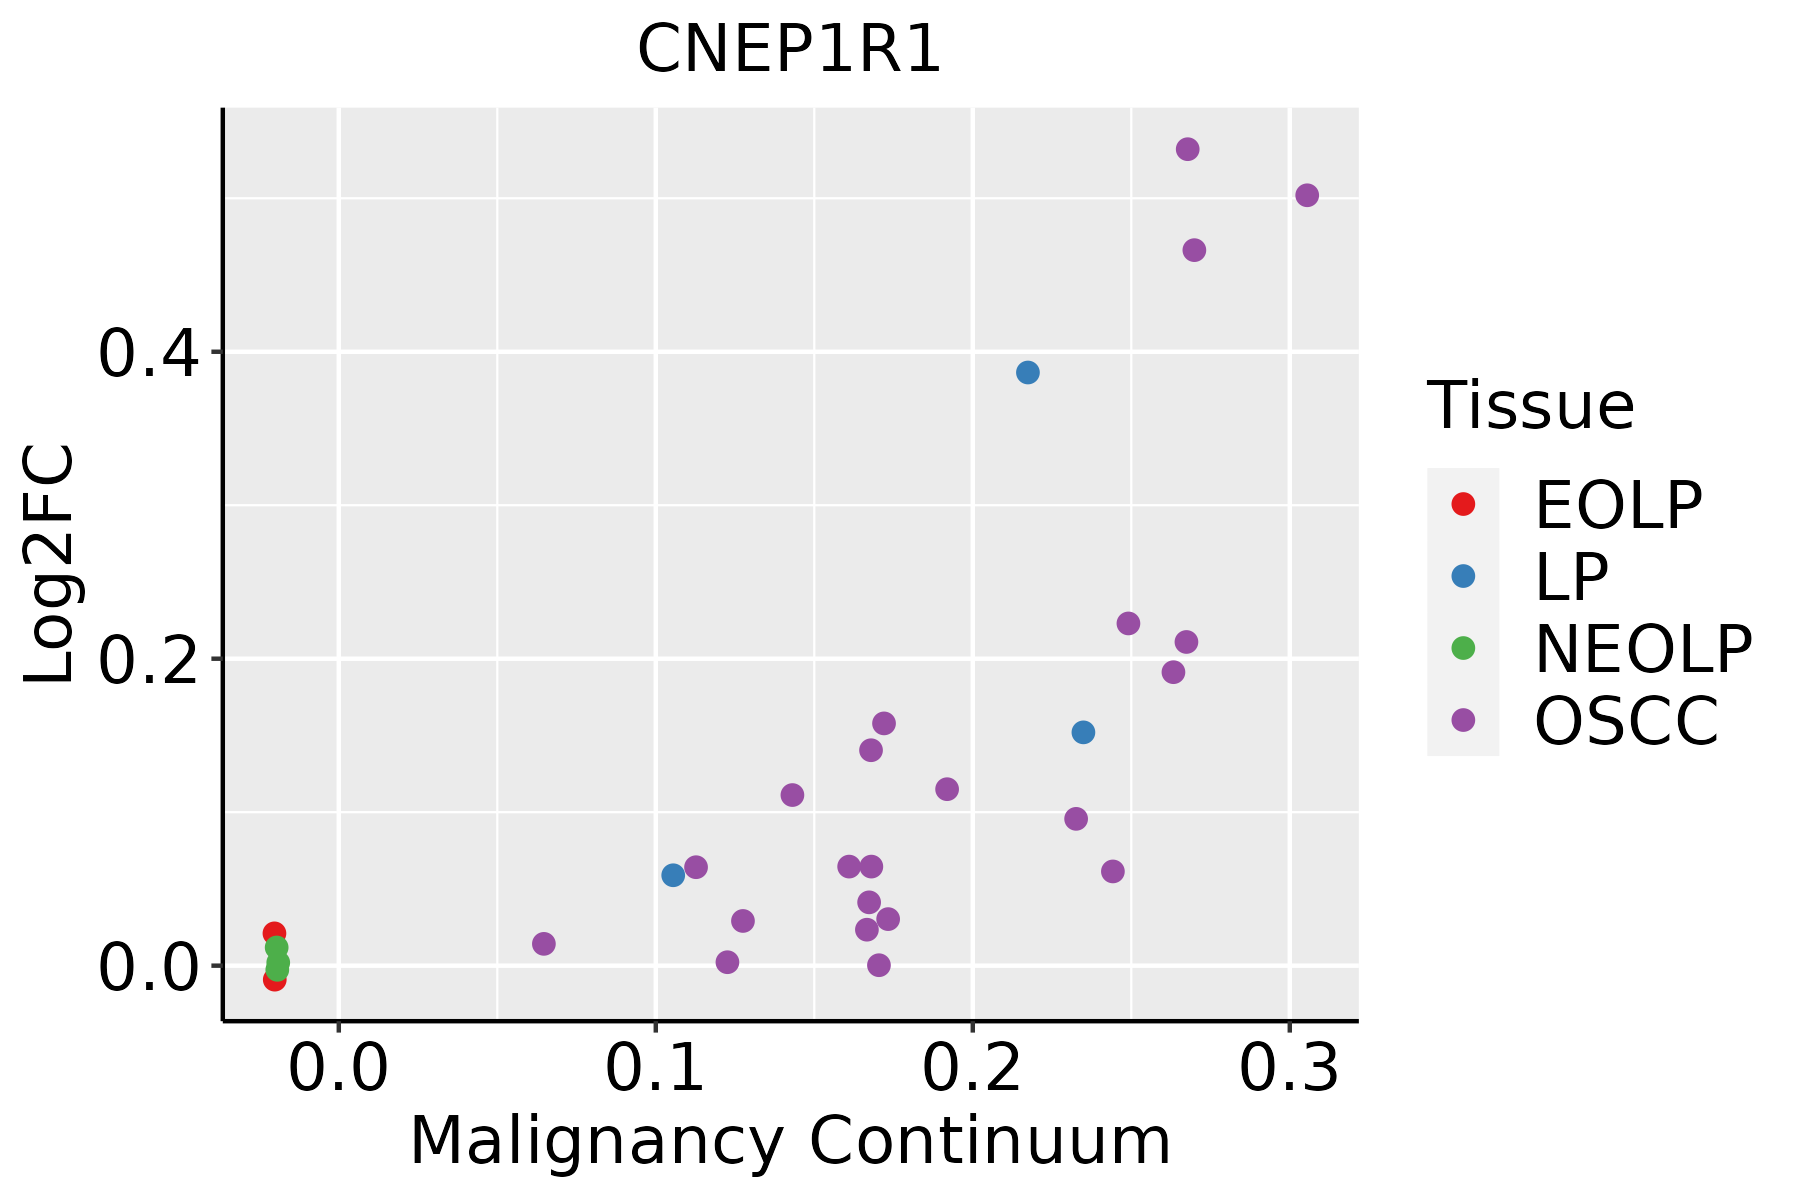 | EOLP: Erosive Oral lichen planus |
| LP: leukoplakia | ||
| NEOLP: Non-erosive oral lichen planus | ||
| OSCC: Oral squamous cell carcinoma |
| ∗log2FC in expression of this searched gene in stem-like cells from each diseased tissue sample relative to stem-like cells in normal samples in each tissue plotted against the malignancy continuum. Samples are colored based on if they are from different disease stage. |
Top |
Malignant transformation related pathway analysis |
| Find out the enriched GO biological processes and KEGG pathways involved in transition from healthy to precancer to cancer |
| Tissue | Disease Stage | Enriched GO biological Processes |
| Colorectum | AD |  |
| Colorectum | SER |  |
| Colorectum | MSS |  |
| Colorectum | MSI-H |  |
| Colorectum | FAP |  |
| ∗Top 15 enriched GO BP terms are showed in the bar plot of each disease state in each tissue. Each row represents a significant GO biological process which is colored according to the -log10(p.adjust). |
| Page: 1 2 3 4 5 6 7 8 9 |
| GO ID | Tissue | Disease Stage | Description | Gene Ratio | Bg Ratio | pvalue | p.adjust | Count |
| GO:003450415 | Oral cavity | OSCC | protein localization to nucleus | 193/7305 | 290/18723 | 1.22e-21 | 2.35e-19 | 193 |
| GO:000647015 | Oral cavity | OSCC | protein dephosphorylation | 162/7305 | 281/18723 | 1.56e-10 | 4.56e-09 | 162 |
| GO:00163119 | Oral cavity | OSCC | dephosphorylation | 220/7305 | 417/18723 | 6.33e-09 | 1.34e-07 | 220 |
| GO:003530319 | Oral cavity | OSCC | regulation of dephosphorylation | 80/7305 | 128/18723 | 6.10e-08 | 1.10e-06 | 80 |
| GO:003530420 | Oral cavity | OSCC | regulation of protein dephosphorylation | 60/7305 | 90/18723 | 9.75e-08 | 1.67e-06 | 60 |
| GO:00353073 | Oral cavity | OSCC | positive regulation of protein dephosphorylation | 29/7305 | 45/18723 | 4.85e-04 | 2.86e-03 | 29 |
| GO:00468906 | Oral cavity | OSCC | regulation of lipid biosynthetic process | 85/7305 | 171/18723 | 2.79e-03 | 1.21e-02 | 85 |
| GO:00353065 | Oral cavity | OSCC | positive regulation of dephosphorylation | 34/7305 | 59/18723 | 2.86e-03 | 1.24e-02 | 34 |
| GO:00192167 | Oral cavity | OSCC | regulation of lipid metabolic process | 154/7305 | 331/18723 | 3.00e-03 | 1.30e-02 | 154 |
| Page: 1 |
| Pathway ID | Tissue | Disease Stage | Description | Gene Ratio | Bg Ratio | pvalue | p.adjust | qvalue | Count |
| Page: 1 |
Top |
Cell-cell communication analysis |
| Identification of potential cell-cell interactions between two cell types and their ligand-receptor pairs for different disease states |
| Ligand | Receptor | LRpair | Pathway | Tissue | Disease Stage |
| Page: 1 |
Top |
Single-cell gene regulatory network inference analysis |
| Find out the significant the regulons (TFs) and the target genes of each regulon across cell types for different disease states |
| TF | Cell Type | Tissue | Disease Stage | Target Gene | RSS | Regulon Activity |
| ∗The dot plots of a searched regulon are shown for all cell subpopulations in each disease state of each tissue based on the regulon specific score inferred using pySCENIC and by calculating the average expression. |
| Page: 1 |
Top |
Somatic mutation of malignant transformation related genes |
| Annotation of somatic variants for genes involved in malignant transformation |
| Hugo Symbol | Variant Class | Variant Classification | dbSNP RS | HGVSc | HGVSp | HGVSp Short | SWISSPROT | BIOTYPE | SIFT | PolyPhen | Tumor Sample Barcode | Tissue | Histology | Sex | Age | Stage | Therapy Types | Drugs | Outcome |
| CNEP1R1 | SNV | Missense_Mutation | c.344G>A | p.Arg115Gln | p.R115Q | Q8N9A8 | protein_coding | tolerated(0.07) | possibly_damaging(0.797) | TCGA-AP-A1DV-01 | Endometrium | uterine corpus endometrioid carcinoma | Female | <65 | I/II | Unknown | Unknown | SD | |
| CNEP1R1 | SNV | Missense_Mutation | novel | c.217N>G | p.Gln73Glu | p.Q73E | Q8N9A8 | protein_coding | tolerated(0.73) | benign(0.053) | TCGA-AX-A1CE-01 | Endometrium | uterine corpus endometrioid carcinoma | Female | <65 | I/II | Unspecific | Paclitaxel | SD |
| CNEP1R1 | SNV | Missense_Mutation | c.344N>A | p.Arg115Gln | p.R115Q | Q8N9A8 | protein_coding | tolerated(0.07) | possibly_damaging(0.797) | TCGA-B5-A11U-01 | Endometrium | uterine corpus endometrioid carcinoma | Female | >=65 | III/IV | Unknown | Unknown | SD | |
| CNEP1R1 | SNV | Missense_Mutation | novel | c.325N>T | p.Pro109Ser | p.P109S | Q8N9A8 | protein_coding | deleterious(0.05) | probably_damaging(0.998) | TCGA-B5-A3FA-01 | Endometrium | uterine corpus endometrioid carcinoma | Female | >=65 | I/II | Unknown | Unknown | SD |
| CNEP1R1 | SNV | Missense_Mutation | novel | c.305T>A | p.Ile102Lys | p.I102K | Q8N9A8 | protein_coding | deleterious(0) | probably_damaging(0.974) | TCGA-EC-A1QX-01 | Endometrium | uterine corpus endometrioid carcinoma | Female | >=65 | I/II | Chemotherapy | cyclophosphamide | PD |
| CNEP1R1 | SNV | Missense_Mutation | novel | c.65N>A | p.Gly22Asp | p.G22D | Q8N9A8 | protein_coding | tolerated(0.63) | benign(0.023) | TCGA-69-8255-01 | Lung | lung adenocarcinoma | Male | >=65 | I/II | Unknown | Unknown | SD |
| CNEP1R1 | SNV | Missense_Mutation | novel | c.62C>T | p.Ser21Phe | p.S21F | Q8N9A8 | protein_coding | tolerated(0.11) | benign(0) | TCGA-75-5122-01 | Lung | lung adenocarcinoma | Male | Unknown | I/II | Unknown | Unknown | PD |
| Page: 1 |
Top |
Related drugs of malignant transformation related genes |
| Identification of chemicals and drugs interact with genes involved in malignant transfromation |
| (DGIdb 4.0) |
| Entrez ID | Symbol | Category | Interaction Types | Drug Claim Name | Drug Name | PMIDs |
| Page: 1 |

Copyright 2023-Present -The University of Texas Health Science Center at Houston |