Schematic overview of the cellular and molecular mechanisms involved in the cancer progression, including the proposed cellular and molecular mechanisms in cancer cells trajectory. AT1: alveolar type 1 cells; AT2: alveolar type 2 cells; AAH: atypical adenomatous hyperplasia; AIS: adenocarcinoma in situ; MIA: minimally invasive adenocarcinoma; IA: invasive adenocarcinoma; EMT: epithelial-mesenchymal transition

Home

Download

Statistics

Help

Contact

Center for Computational Systems Medicine
leaf

Gene summary

leaf

Malignant transformation analysis

leaf

Malignant transformation related pathway analysis

leaf

Cell-cell communication analysis

leaf

Single-cell gene regulatory network inference analysis

leaf

Somatic mutation of malignant transformation related genes

leaf

Related drugs of malignant transformation related genes

Gene: CNDP2

Gene summary for CNDP2

check button Gene summary.

Gene informationSpeciesHuman
Gene symbol

CNDP2

Gene ID

55748

Gene namecarnosine dipeptidase 2
Gene AliasCN2
Cytomap18q22.3
Gene Typeprotein-coding
GO ID

GO:0006508

UniProtAcc

Q96KP4


Top

Malignant transformation analysis

check button Identification of the aberrant gene expression in precancerous and cancerous lesions by comparing the gene expression of stem-like cells in diseased tissues with normal stem cells
check button Malignant transformation involving gene list.
Entrez IDSymbolReplicatesSpeciesOrganTissueAdj P-valueLog2FCMalignancy
55748CNDP2GSM4909281HumanBreastIDC2.55e-043.34e-010.21
55748CNDP2GSM4909294HumanBreastIDC6.73e-03-1.60e-010.2022
55748CNDP2GSM4909296HumanBreastIDC3.14e-02-6.52e-020.1524
55748CNDP2GSM4909297HumanBreastIDC1.56e-03-3.97e-020.1517
55748CNDP2GSM4909311HumanBreastIDC2.33e-17-7.54e-020.1534
55748CNDP2GSM4909312HumanBreastIDC7.30e-072.58e-020.1552
55748CNDP2GSM4909319HumanBreastIDC4.68e-19-1.90e-010.1563
55748CNDP2GSM4909321HumanBreastIDC1.10e-06-6.32e-020.1559
55748CNDP2brca2HumanBreastPrecancer6.79e-052.49e-01-0.024
55748CNDP2brca3HumanBreastPrecancer8.07e-062.91e-01-0.0263
55748CNDP2NCCBC11HumanBreastDCIS3.29e-065.37e-010.1232
55748CNDP2NCCBC3HumanBreastDCIS5.65e-031.70e-010.1198
55748CNDP2NCCBC6HumanBreastDCIS4.66e-118.72e-010.2095
55748CNDP2P1HumanBreastIDC6.09e-04-4.29e-020.1527
55748CNDP2DCIS2HumanBreastDCIS1.67e-469.14e-020.0085
55748CNDP2HTA11_3410_2000001011HumanColorectumAD2.19e-054.18e-010.0155
55748CNDP2HTA11_2487_2000001011HumanColorectumSER3.40e-034.20e-01-0.1808
55748CNDP2HTA11_1938_2000001011HumanColorectumAD7.61e-158.73e-01-0.0811
55748CNDP2HTA11_78_2000001011HumanColorectumAD4.80e-056.00e-01-0.1088
55748CNDP2HTA11_347_2000001011HumanColorectumAD3.16e-237.91e-01-0.1954
Page: 1 2 3 4 5 6 7 8 9 

check button Transcriptomic changes along malignancy continuum.
TissueExpression DynamicsAbbreviation
BreastThe image shows the transcriptomic changes along malignancy continuum.log2FC in expression of this searched gene in stem-like cells from each diseased tissue sample relative to stem-like cells in normal samples in each tissue plotted against the malignancy continuum. Samples are colored based on if they are from different disease stage.
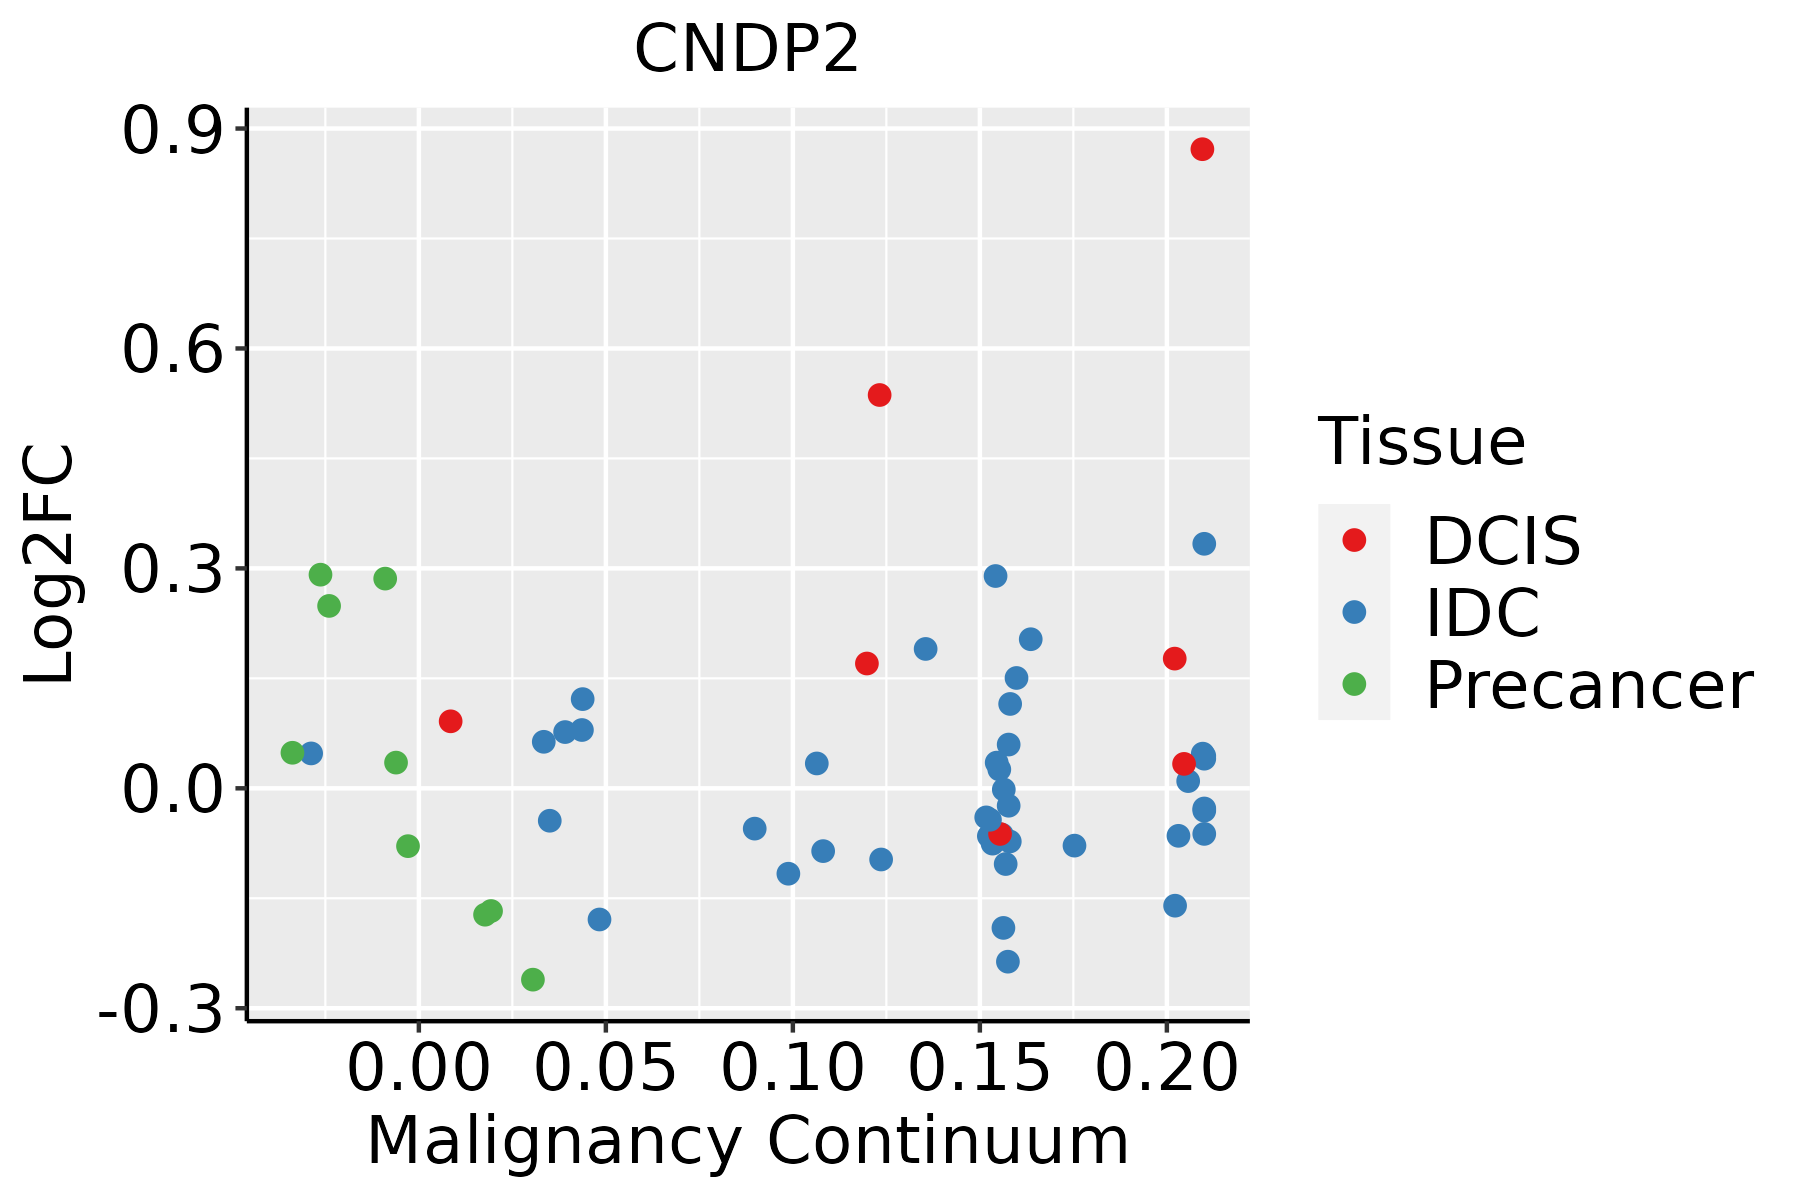
IDC: Invasive ductal carcinoma
DCIS: Ductal carcinoma in situ
Precancer(BRCA1-mut): Precancerous lesion from BRCA1 mutation carriers
Colorectum (GSE201348)The image shows the transcriptomic changes along malignancy continuum.log2FC in expression of this searched gene in stem-like cells from each diseased tissue sample relative to stem-like cells in normal samples in each tissue plotted against the malignancy continuum. Samples are colored based on if they are from different disease stage.FAP: Familial adenomatous polyposis
CRC: Colorectal cancer
Colorectum (HTA11)The image shows the transcriptomic changes along malignancy continuum.log2FC in expression of this searched gene in stem-like cells from each diseased tissue sample relative to stem-like cells in normal samples in each tissue plotted against the malignancy continuum. Samples are colored based on if they are from different disease stage.AD: Adenomas
SER: Sessile serrated lesions
MSI-H: Microsatellite-high colorectal cancer
MSS: Microsatellite stable colorectal cancer
EndometriumThe image shows the transcriptomic changes along malignancy continuum.log2FC in expression of this searched gene in stem-like cells from each diseased tissue sample relative to stem-like cells in normal samples in each tissue plotted against the malignancy continuum. Samples are colored based on if they are from different disease stage.
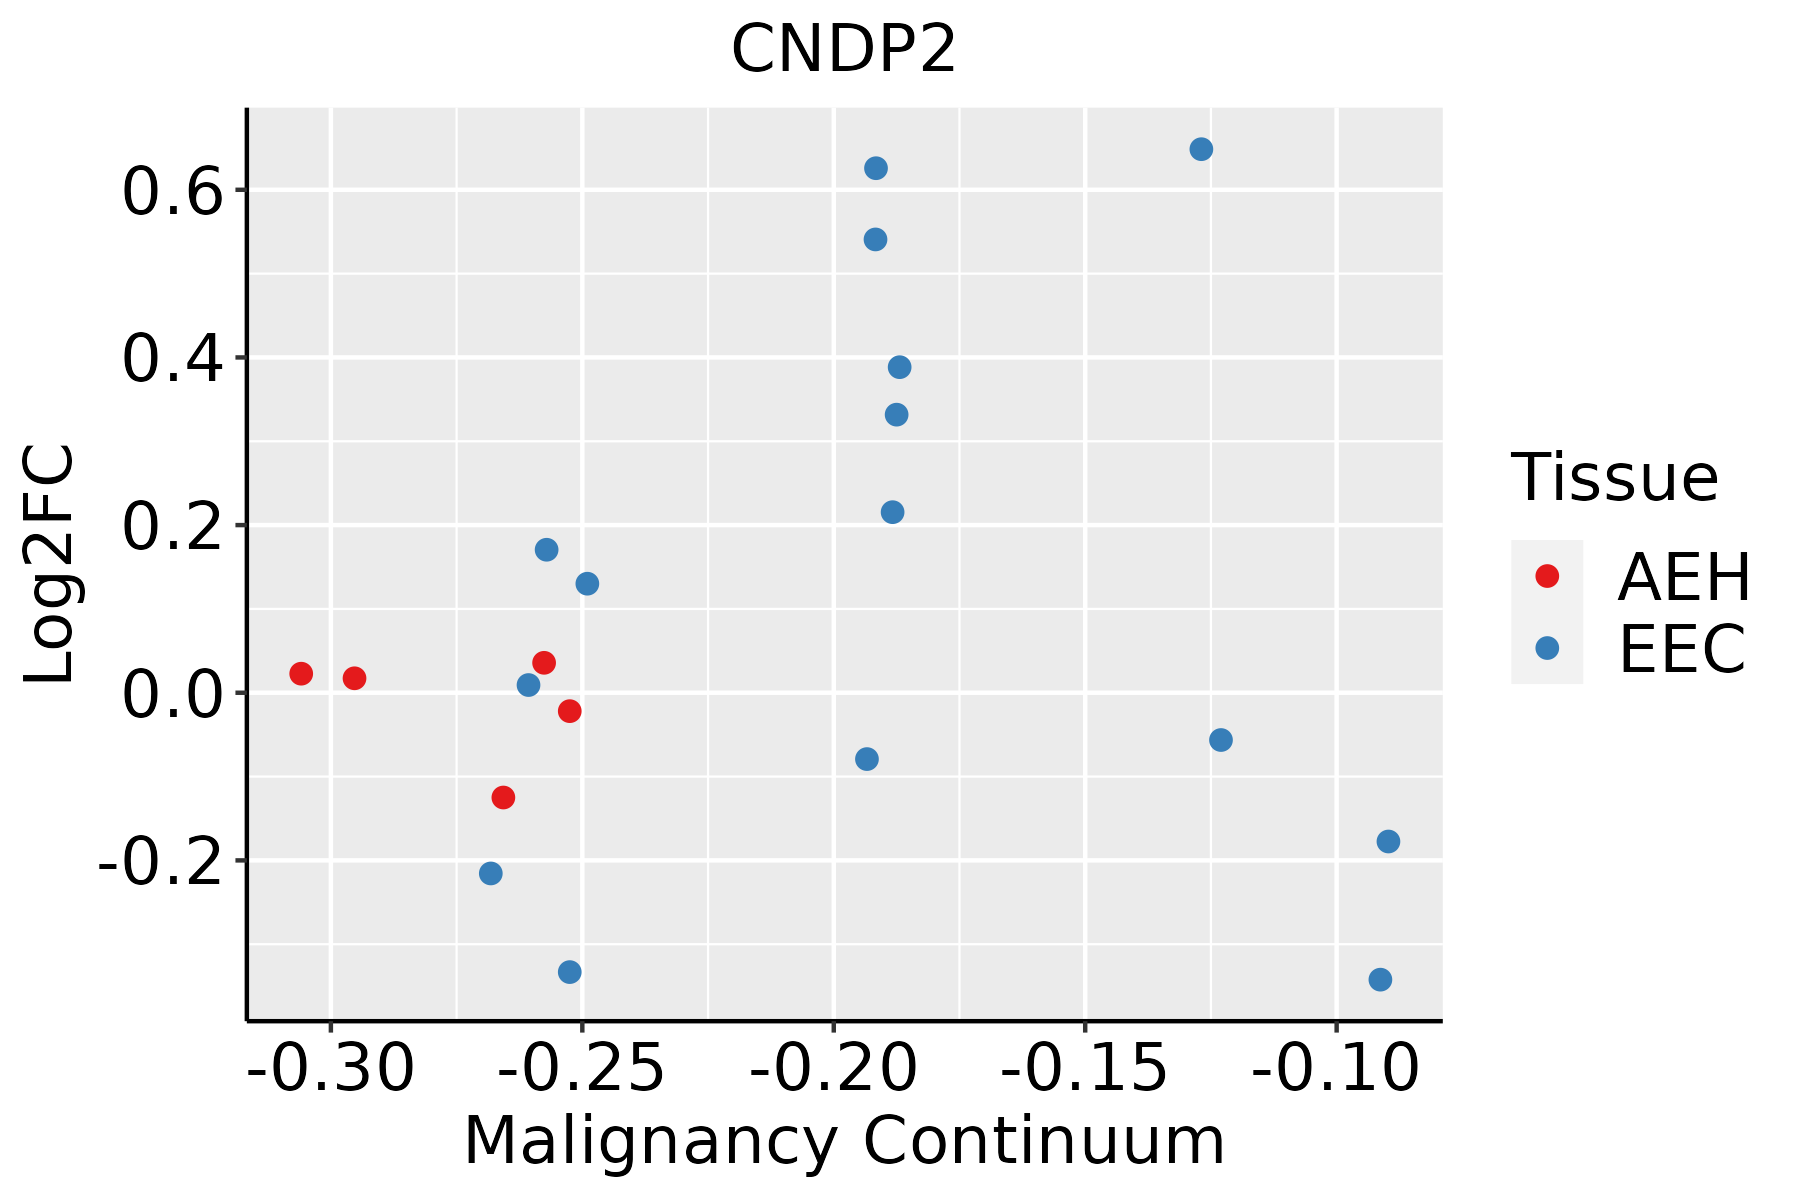
AEH: Atypical endometrial hyperplasia
EEC: Endometrioid Cancer
EsophagusThe image shows the transcriptomic changes along malignancy continuum.log2FC in expression of this searched gene in stem-like cells from each diseased tissue sample relative to stem-like cells in normal samples in each tissue plotted against the malignancy continuum. Samples are colored based on if they are from different disease stage.
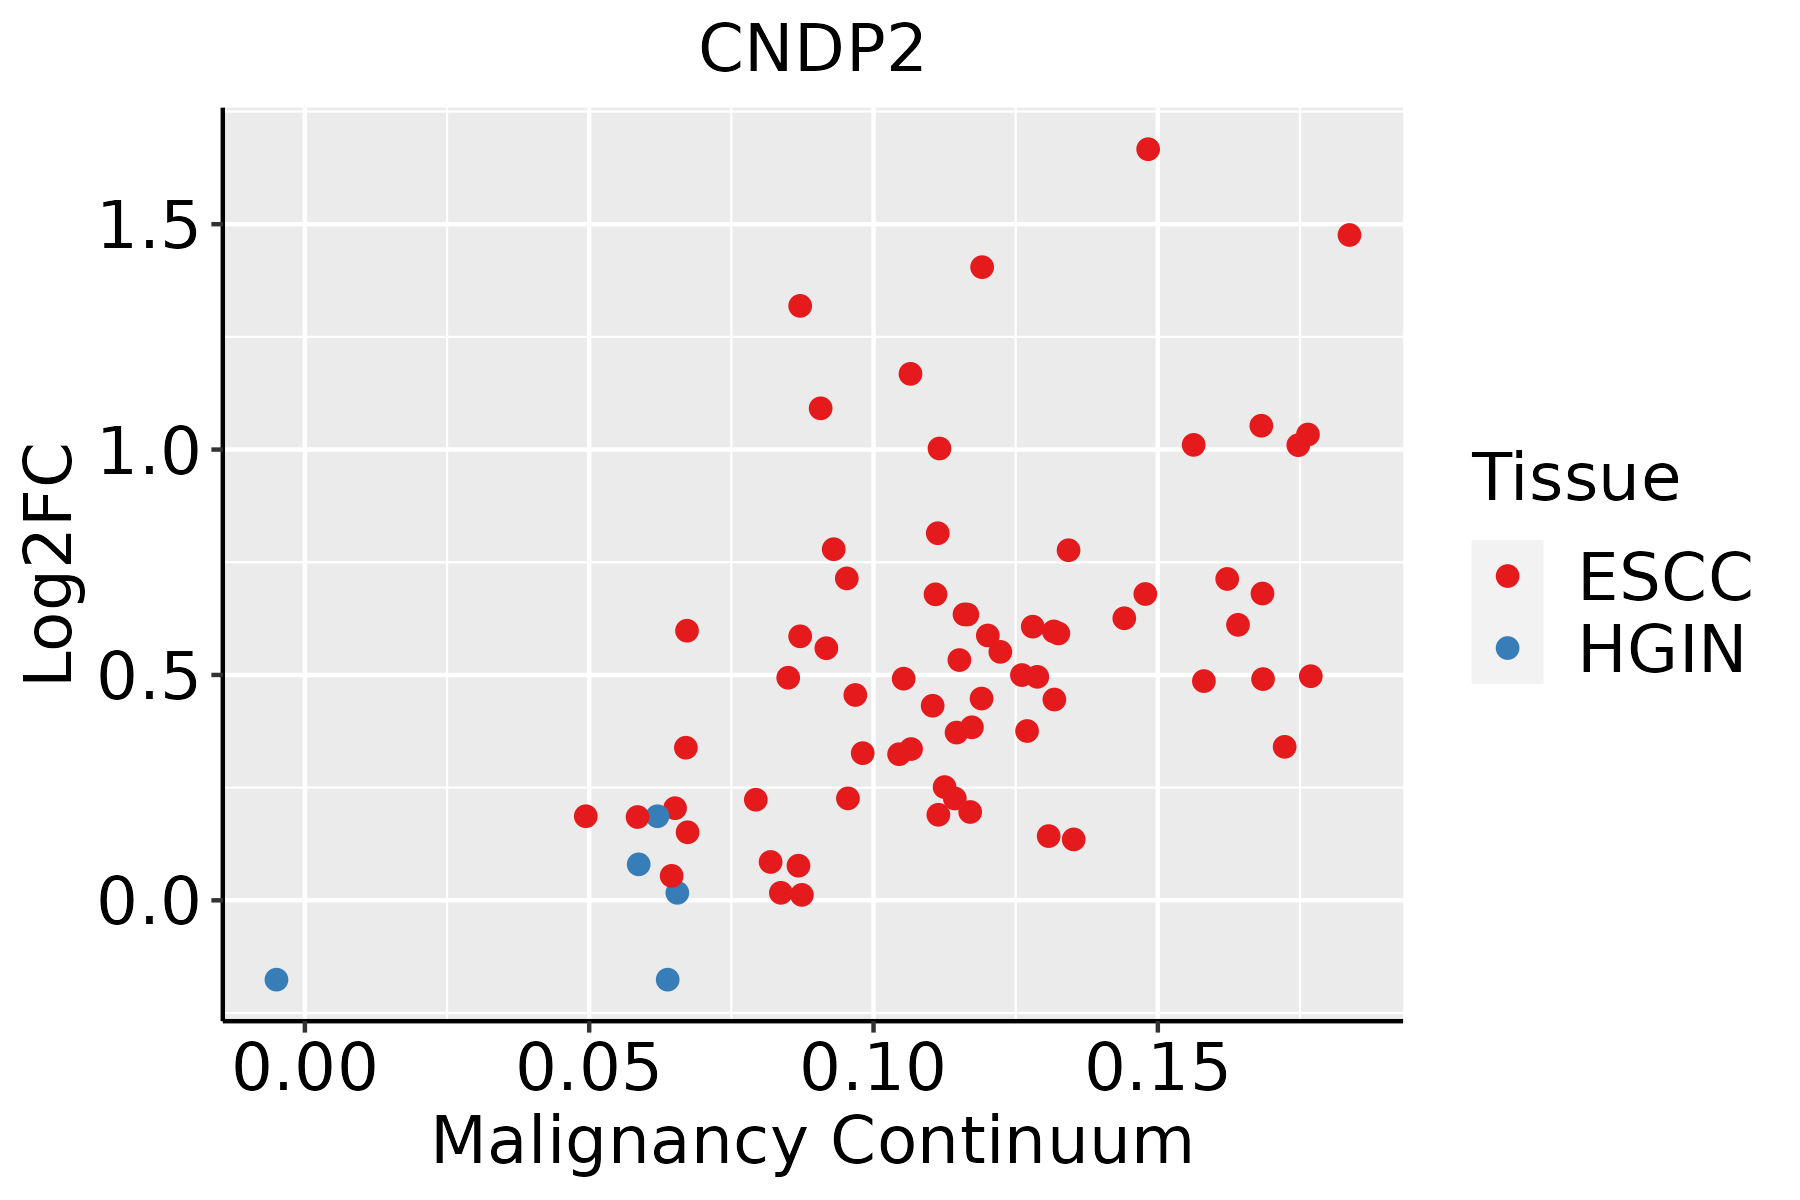
ESCC: Esophageal squamous cell carcinoma
HGIN: High-grade intraepithelial neoplasias
LGIN: Low-grade intraepithelial neoplasias
LiverThe image shows the transcriptomic changes along malignancy continuum.log2FC in expression of this searched gene in stem-like cells from each diseased tissue sample relative to stem-like cells in normal samples in each tissue plotted against the malignancy continuum. Samples are colored based on if they are from different disease stage.
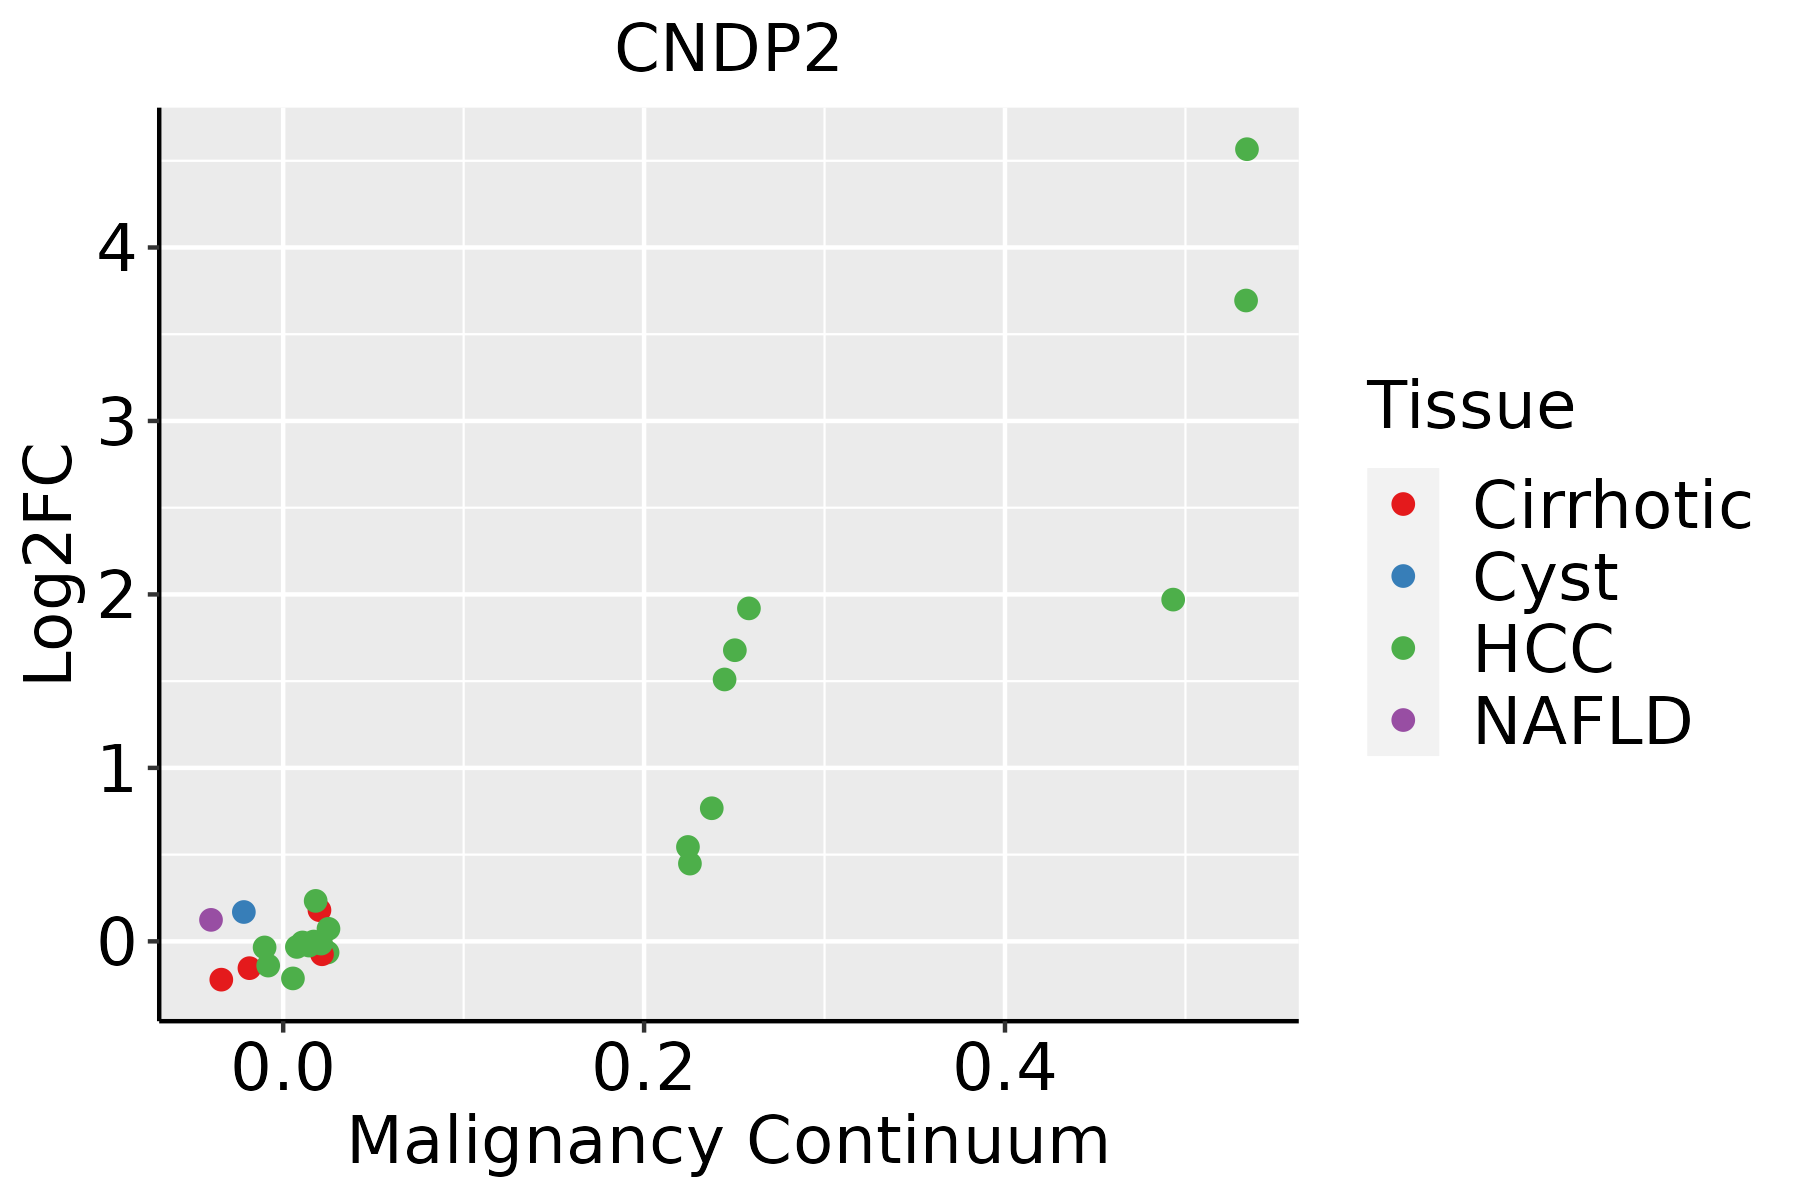
HCC: Hepatocellular carcinoma
NAFLD: Non-alcoholic fatty liver disease
Oral CavityThe image shows the transcriptomic changes along malignancy continuum.log2FC in expression of this searched gene in stem-like cells from each diseased tissue sample relative to stem-like cells in normal samples in each tissue plotted against the malignancy continuum. Samples are colored based on if they are from different disease stage.
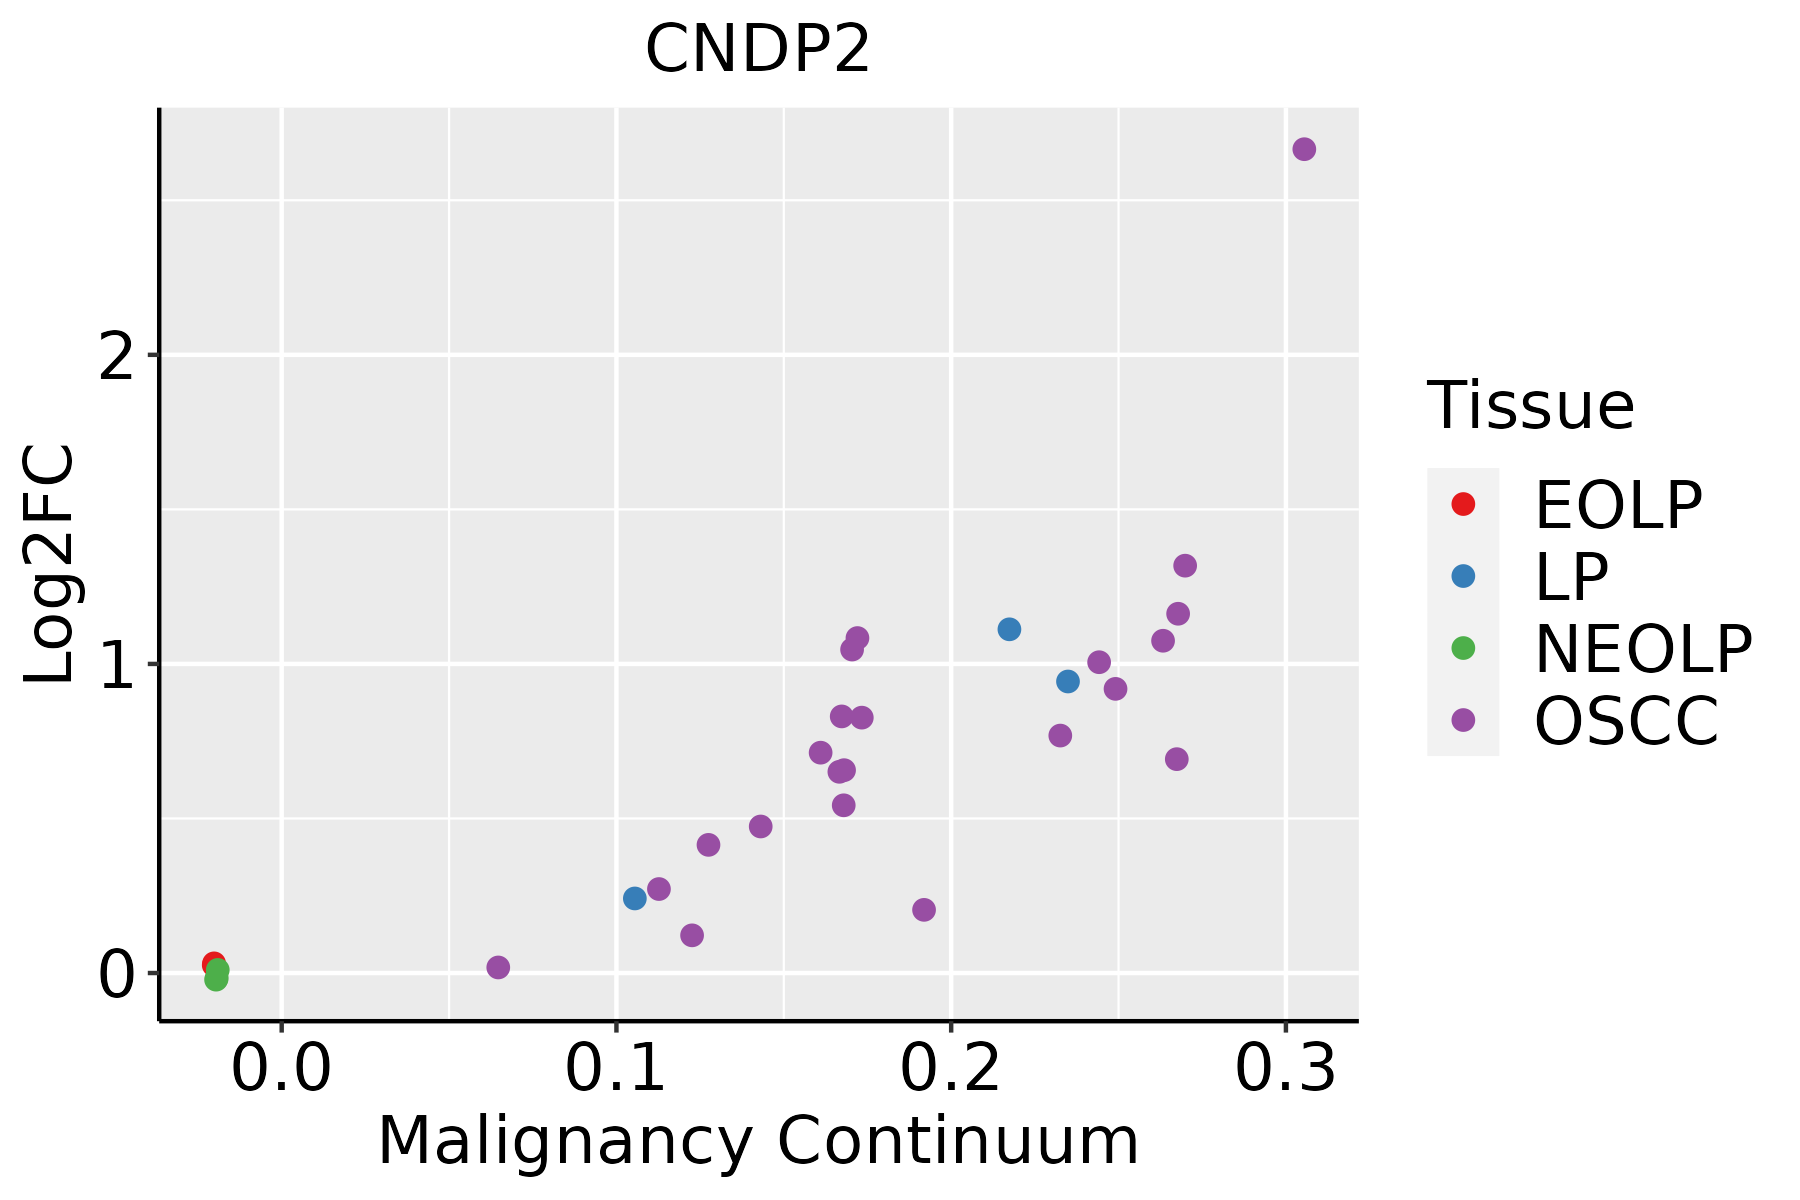
EOLP: Erosive Oral lichen planus
LP: leukoplakia
NEOLP: Non-erosive oral lichen planus
OSCC: Oral squamous cell carcinoma
ProstateThe image shows the transcriptomic changes along malignancy continuum.log2FC in expression of this searched gene in stem-like cells from each diseased tissue sample relative to stem-like cells in normal samples in each tissue plotted against the malignancy continuum. Samples are colored based on if they are from different disease stage.BPH: Benign Prostatic Hyperplasia
SkinThe image shows the transcriptomic changes along malignancy continuum.log2FC in expression of this searched gene in stem-like cells from each diseased tissue sample relative to stem-like cells in normal samples in each tissue plotted against the malignancy continuum. Samples are colored based on if they are from different disease stage.
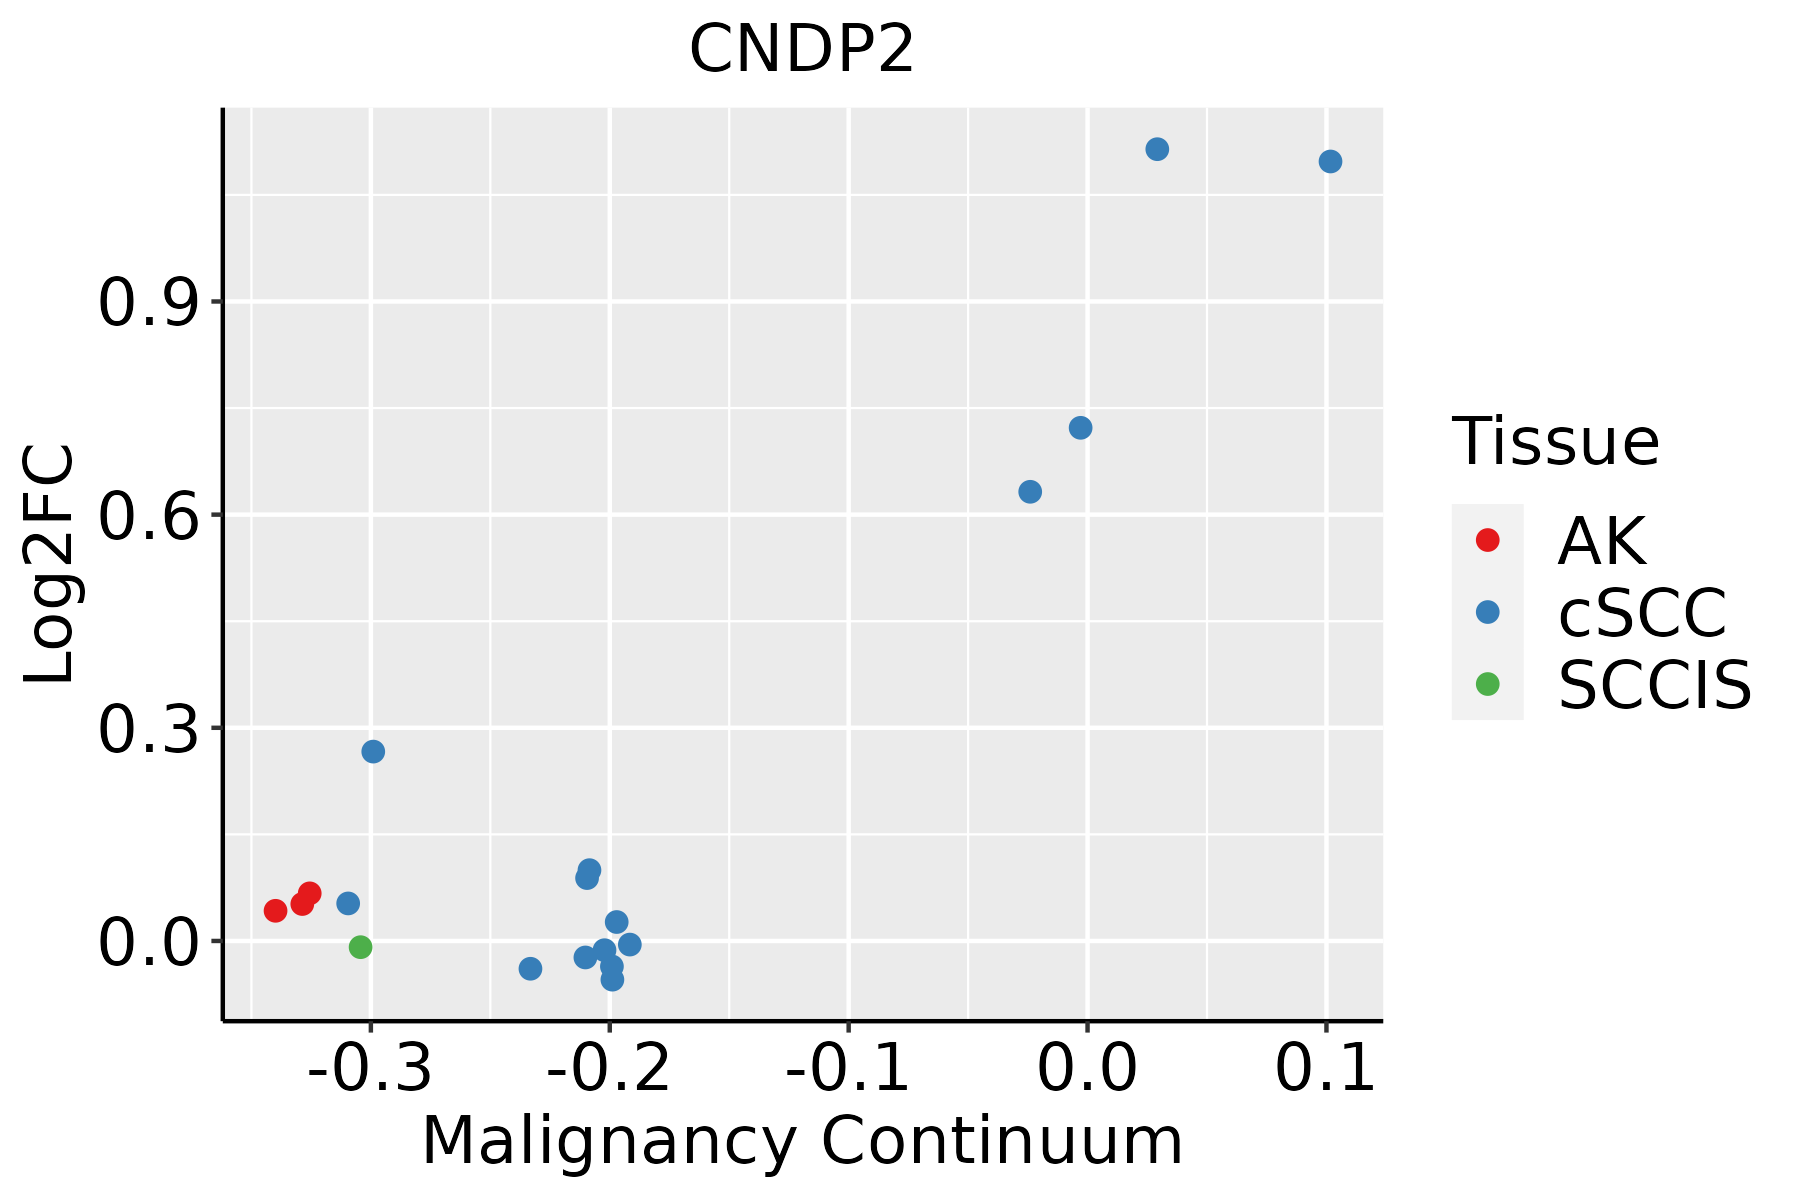
AK: Actinic keratosis
cSCC: Cutaneous squamous cell carcinoma
SCCIS:squamous cell carcinoma in situ
ThyroidThe image shows the transcriptomic changes along malignancy continuum.log2FC in expression of this searched gene in stem-like cells from each diseased tissue sample relative to stem-like cells in normal samples in each tissue plotted against the malignancy continuum. Samples are colored based on if they are from different disease stage.
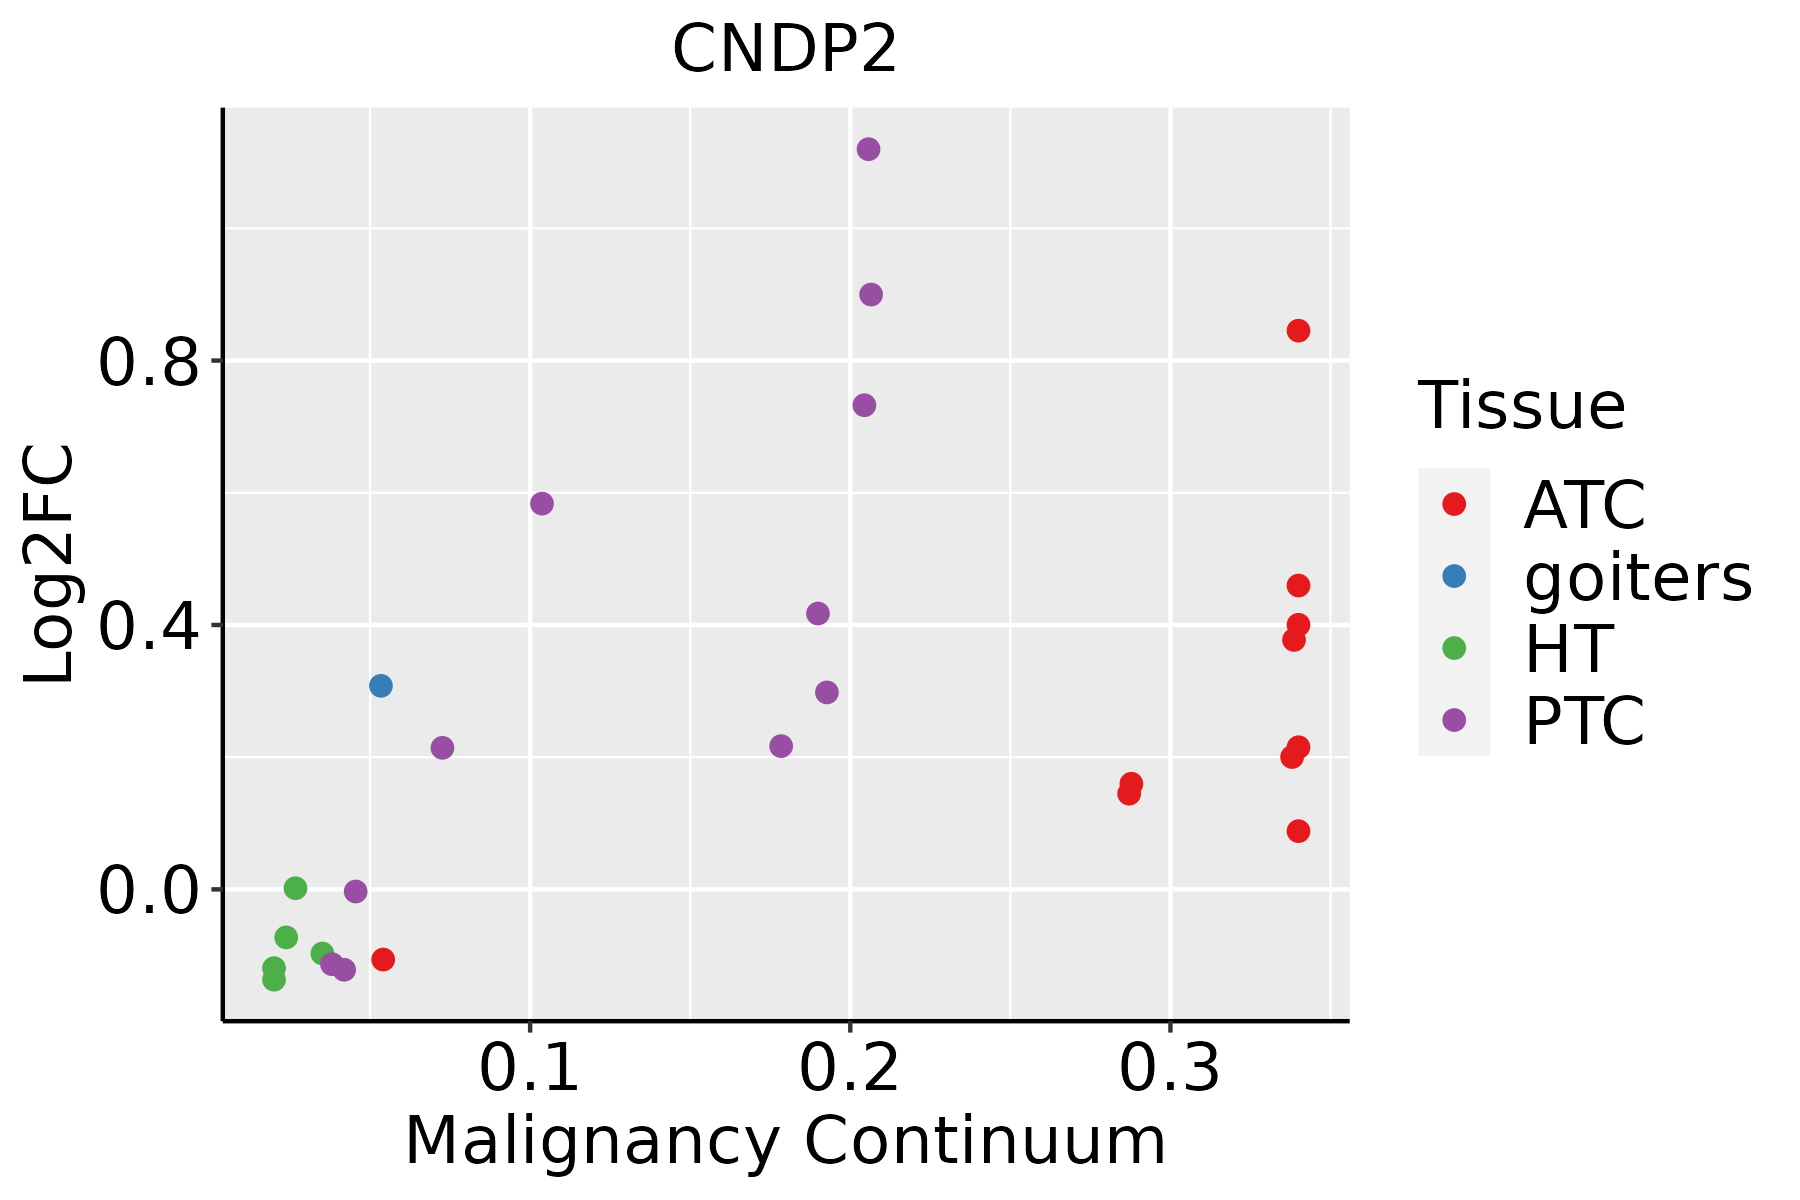
ATC: Anaplastic thyroid cancer
HT: Hashimoto's thyroiditis
PTC: Papillary thyroid cancer
∗log2FC in expression of this searched gene in stem-like cells from each diseased tissue sample relative to stem-like cells in normal samples in each tissue plotted against the malignancy continuum. Samples are colored based on if they are from different disease stage.

Top

Malignant transformation related pathway analysis

check buttonFind out the enriched GO biological processes and KEGG pathways involved in transition from healthy to precancer to cancer
check button Figure of enriched GO biological processes.
TissueDisease StageEnriched GO biological Processes
ColorectumADGO analysis - Figure of enriched GO biological processes: Top 15 enriched GO BP terms are showed in the bar plot of each disease state in each tissue. Each row represents a significant GO biological process which is colored according to the -log10(p.adjust).
ColorectumSERGO analysis - Figure of enriched GO biological processes: Top 15 enriched GO BP terms are showed in the bar plot of each disease state in each tissue. Each row represents a significant GO biological process which is colored according to the -log10(p.adjust).
ColorectumMSSGO analysis - Figure of enriched GO biological processes: Top 15 enriched GO BP terms are showed in the bar plot of each disease state in each tissue. Each row represents a significant GO biological process which is colored according to the -log10(p.adjust).
ColorectumMSI-HGO analysis - Figure of enriched GO biological processes: Top 15 enriched GO BP terms are showed in the bar plot of each disease state in each tissue. Each row represents a significant GO biological process which is colored according to the -log10(p.adjust).
ColorectumFAPGO analysis - Figure of enriched GO biological processes: Top 15 enriched GO BP terms are showed in the bar plot of each disease state in each tissue. Each row represents a significant GO biological process which is colored according to the -log10(p.adjust).
∗Top 15 enriched GO BP terms are showed in the bar plot of each disease state in each tissue. Each row represents a significant GO biological process which is colored according to the -log10(p.adjust).
Page: 1 2 3 4 5 6 7 8 9 

check button Enriched GO biological processes.
GO IDTissueDisease StageDescriptionGene RatioBg Ratiopvaluep.adjustCount
Page: 1 

check button Enriched KEGG pathways.
Pathway IDTissueDisease StageDescriptionGene RatioBg Ratiopvaluep.adjustqvalueCount
hsa00330ColorectumADArginine and proline metabolism23/209250/84658.27e-045.90e-033.76e-0323
hsa003301ColorectumADArginine and proline metabolism23/209250/84658.27e-045.90e-033.76e-0323
hsa003302ColorectumSERArginine and proline metabolism17/158050/84657.12e-033.77e-022.74e-0217
hsa003303ColorectumSERArginine and proline metabolism17/158050/84657.12e-033.77e-022.74e-0217
hsa003304ColorectumMSSArginine and proline metabolism23/187550/84651.52e-041.24e-037.61e-0423
hsa003305ColorectumMSSArginine and proline metabolism23/187550/84651.52e-041.24e-037.61e-0423
hsa003306ColorectumFAPArginine and proline metabolism16/140450/84655.33e-032.10e-021.27e-0216
hsa003307ColorectumFAPArginine and proline metabolism16/140450/84655.33e-032.10e-021.27e-0216
hsa00410LiverCirrhoticbeta-Alanine metabolism18/253031/84651.00e-035.57e-033.43e-0318
hsa003308LiverCirrhoticArginine and proline metabolism25/253050/84652.18e-039.41e-035.80e-0325
hsa004101LiverCirrhoticbeta-Alanine metabolism18/253031/84651.00e-035.57e-033.43e-0318
hsa0033011LiverCirrhoticArginine and proline metabolism25/253050/84652.18e-039.41e-035.80e-0325
hsa0033021LiverHCCArginine and proline metabolism33/402050/84656.28e-031.77e-029.83e-0333
hsa004102LiverHCCbeta-Alanine metabolism22/402031/84656.93e-031.92e-021.07e-0222
hsa0033031LiverHCCArginine and proline metabolism33/402050/84656.28e-031.77e-029.83e-0333
hsa004103LiverHCCbeta-Alanine metabolism22/402031/84656.93e-031.92e-021.07e-0222
hsa0033010Oral cavityOSCCArginine and proline metabolism30/370450/84651.50e-023.26e-021.66e-0230
hsa0033013Oral cavityOSCCArginine and proline metabolism30/370450/84651.50e-023.26e-021.66e-0230
hsa0033023Oral cavityLPArginine and proline metabolism26/241850/84653.94e-042.08e-031.34e-0326
hsa0033033Oral cavityLPArginine and proline metabolism26/241850/84653.94e-042.08e-031.34e-0326
Page: 1 2 

Top

Cell-cell communication analysis

check buttonIdentification of potential cell-cell interactions between two cell types and their ligand-receptor pairs for different disease states
LigandReceptorLRpairPathwayTissueDisease Stage
Page: 1 

Top

Single-cell gene regulatory network inference analysis

check buttonFind out the significant the regulons (TFs) and the target genes of each regulon across cell types for different disease states
TFCell TypeTissueDisease StageTarget GeneRSSRegulon Activity
∗The dot plots of a searched regulon are shown for all cell subpopulations in each disease state of each tissue based on the regulon specific score inferred using pySCENIC and by calculating the average expression.
Page: 1 

Top

Somatic mutation of malignant transformation related genes

check buttonAnnotation of somatic variants for genes involved in malignant transformation
Hugo SymbolVariant ClassVariant ClassificationdbSNP RSHGVScHGVSpHGVSp ShortSWISSPROTBIOTYPESIFTPolyPhenTumor Sample BarcodeTissueHistologySexAgeStageTherapy TypesDrugsOutcome
CNDP2SNVMissense_Mutationnovelc.655N>Cp.Glu219Glnp.E219QQ96KP4protein_codingtolerated(0.09)possibly_damaging(0.709)TCGA-A8-A06Q-01Breastbreast invasive carcinomaFemale<65III/IVUnknownUnknownSD
CNDP2SNVMissense_Mutationnovelc.362N>Cp.Arg121Prop.R121PQ96KP4protein_codingtolerated(0.05)benign(0.05)TCGA-A8-A08H-01Breastbreast invasive carcinomaFemale>=65I/IIUnknownUnknownSD
CNDP2SNVMissense_Mutationrs764351246c.958N>Ap.Glu320Lysp.E320KQ96KP4protein_codingdeleterious(0)possibly_damaging(0.797)TCGA-AN-A046-01Breastbreast invasive carcinomaFemale>=65I/IIUnknownUnknownSD
CNDP2SNVMissense_Mutationnovelc.276G>Cp.Lys92Asnp.K92NQ96KP4protein_codingdeleterious(0.02)benign(0.02)TCGA-AO-A0J9-01Breastbreast invasive carcinomaFemale<65III/IVChemotherapycyclophosphamidePD
CNDP2SNVMissense_Mutationrs751626393c.227N>Tp.Pro76Leup.P76LQ96KP4protein_codingdeleterious(0.02)benign(0.304)TCGA-E9-A1RB-01Breastbreast invasive carcinomaFemale<65I/IIChemotherapymethotrexateSD
CNDP2insertionNonsense_Mutationnovelc.360_361insTACAAGAAAGTAAGAAAGTAAATCTTAATTAGTGACTp.Arg121TyrfsTer7p.R121Yfs*7Q96KP4protein_codingTCGA-A8-A08H-01Breastbreast invasive carcinomaFemale>=65I/IIUnknownUnknownSD
CNDP2insertionNonsense_Mutationnovelc.1287_1288insTGTGGATGATGCCGCGCAGGGCCCTTCGCACGTCTGp.Gly429_Lys430insCysGlyTerCysArgAlaGlyProPheAlaArgLeup.G429_K430insCG*CRAGPFARLQ96KP4protein_codingTCGA-AN-A0AR-01Breastbreast invasive carcinomaFemale<65I/IIUnknownUnknownSD
CNDP2SNVMissense_Mutationrs146492497c.809N>Tp.Thr270Metp.T270MQ96KP4protein_codingdeleterious(0.01)possibly_damaging(0.713)TCGA-2W-A8YY-01Cervixcervical & endocervical cancerFemale<65I/IIChemotherapycisplatinCR
CNDP2SNVMissense_Mutationc.1345G>Ap.Glu449Lysp.E449KQ96KP4protein_codingdeleterious(0)probably_damaging(1)TCGA-DS-A0VM-01Cervixcervical & endocervical cancerFemale<65I/IIChemotherapycisplatinPD
CNDP2SNVMissense_Mutationc.1416G>Tp.Gln472Hisp.Q472HQ96KP4protein_codingtolerated(0.06)benign(0)TCGA-AA-3663-01Colorectumcolon adenocarcinomaMale<65I/IIUnknownUnknownSD
Page: 1 2 3 4 5 6 

Top

Related drugs of malignant transformation related genes

check buttonIdentification of chemicals and drugs interact with genes involved in malignant transfromation
(DGIdb 4.0)
Entrez IDSymbolCategoryInteraction TypesDrug Claim NameDrug NamePMIDs
Page: 1