Schematic overview of the cellular and molecular mechanisms involved in the cancer progression, including the proposed cellular and molecular mechanisms in cancer cells trajectory. AT1: alveolar type 1 cells; AT2: alveolar type 2 cells; AAH: atypical adenomatous hyperplasia; AIS: adenocarcinoma in situ; MIA: minimally invasive adenocarcinoma; IA: invasive adenocarcinoma; EMT: epithelial-mesenchymal transition

Home

Download

Statistics

Help

Contact

Center for Computational Systems Medicine
leaf

Gene summary

leaf

Malignant transformation analysis

leaf

Malignant transformation related pathway analysis

leaf

Cell-cell communication analysis

leaf

Single-cell gene regulatory network inference analysis

leaf

Somatic mutation of malignant transformation related genes

leaf

Related drugs of malignant transformation related genes

Gene: CNBP

Gene summary for CNBP

check button Gene summary.

Gene informationSpeciesHuman
Gene symbol

CNBP

Gene ID

7555

Gene nameCCHC-type zinc finger nucleic acid binding protein
Gene AliasCNBP1
Cytomap3q21.3
Gene Typeprotein-coding
GO ID

GO:0000122

UniProtAcc

P62633


Top

Malignant transformation analysis

check button Identification of the aberrant gene expression in precancerous and cancerous lesions by comparing the gene expression of stem-like cells in diseased tissues with normal stem cells
check button Malignant transformation involving gene list.
Entrez IDSymbolReplicatesSpeciesOrganTissueAdj P-valueLog2FCMalignancy
7555CNBPGSM4909282HumanBreastIDC1.33e-032.87e-01-0.0288
7555CNBPGSM4909286HumanBreastIDC3.33e-08-9.06e-020.1081
7555CNBPGSM4909288HumanBreastIDC8.99e-03-1.59e-010.0988
7555CNBPGSM4909291HumanBreastIDC3.13e-02-3.34e-010.1753
7555CNBPGSM4909293HumanBreastIDC1.60e-036.71e-020.1581
7555CNBPGSM4909294HumanBreastIDC8.34e-07-3.27e-010.2022
7555CNBPGSM4909296HumanBreastIDC1.25e-25-5.75e-010.1524
7555CNBPGSM4909297HumanBreastIDC1.18e-22-2.50e-010.1517
7555CNBPGSM4909301HumanBreastIDC9.60e-26-6.54e-010.1577
7555CNBPGSM4909302HumanBreastIDC2.63e-16-5.23e-010.1545
7555CNBPGSM4909309HumanBreastIDC8.42e-05-2.62e-010.0483
7555CNBPGSM4909311HumanBreastIDC2.85e-48-6.34e-010.1534
7555CNBPGSM4909312HumanBreastIDC1.74e-10-3.53e-020.1552
7555CNBPGSM4909313HumanBreastIDC1.76e-04-2.89e-010.0391
7555CNBPGSM4909316HumanBreastIDC2.87e-059.12e-020.21
7555CNBPGSM4909318HumanBreastIDC1.76e-061.87e-010.2031
7555CNBPGSM4909319HumanBreastIDC9.78e-62-5.46e-010.1563
7555CNBPGSM4909320HumanBreastIDC1.27e-15-6.58e-010.1575
7555CNBPGSM4909321HumanBreastIDC7.15e-21-3.27e-010.1559
7555CNBPbrca1HumanBreastPrecancer2.02e-114.07e-01-0.0338
Page: 1 2 3 4 5 6 7 8 9 10 11 12 13 14 15 

check button Transcriptomic changes along malignancy continuum.
TissueExpression DynamicsAbbreviation
BreastThe image shows the transcriptomic changes along malignancy continuum.log2FC in expression of this searched gene in stem-like cells from each diseased tissue sample relative to stem-like cells in normal samples in each tissue plotted against the malignancy continuum. Samples are colored based on if they are from different disease stage.
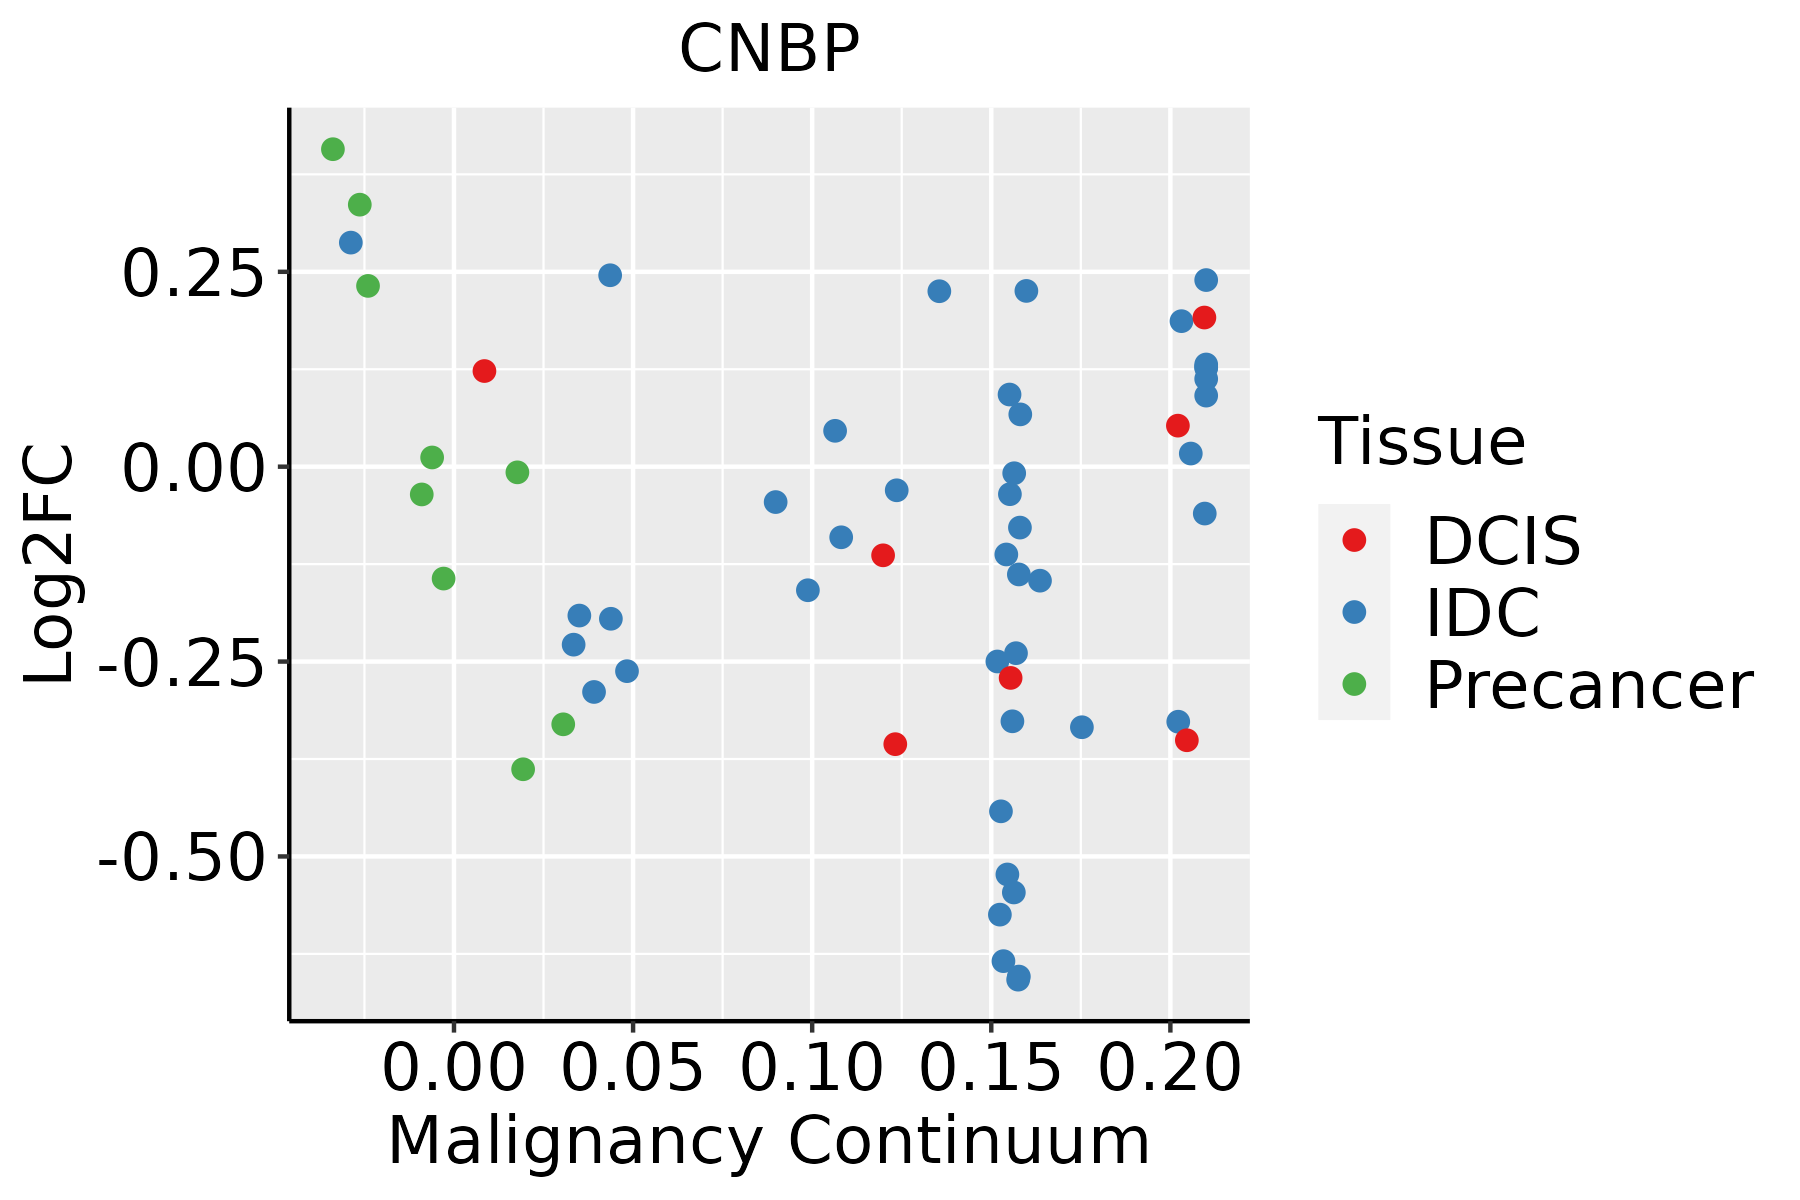
IDC: Invasive ductal carcinoma
DCIS: Ductal carcinoma in situ
Precancer(BRCA1-mut): Precancerous lesion from BRCA1 mutation carriers
EndometriumThe image shows the transcriptomic changes along malignancy continuum.log2FC in expression of this searched gene in stem-like cells from each diseased tissue sample relative to stem-like cells in normal samples in each tissue plotted against the malignancy continuum. Samples are colored based on if they are from different disease stage.
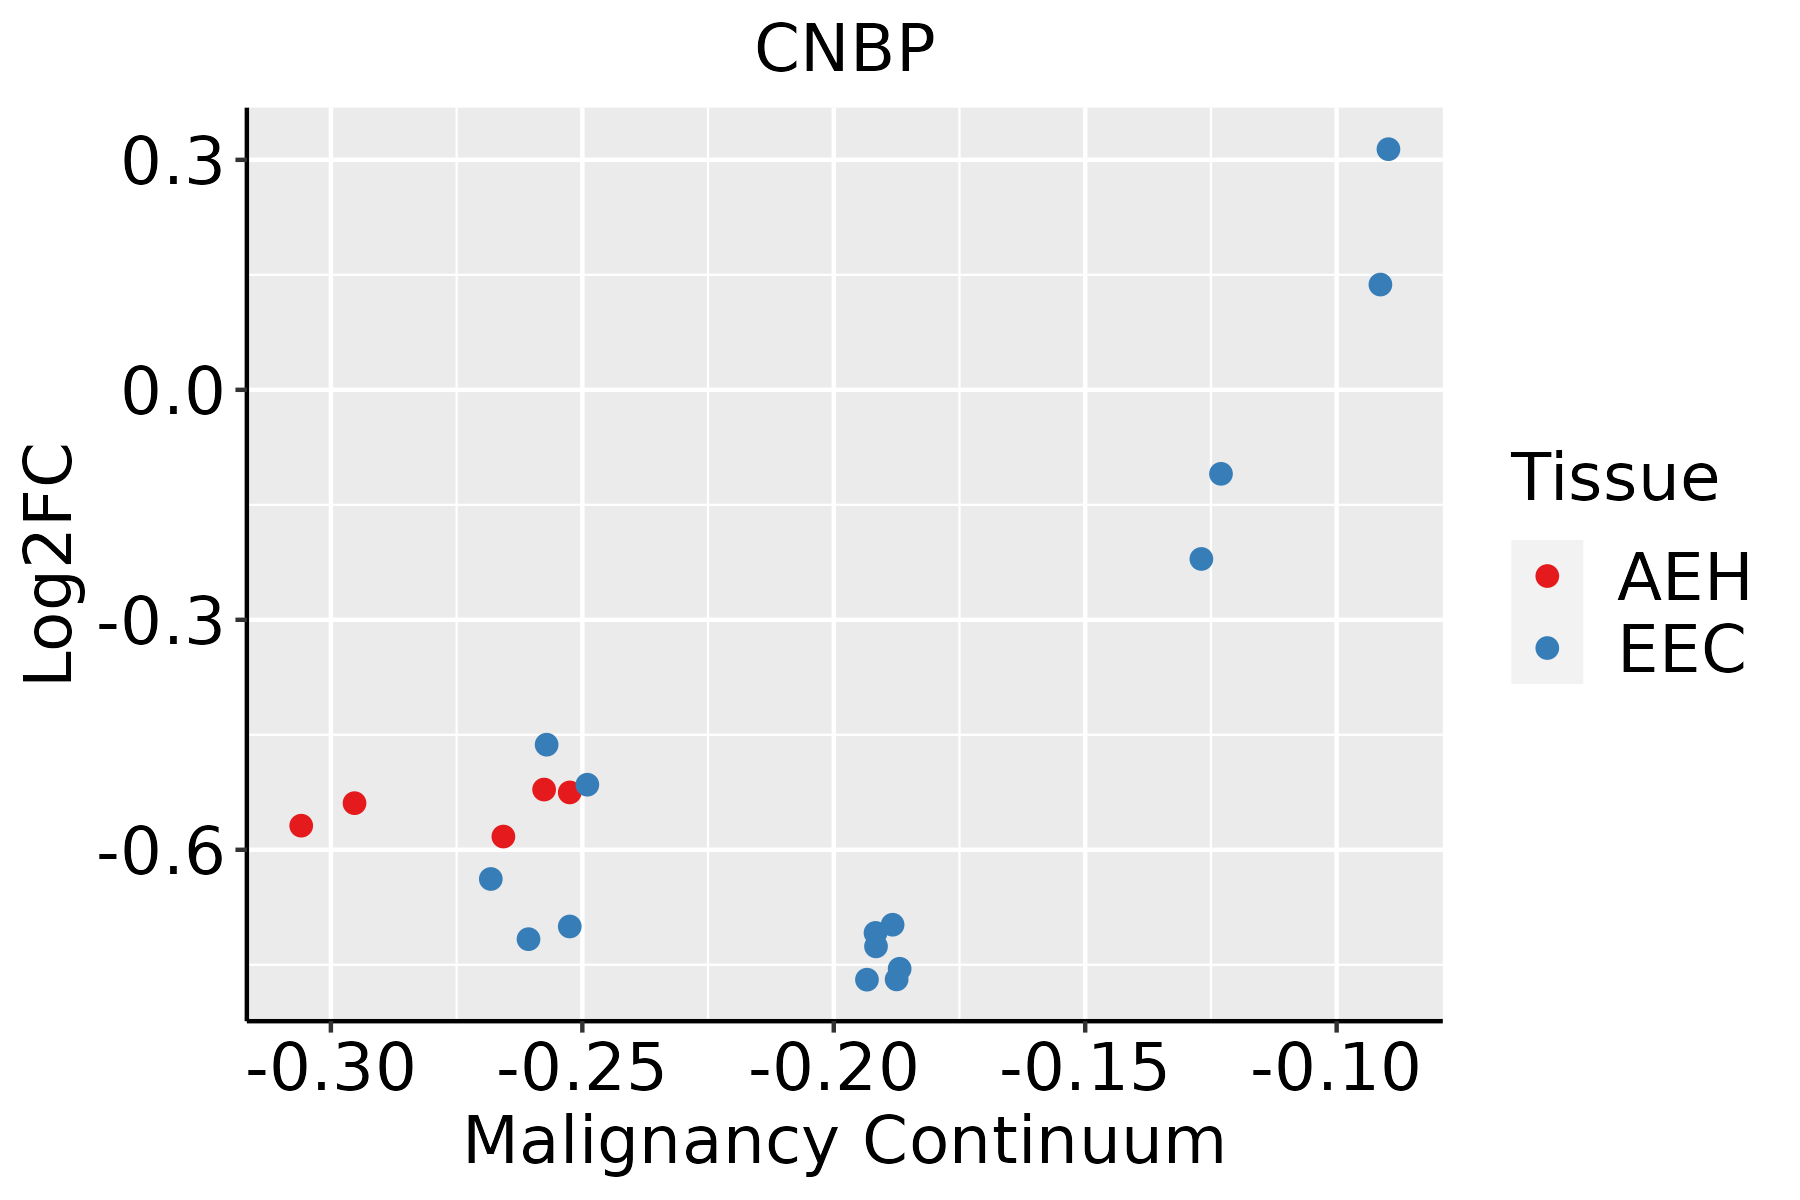
AEH: Atypical endometrial hyperplasia
EEC: Endometrioid Cancer
EsophagusThe image shows the transcriptomic changes along malignancy continuum.log2FC in expression of this searched gene in stem-like cells from each diseased tissue sample relative to stem-like cells in normal samples in each tissue plotted against the malignancy continuum. Samples are colored based on if they are from different disease stage.
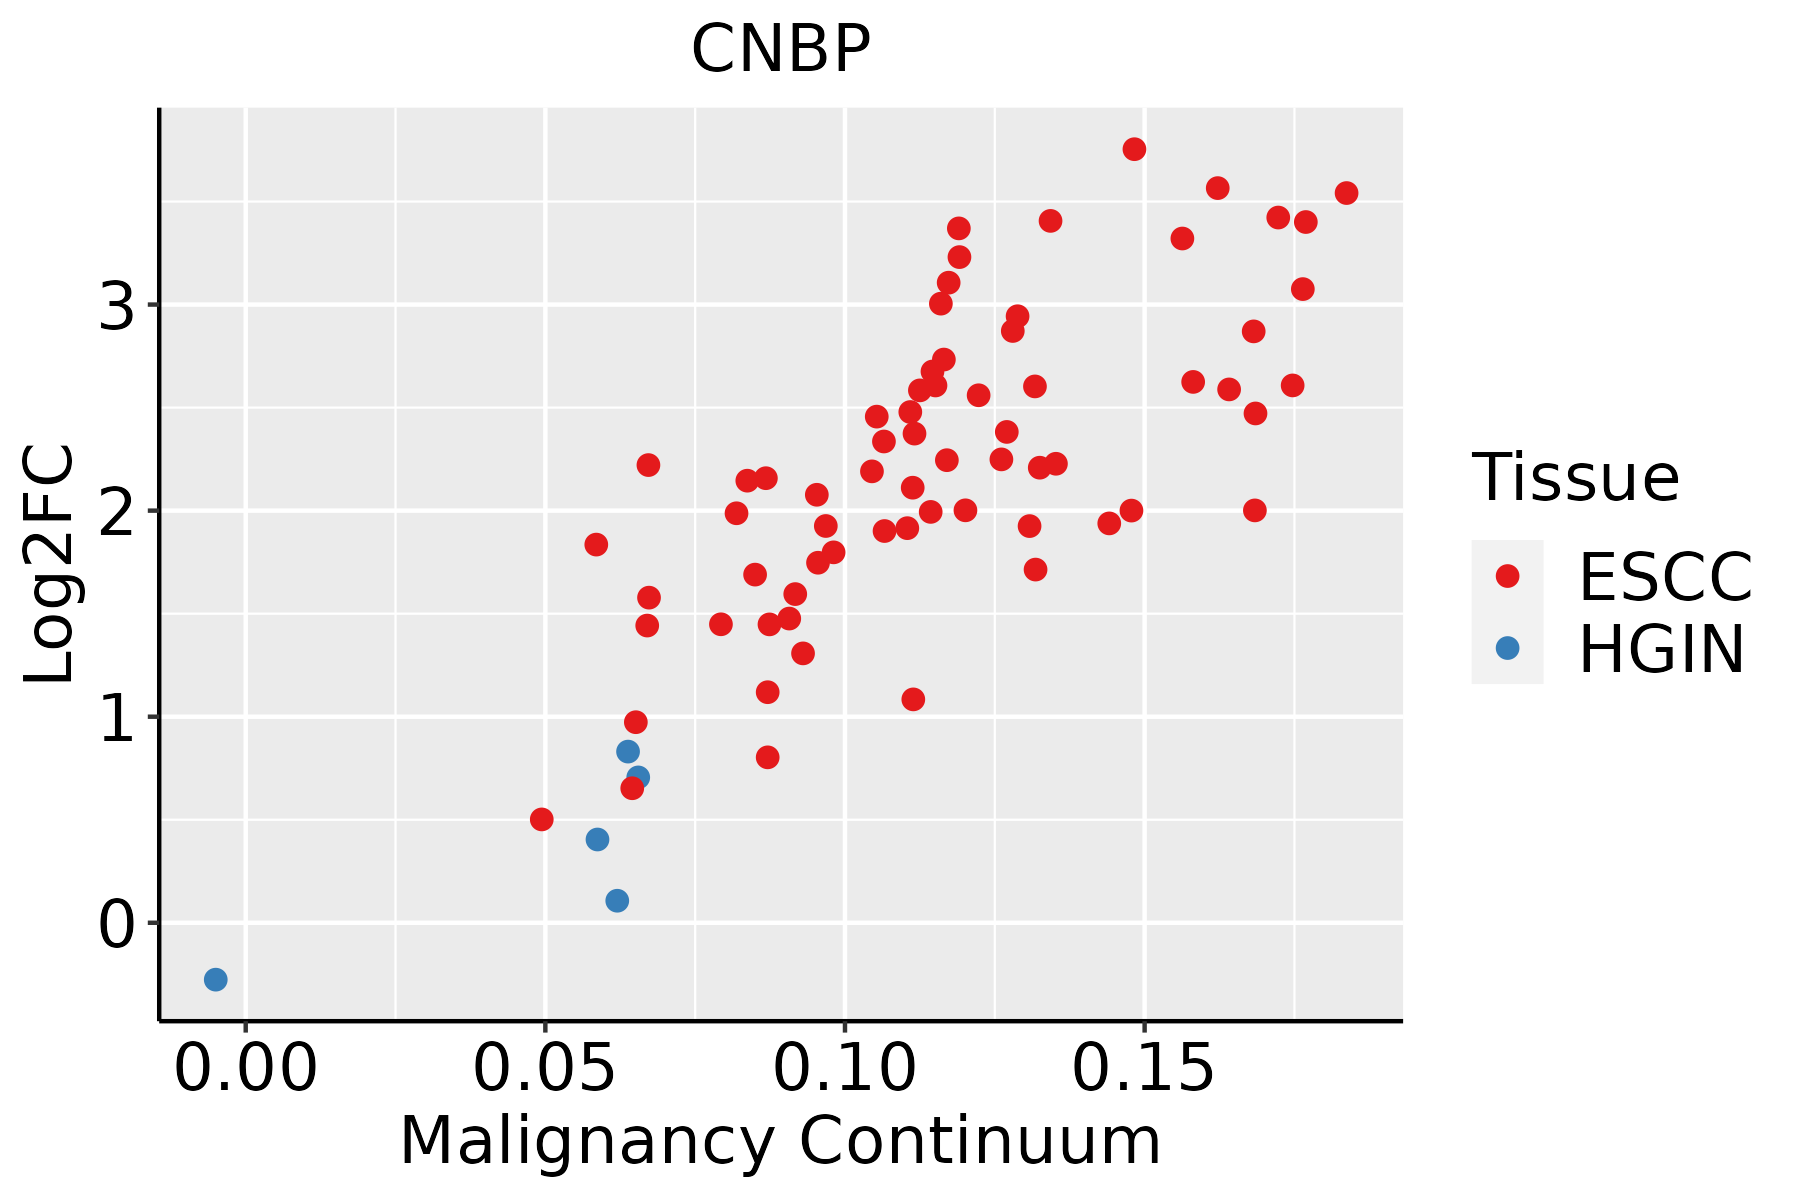
ESCC: Esophageal squamous cell carcinoma
HGIN: High-grade intraepithelial neoplasias
LGIN: Low-grade intraepithelial neoplasias
GCThe image shows the transcriptomic changes along malignancy continuum.log2FC in expression of this searched gene in stem-like cells from each diseased tissue sample relative to stem-like cells in normal samples in each tissue plotted against the malignancy continuum. Samples are colored based on if they are from different disease stage.
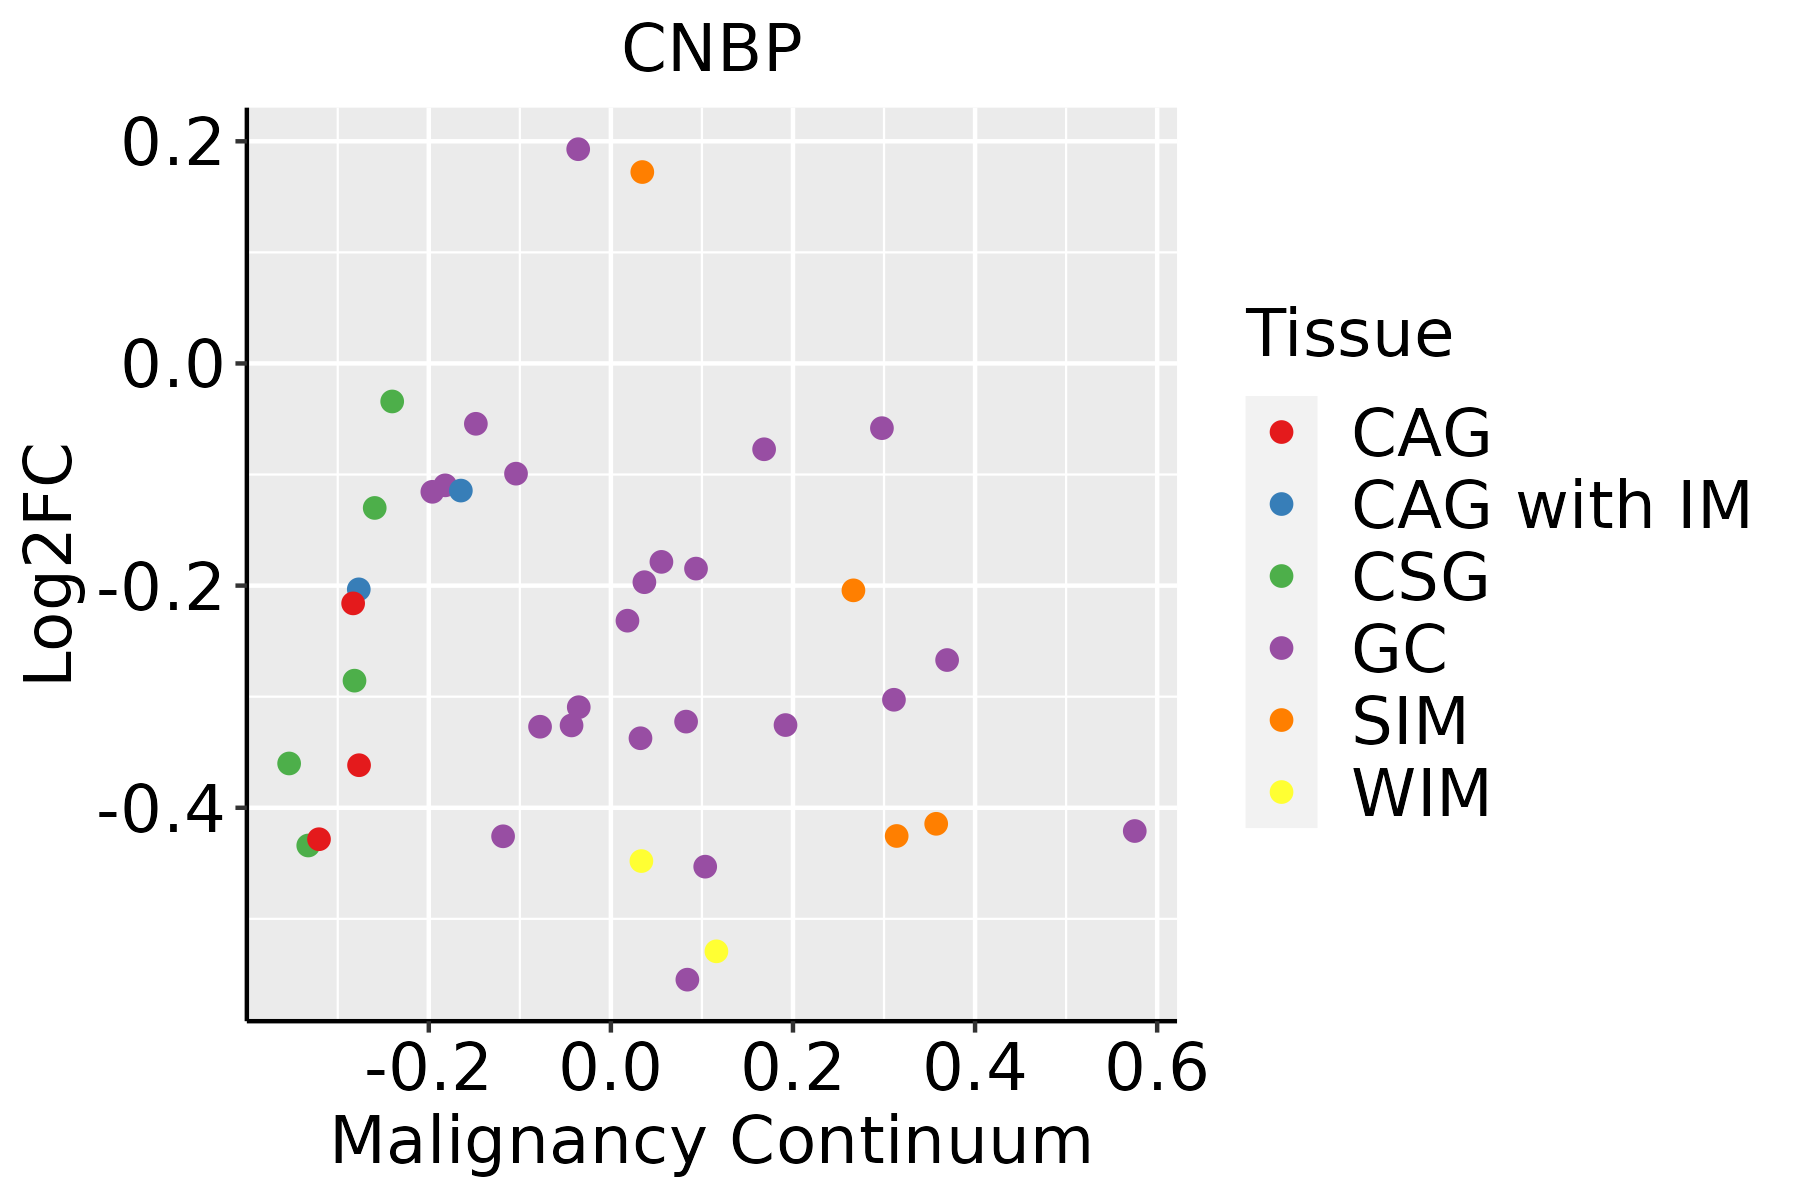
CAG: Chronic atrophic gastritis
CAG with IM: Chronic atrophic gastritis with intestinal metaplasia
CSG: Chronic superficial gastritis
GC: Gastric cancer
SIM: Severe intestinal metaplasia
WIM: Wild intestinal metaplasia
LiverThe image shows the transcriptomic changes along malignancy continuum.log2FC in expression of this searched gene in stem-like cells from each diseased tissue sample relative to stem-like cells in normal samples in each tissue plotted against the malignancy continuum. Samples are colored based on if they are from different disease stage.
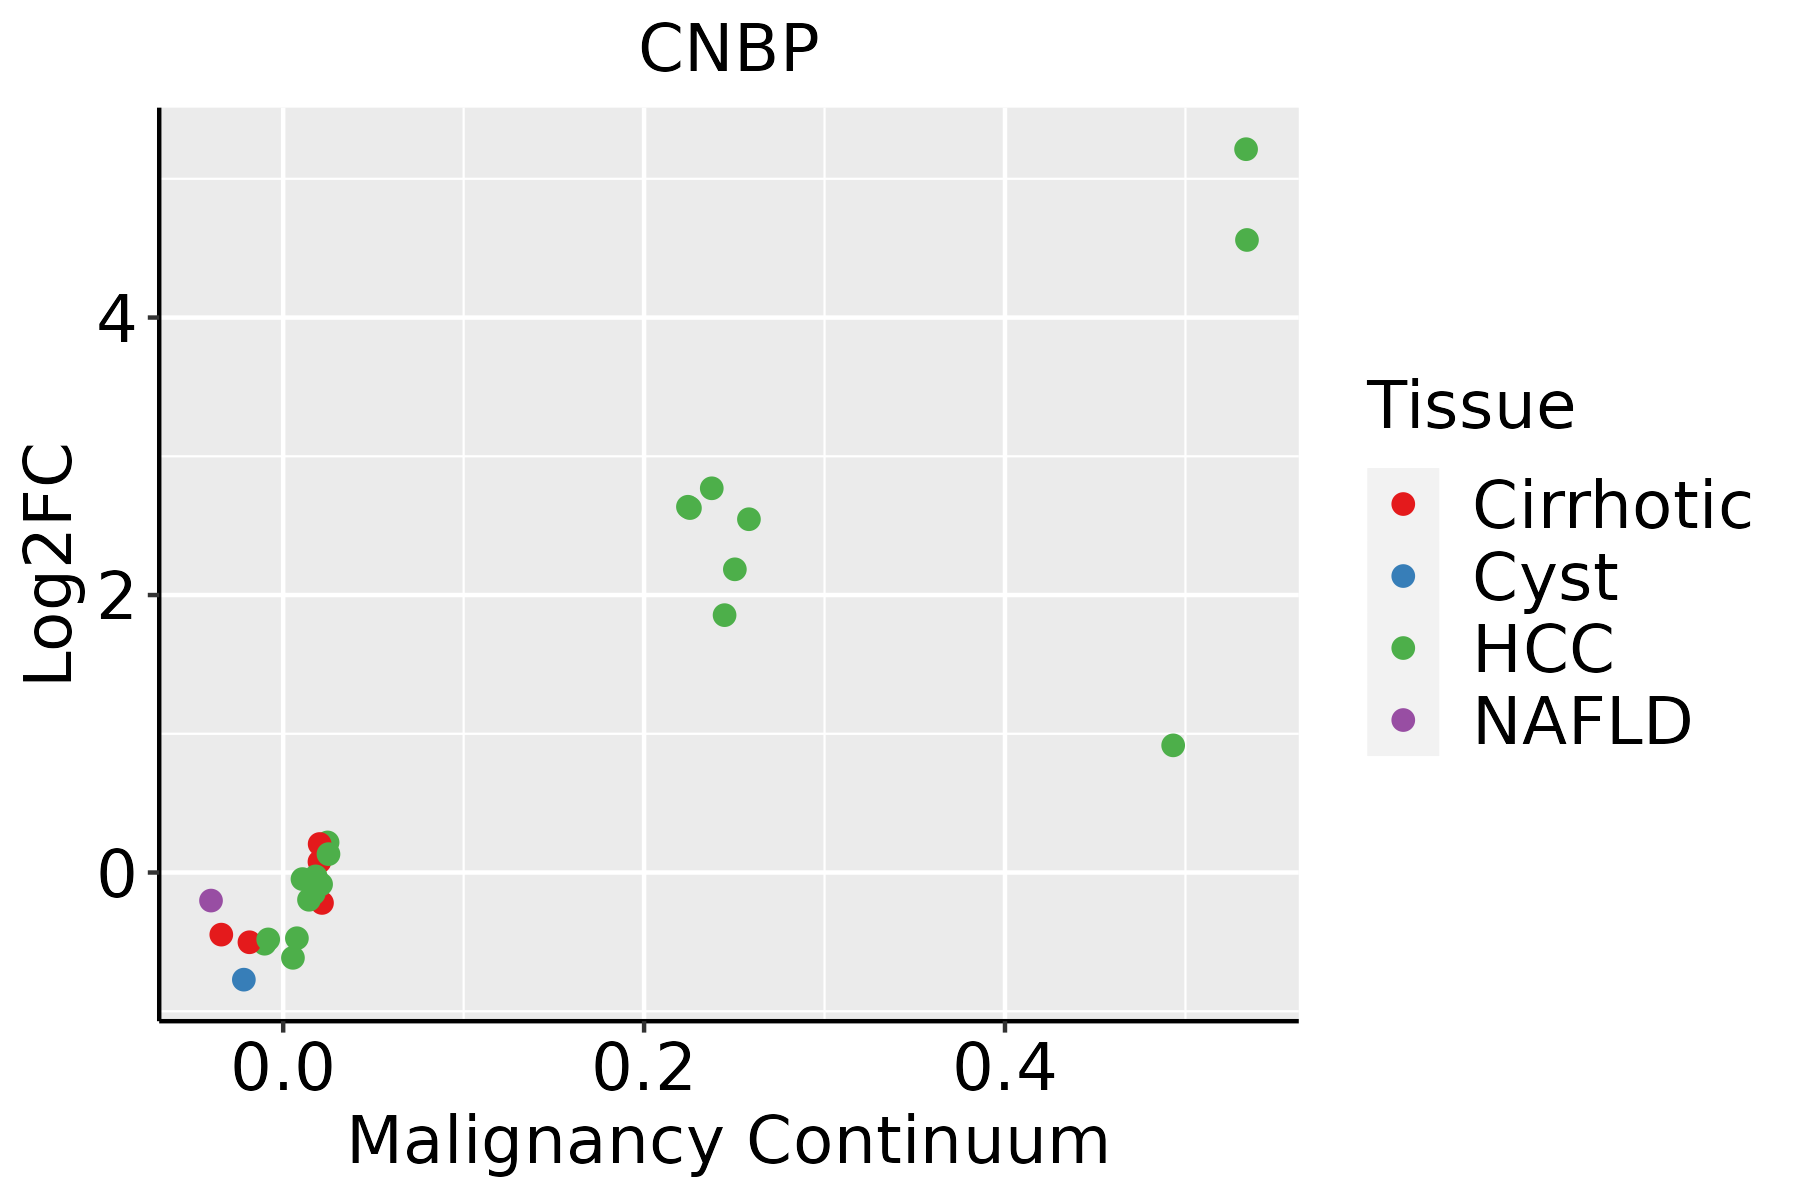
HCC: Hepatocellular carcinoma
NAFLD: Non-alcoholic fatty liver disease
LungThe image shows the transcriptomic changes along malignancy continuum.log2FC in expression of this searched gene in stem-like cells from each diseased tissue sample relative to stem-like cells in normal samples in each tissue plotted against the malignancy continuum. Samples are colored based on if they are from different disease stage.
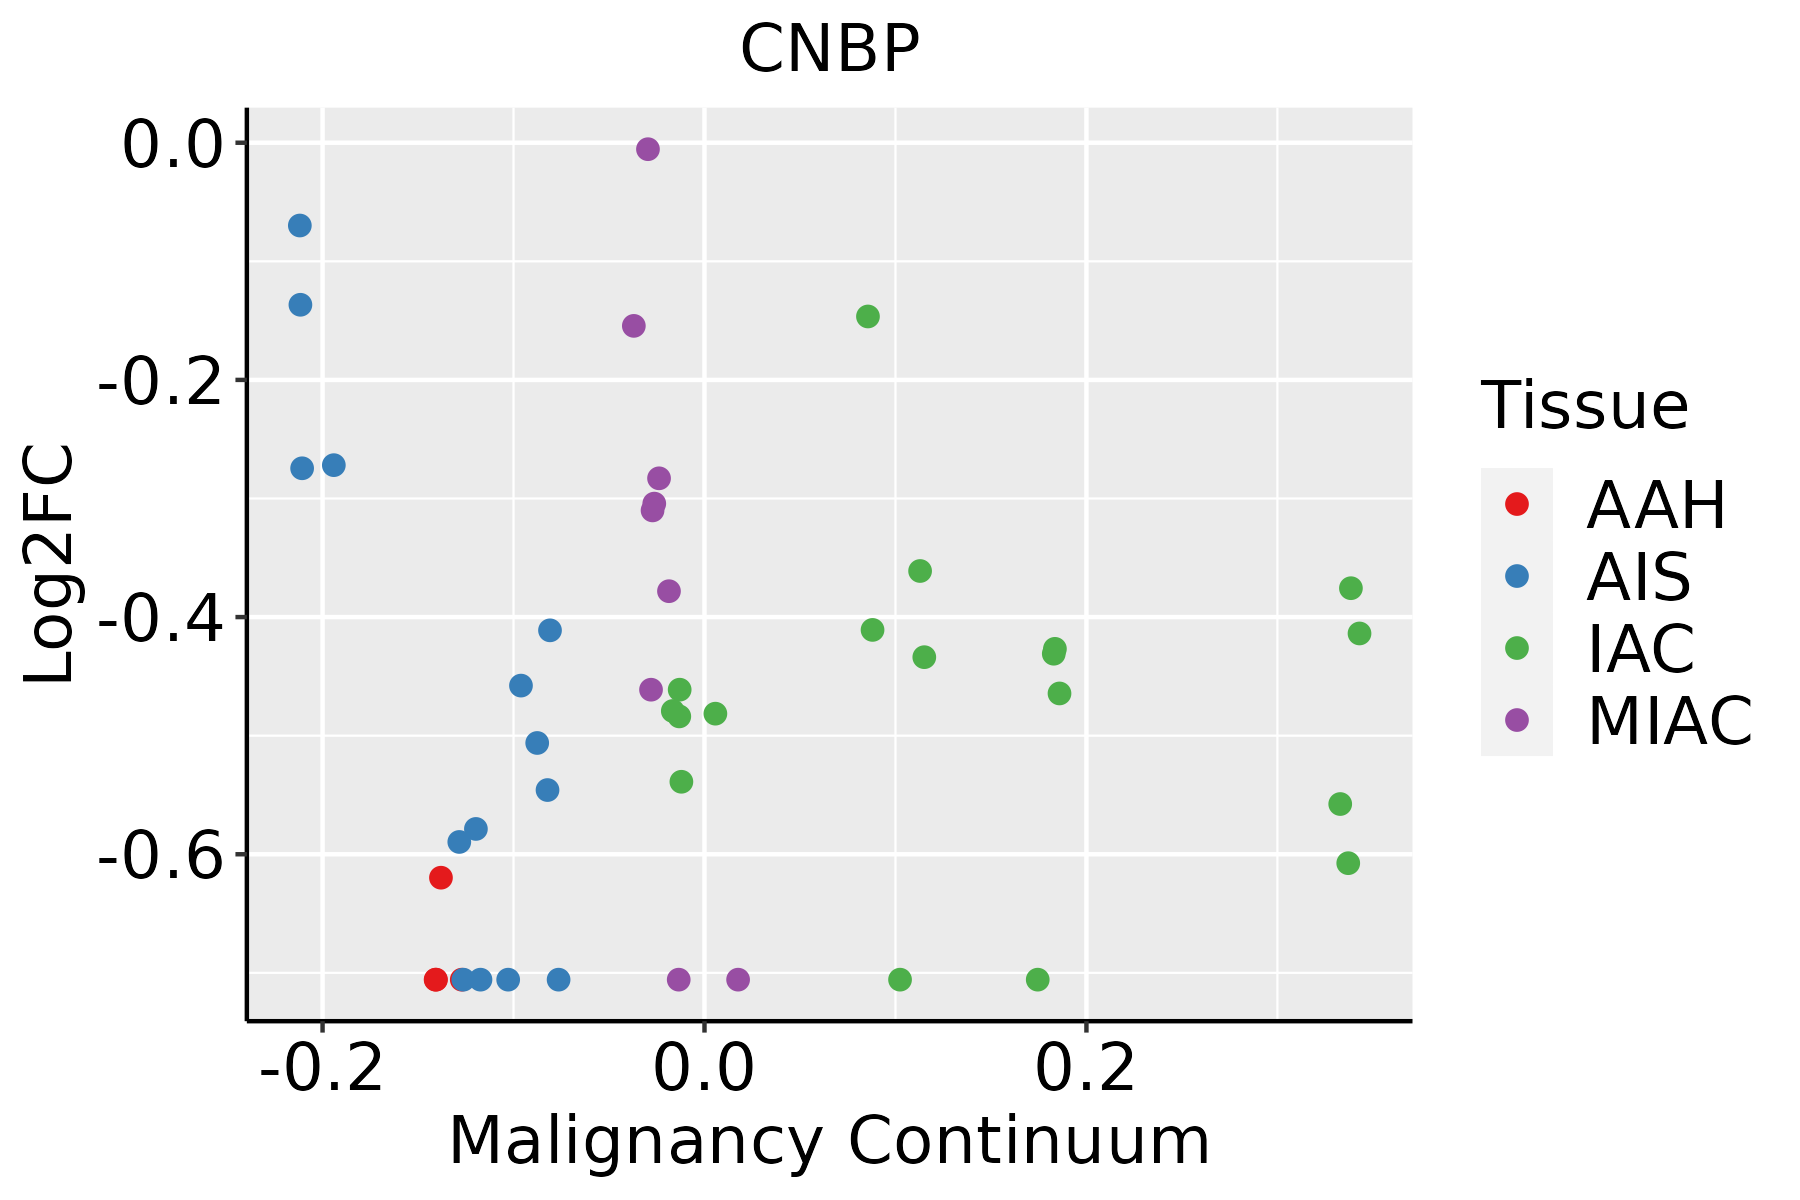
AAH: Atypical adenomatous hyperplasia
AIS: Adenocarcinoma in situ
IAC: Invasive lung adenocarcinoma
MIA: Minimally invasive adenocarcinoma
Oral CavityThe image shows the transcriptomic changes along malignancy continuum.log2FC in expression of this searched gene in stem-like cells from each diseased tissue sample relative to stem-like cells in normal samples in each tissue plotted against the malignancy continuum. Samples are colored based on if they are from different disease stage.EOLP: Erosive Oral lichen planus
LP: leukoplakia
NEOLP: Non-erosive oral lichen planus
OSCC: Oral squamous cell carcinoma
ProstateThe image shows the transcriptomic changes along malignancy continuum.log2FC in expression of this searched gene in stem-like cells from each diseased tissue sample relative to stem-like cells in normal samples in each tissue plotted against the malignancy continuum. Samples are colored based on if they are from different disease stage.
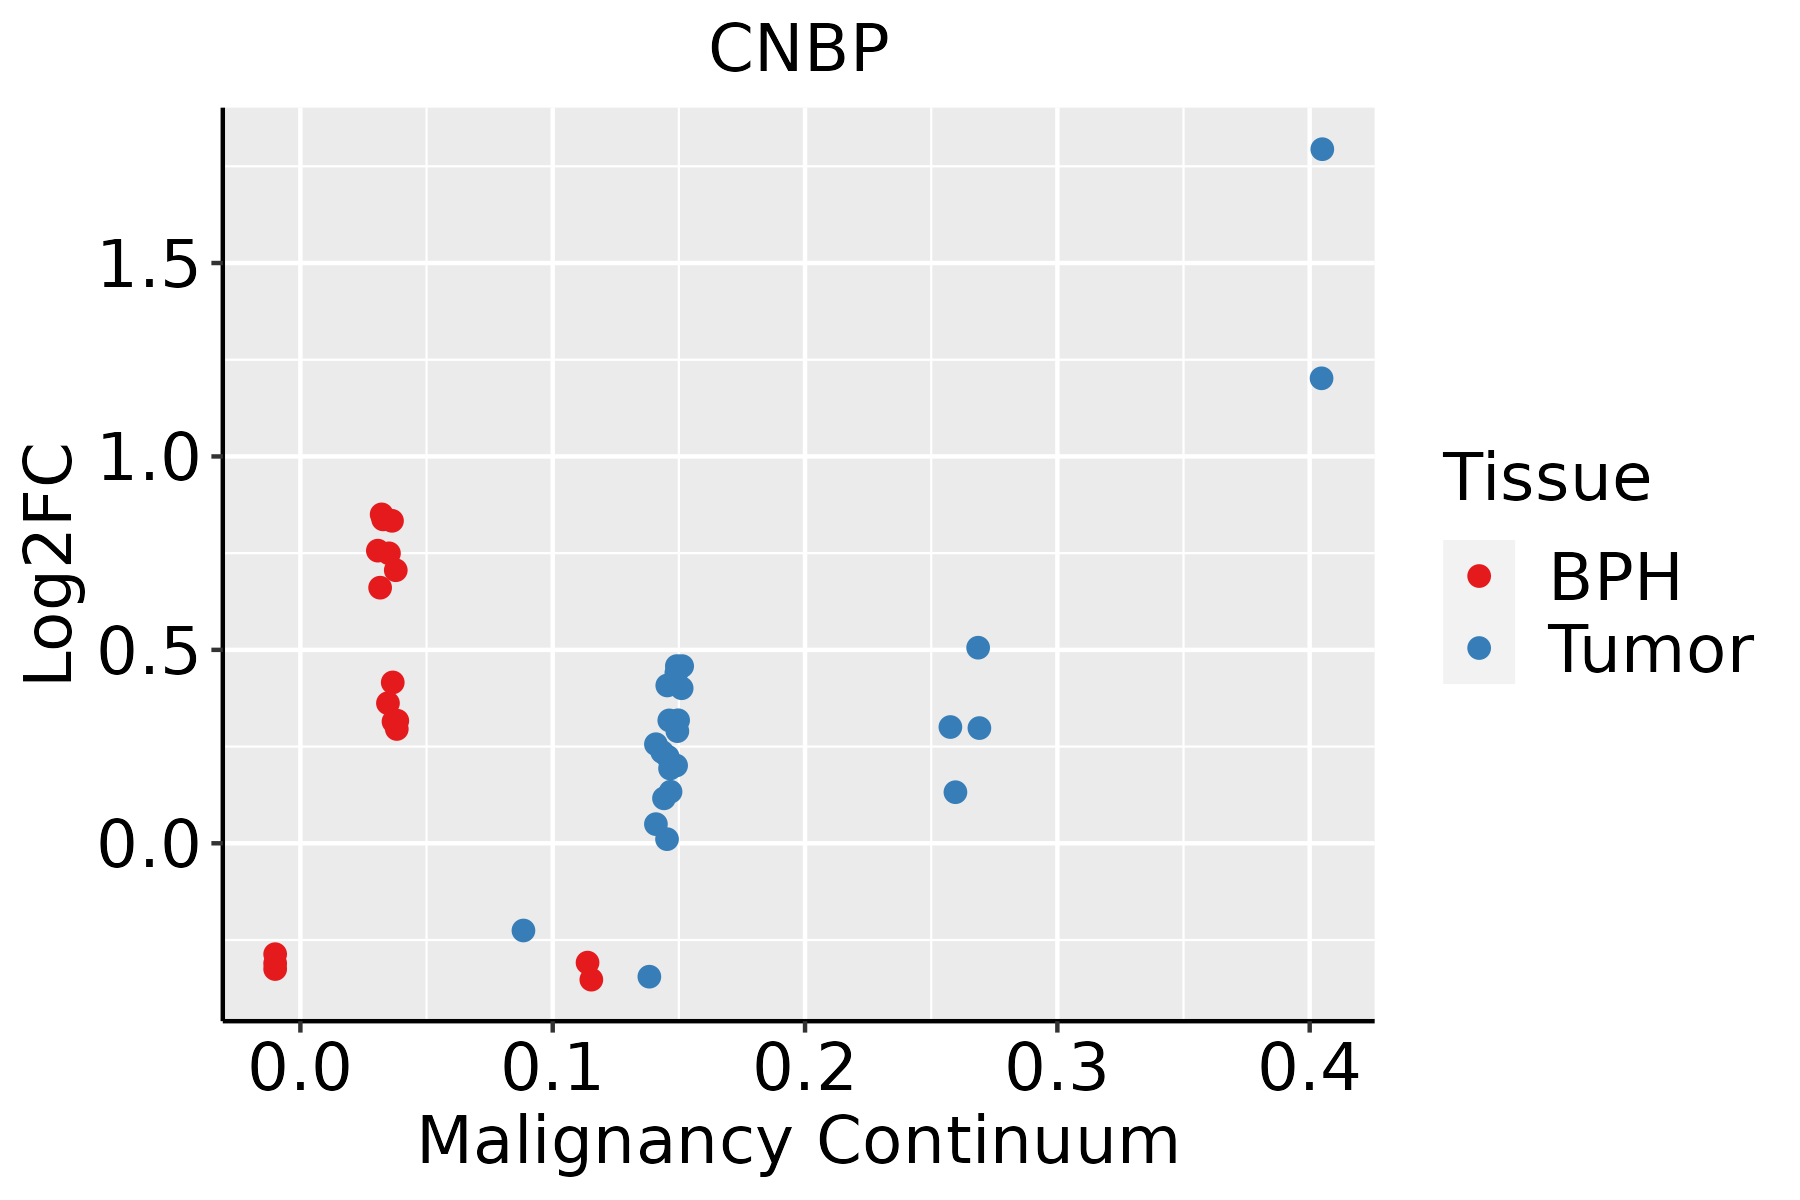
BPH: Benign Prostatic Hyperplasia
SkinThe image shows the transcriptomic changes along malignancy continuum.log2FC in expression of this searched gene in stem-like cells from each diseased tissue sample relative to stem-like cells in normal samples in each tissue plotted against the malignancy continuum. Samples are colored based on if they are from different disease stage.
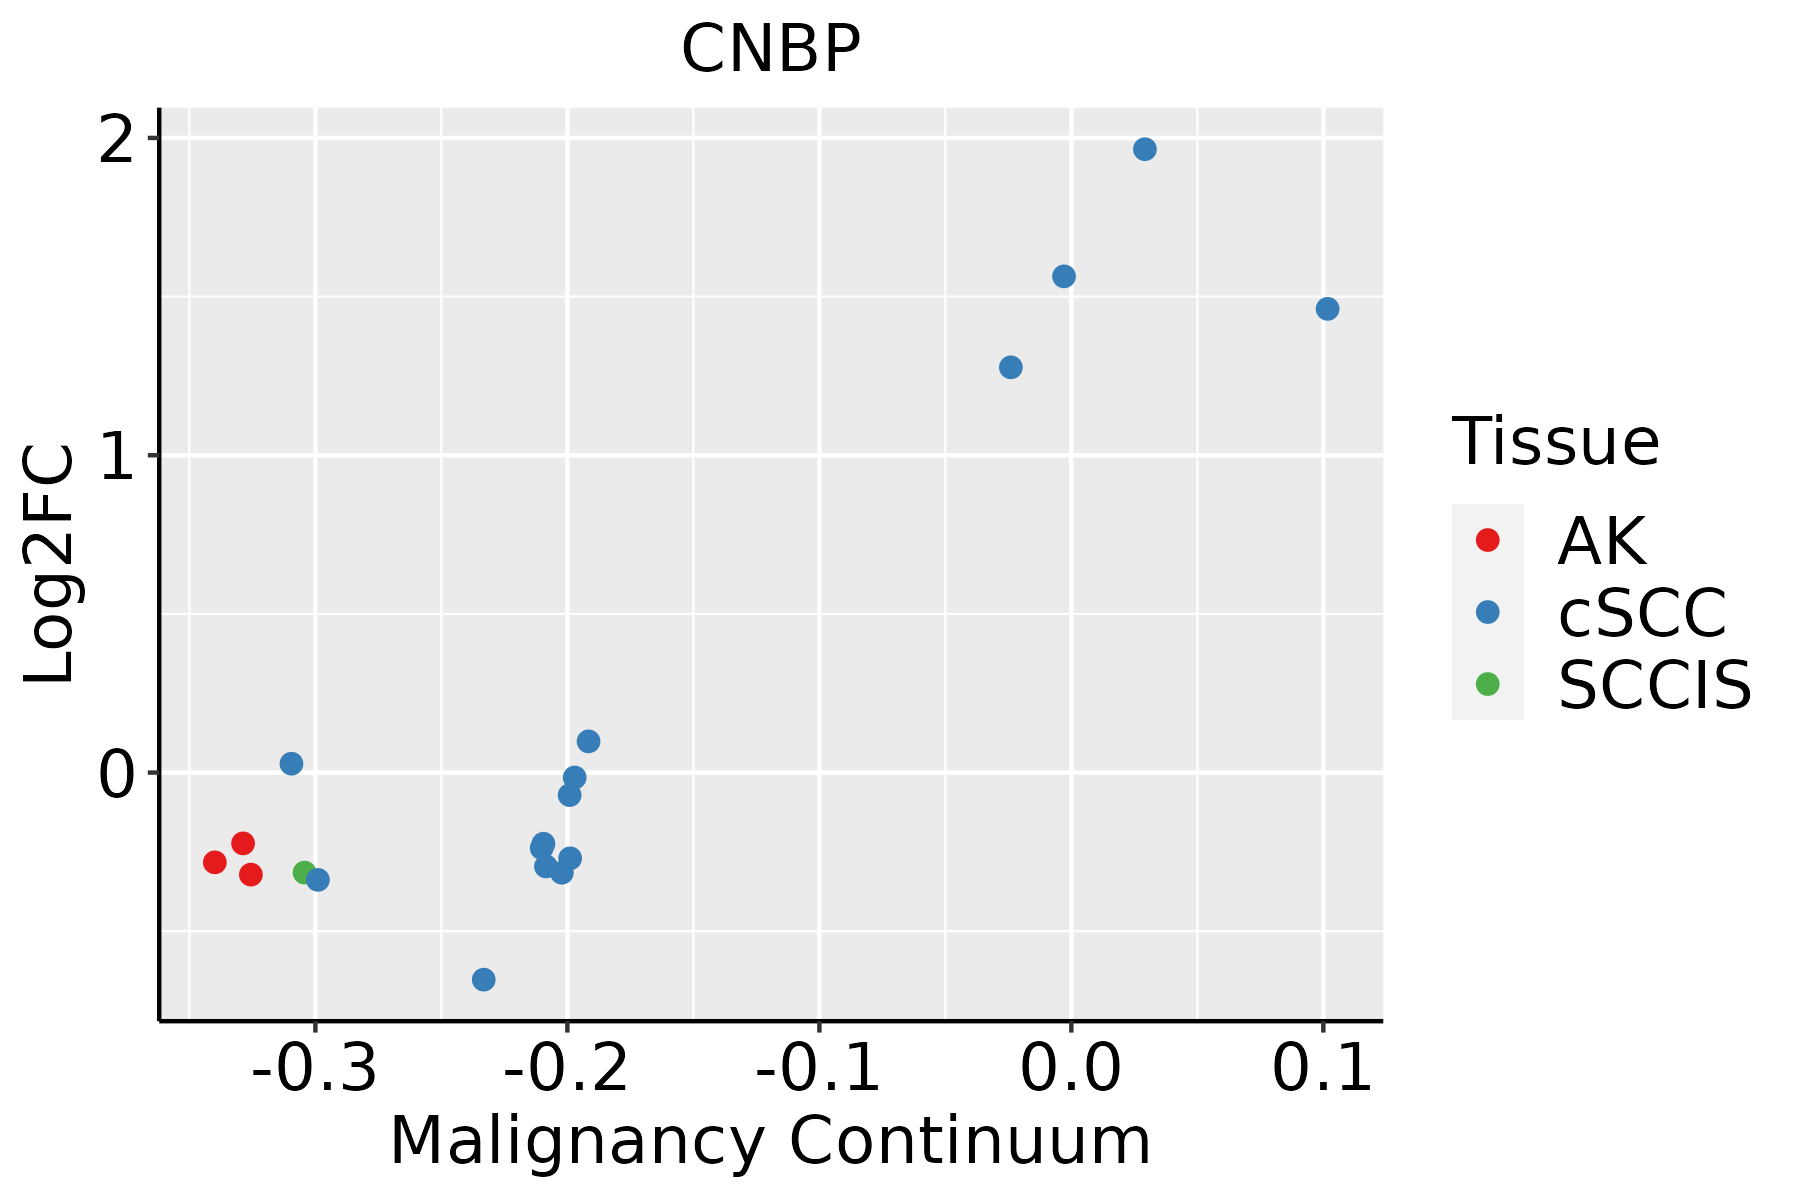
AK: Actinic keratosis
cSCC: Cutaneous squamous cell carcinoma
SCCIS:squamous cell carcinoma in situ
ThyroidThe image shows the transcriptomic changes along malignancy continuum.log2FC in expression of this searched gene in stem-like cells from each diseased tissue sample relative to stem-like cells in normal samples in each tissue plotted against the malignancy continuum. Samples are colored based on if they are from different disease stage.ATC: Anaplastic thyroid cancer
HT: Hashimoto's thyroiditis
PTC: Papillary thyroid cancer
∗log2FC in expression of this searched gene in stem-like cells from each diseased tissue sample relative to stem-like cells in normal samples in each tissue plotted against the malignancy continuum. Samples are colored based on if they are from different disease stage.

Top

Malignant transformation related pathway analysis

check buttonFind out the enriched GO biological processes and KEGG pathways involved in transition from healthy to precancer to cancer
check button Figure of enriched GO biological processes.
TissueDisease StageEnriched GO biological Processes
ColorectumADGO analysis - Figure of enriched GO biological processes: Top 15 enriched GO BP terms are showed in the bar plot of each disease state in each tissue. Each row represents a significant GO biological process which is colored according to the -log10(p.adjust).
ColorectumSERGO analysis - Figure of enriched GO biological processes: Top 15 enriched GO BP terms are showed in the bar plot of each disease state in each tissue. Each row represents a significant GO biological process which is colored according to the -log10(p.adjust).
ColorectumMSSGO analysis - Figure of enriched GO biological processes: Top 15 enriched GO BP terms are showed in the bar plot of each disease state in each tissue. Each row represents a significant GO biological process which is colored according to the -log10(p.adjust).
ColorectumMSI-HGO analysis - Figure of enriched GO biological processes: Top 15 enriched GO BP terms are showed in the bar plot of each disease state in each tissue. Each row represents a significant GO biological process which is colored according to the -log10(p.adjust).
ColorectumFAPGO analysis - Figure of enriched GO biological processes: Top 15 enriched GO BP terms are showed in the bar plot of each disease state in each tissue. Each row represents a significant GO biological process which is colored according to the -log10(p.adjust).
∗Top 15 enriched GO BP terms are showed in the bar plot of each disease state in each tissue. Each row represents a significant GO biological process which is colored according to the -log10(p.adjust).
Page: 1 2 3 4 5 6 7 8 9 

check button Enriched GO biological processes.
GO IDTissueDisease StageDescriptionGene RatioBg Ratiopvaluep.adjustCount
GO:00021819BreastPrecancercytoplasmic translation80/1080148/187231.59e-598.54e-5680
GO:00064179BreastPrecancerregulation of translation67/1080468/187234.71e-127.64e-1067
GO:00457279BreastPrecancerpositive regulation of translation32/1080136/187235.89e-129.27e-1032
GO:00342509BreastPrecancerpositive regulation of cellular amide metabolic process33/1080162/187231.72e-101.77e-0833
GO:000218114BreastIDCcytoplasmic translation82/1434148/187232.60e-521.48e-4882
GO:000641714BreastIDCregulation of translation74/1434468/187231.67e-091.53e-0774
GO:004572714BreastIDCpositive regulation of translation33/1434136/187231.92e-091.73e-0733
GO:003425014BreastIDCpositive regulation of cellular amide metabolic process35/1434162/187231.63e-081.16e-0635
GO:000218124BreastDCIScytoplasmic translation82/1390148/187232.21e-531.25e-4982
GO:000641724BreastDCISregulation of translation72/1390468/187232.46e-092.17e-0772
GO:004572724BreastDCISpositive regulation of translation32/1390136/187233.56e-093.10e-0732
GO:003425023BreastDCISpositive regulation of cellular amide metabolic process34/1390162/187232.60e-081.73e-0634
GO:000218116EndometriumAEHcytoplasmic translation104/2100148/187231.01e-646.07e-61104
GO:000641716EndometriumAEHregulation of translation94/2100468/187231.14e-087.62e-0794
GO:004572715EndometriumAEHpositive regulation of translation38/2100136/187236.37e-083.38e-0638
GO:003425015EndometriumAEHpositive regulation of cellular amide metabolic process42/2100162/187231.35e-076.12e-0642
GO:000218117EndometriumEECcytoplasmic translation104/2168148/187232.53e-631.52e-59104
GO:000641717EndometriumEECregulation of translation94/2168468/187235.37e-082.88e-0694
GO:004572716EndometriumEECpositive regulation of translation38/2168136/187231.47e-076.89e-0638
GO:003425016EndometriumEECpositive regulation of cellular amide metabolic process42/2168162/187233.24e-071.32e-0542
Page: 1 2 3 4 5 6 7 8 

check button Enriched KEGG pathways.
Pathway IDTissueDisease StageDescriptionGene RatioBg Ratiopvaluep.adjustqvalueCount
Page: 1 

Top

Cell-cell communication analysis

check buttonIdentification of potential cell-cell interactions between two cell types and their ligand-receptor pairs for different disease states
LigandReceptorLRpairPathwayTissueDisease Stage
Page: 1 

Top

Single-cell gene regulatory network inference analysis

check buttonFind out the significant the regulons (TFs) and the target genes of each regulon across cell types for different disease states
TFCell TypeTissueDisease StageTarget GeneRSSRegulon Activity
∗The dot plots of a searched regulon are shown for all cell subpopulations in each disease state of each tissue based on the regulon specific score inferred using pySCENIC and by calculating the average expression.
Page: 1 

Top

Somatic mutation of malignant transformation related genes

check buttonAnnotation of somatic variants for genes involved in malignant transformation
Hugo SymbolVariant ClassVariant ClassificationdbSNP RSHGVScHGVSpHGVSp ShortSWISSPROTBIOTYPESIFTPolyPhenTumor Sample BarcodeTissueHistologySexAgeStageTherapy TypesDrugsOutcome
CNBPinsertionIn_Frame_Insnovelc.20_21insAGAAGAAAACTCATTGCAGAGATTCTTCCAGAGATGp.Phe7delinsLeuGluGluAsnSerLeuGlnArgPhePheGlnArgCysp.F7delinsLEENSLQRFFQRCP62633protein_codingTCGA-A2-A0T2-01Breastbreast invasive carcinomaFemale>=65III/IVChemotherapyxelodaPD
CNBPSNVMissense_Mutationc.245N>Ap.Gly82Aspp.G82DP62633protein_codingtolerated(0.07)benign(0.345)TCGA-AZ-6601-01Colorectumcolon adenocarcinomaMale>=65I/IIUnknownUnknownPD
CNBPSNVMissense_Mutationnovelc.304N>Gp.Asn102Aspp.N102DP62633protein_codingtolerated(0.19)benign(0.331)TCGA-A5-A0G1-01Endometriumuterine corpus endometrioid carcinomaFemale>=65I/IIUnknownUnknownSD
CNBPSNVMissense_Mutationc.518N>Tp.Cys173Phep.C173FP62633protein_codingdeleterious(0)probably_damaging(1)TCGA-A5-A0G9-01Endometriumuterine corpus endometrioid carcinomaFemale>=65I/IIUnknownUnknownSD
CNBPSNVMissense_Mutationnovelc.80G>Ap.Arg27Hisp.R27HP62633protein_codingtolerated(0.34)benign(0.022)TCGA-AJ-A3OK-01Endometriumuterine corpus endometrioid carcinomaFemale>=65I/IIChemotherapycarboplatinCR
CNBPSNVMissense_Mutationc.223N>Tp.Ala75Serp.A75SP62633protein_codingtolerated(0.39)benign(0.047)TCGA-AP-A051-01Endometriumuterine corpus endometrioid carcinomaFemale>=65I/IIUnknownUnknownSD
CNBPSNVMissense_Mutationnovelc.103G>Ap.Gly35Serp.G35SP62633protein_codingtolerated(0.14)benign(0.074)TCGA-AP-A1DK-01Endometriumuterine corpus endometrioid carcinomaFemale<65I/IIUnknownUnknownSD
CNBPSNVMissense_Mutationnovelc.52N>Ap.Glu18Lysp.E18KP62633protein_codingtolerated(0.54)benign(0.186)TCGA-AP-A1DV-01Endometriumuterine corpus endometrioid carcinomaFemale<65I/IIUnknownUnknownSD
CNBPSNVMissense_Mutationnovelc.103N>Tp.Gly35Cysp.G35CP62633protein_codingdeleterious(0.01)benign(0.354)TCGA-EO-A22R-01Endometriumuterine corpus endometrioid carcinomaFemale<65I/IIUnknownUnknownSD
CNBPSNVMissense_Mutationc.419A>Gp.Tyr140Cysp.Y140CP62633protein_codingdeleterious(0)possibly_damaging(0.449)TCGA-55-A490-01Lunglung adenocarcinomaMale>=65I/IIChemotherapycarboplatinSD
Page: 1 2 

Top

Related drugs of malignant transformation related genes

check buttonIdentification of chemicals and drugs interact with genes involved in malignant transfromation
(DGIdb 4.0)
Entrez IDSymbolCategoryInteraction TypesDrug Claim NameDrug NamePMIDs
Page: 1