
|
|||||
|
 | |
| |
| |
| |
| |
| |
|
Gene: CNBD2 |
Gene summary for CNBD2 |
| Gene information | Species | Human | Gene symbol | CNBD2 | Gene ID | 140894 |
| Gene name | cyclic nucleotide binding domain containing 2 | |
| Gene Alias | C20orf152 | |
| Cytomap | 20q11.23 | |
| Gene Type | protein-coding | GO ID | GO:0000003 | UniProtAcc | Q96M20 |
Top |
Malignant transformation analysis |
| Identification of the aberrant gene expression in precancerous and cancerous lesions by comparing the gene expression of stem-like cells in diseased tissues with normal stem cells |
| Entrez ID | Symbol | Replicates | Species | Organ | Tissue | Adj P-value | Log2FC | Malignancy |
| 140894 | CNBD2 | HCC1_Meng | Human | Liver | HCC | 1.94e-31 | 4.18e-02 | 0.0246 |
| 140894 | CNBD2 | S014 | Human | Liver | HCC | 2.43e-17 | 6.39e-01 | 0.2254 |
| 140894 | CNBD2 | S015 | Human | Liver | HCC | 2.17e-10 | 6.34e-01 | 0.2375 |
| 140894 | CNBD2 | S016 | Human | Liver | HCC | 1.85e-15 | 6.18e-01 | 0.2243 |
| 140894 | CNBD2 | S028 | Human | Liver | HCC | 3.38e-03 | 2.49e-01 | 0.2503 |
| 140894 | CNBD2 | C04 | Human | Oral cavity | OSCC | 2.66e-02 | 2.31e-01 | 0.2633 |
| 140894 | CNBD2 | C30 | Human | Oral cavity | OSCC | 9.41e-06 | 3.18e-01 | 0.3055 |
| 140894 | CNBD2 | C43 | Human | Oral cavity | OSCC | 5.23e-08 | 2.02e-01 | 0.1704 |
| 140894 | CNBD2 | C46 | Human | Oral cavity | OSCC | 2.09e-02 | 1.85e-01 | 0.1673 |
| 140894 | CNBD2 | C08 | Human | Oral cavity | OSCC | 5.50e-07 | 1.98e-01 | 0.1919 |
| 140894 | CNBD2 | LN22 | Human | Oral cavity | OSCC | 3.85e-08 | 1.02e+00 | 0.1733 |
| 140894 | CNBD2 | LP15 | Human | Oral cavity | LP | 9.32e-03 | 5.26e-01 | 0.2174 |
| 140894 | CNBD2 | SYSMH1 | Human | Oral cavity | OSCC | 8.48e-05 | 1.31e-01 | 0.1127 |
| Page: 1 |
| Tissue | Expression Dynamics | Abbreviation |
| Liver |  | HCC: Hepatocellular carcinoma |
| NAFLD: Non-alcoholic fatty liver disease | ||
| Oral Cavity | 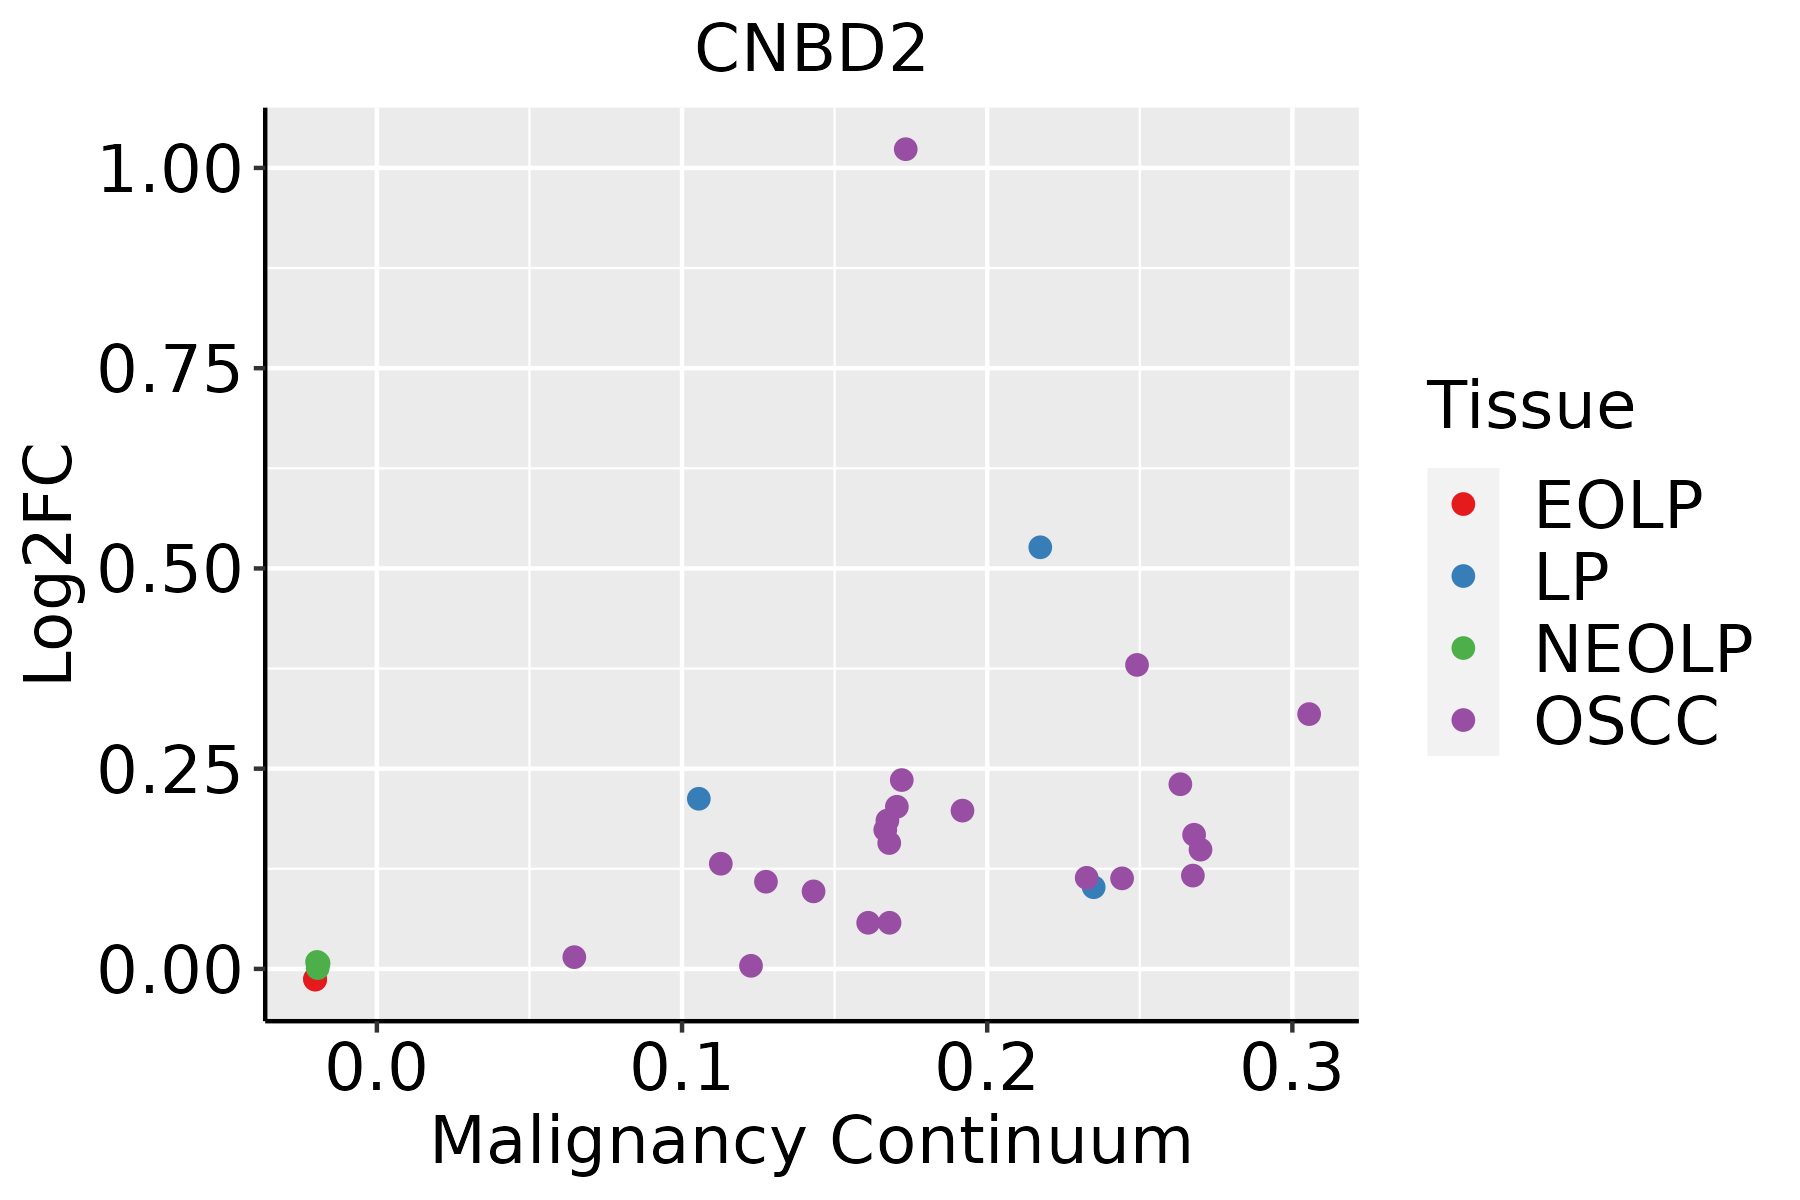 | EOLP: Erosive Oral lichen planus |
| LP: leukoplakia | ||
| NEOLP: Non-erosive oral lichen planus | ||
| OSCC: Oral squamous cell carcinoma |
| ∗log2FC in expression of this searched gene in stem-like cells from each diseased tissue sample relative to stem-like cells in normal samples in each tissue plotted against the malignancy continuum. Samples are colored based on if they are from different disease stage. |
Top |
Malignant transformation related pathway analysis |
| Find out the enriched GO biological processes and KEGG pathways involved in transition from healthy to precancer to cancer |
| Tissue | Disease Stage | Enriched GO biological Processes |
| Colorectum | AD |  |
| Colorectum | SER |  |
| Colorectum | MSS |  |
| Colorectum | MSI-H |  |
| Colorectum | FAP |  |
| ∗Top 15 enriched GO BP terms are showed in the bar plot of each disease state in each tissue. Each row represents a significant GO biological process which is colored according to the -log10(p.adjust). |
| Page: 1 2 3 4 5 6 7 8 9 |
| GO ID | Tissue | Disease Stage | Description | Gene Ratio | Bg Ratio | pvalue | p.adjust | Count |
| Page: 1 |
| Pathway ID | Tissue | Disease Stage | Description | Gene Ratio | Bg Ratio | pvalue | p.adjust | qvalue | Count |
| Page: 1 |
Top |
Cell-cell communication analysis |
| Identification of potential cell-cell interactions between two cell types and their ligand-receptor pairs for different disease states |
| Ligand | Receptor | LRpair | Pathway | Tissue | Disease Stage |
| Page: 1 |
Top |
Single-cell gene regulatory network inference analysis |
| Find out the significant the regulons (TFs) and the target genes of each regulon across cell types for different disease states |
| TF | Cell Type | Tissue | Disease Stage | Target Gene | RSS | Regulon Activity |
| ∗The dot plots of a searched regulon are shown for all cell subpopulations in each disease state of each tissue based on the regulon specific score inferred using pySCENIC and by calculating the average expression. |
| Page: 1 |
Top |
Somatic mutation of malignant transformation related genes |
| Annotation of somatic variants for genes involved in malignant transformation |
| Hugo Symbol | Variant Class | Variant Classification | dbSNP RS | HGVSc | HGVSp | HGVSp Short | SWISSPROT | BIOTYPE | SIFT | PolyPhen | Tumor Sample Barcode | Tissue | Histology | Sex | Age | Stage | Therapy Types | Drugs | Outcome |
| CNBD2 | SNV | Missense_Mutation | c.243G>T | p.Glu81Asp | p.E81D | Q96M20 | protein_coding | tolerated(0.06) | benign(0.116) | TCGA-AO-A128-01 | Breast | breast invasive carcinoma | Female | <65 | I/II | Chemotherapy | doxorubicin | SD | |
| CNBD2 | deletion | Frame_Shift_Del | c.1397delA | p.Lys466SerfsTer3 | p.K466Sfs*3 | Q96M20 | protein_coding | TCGA-D8-A1XQ-01 | Breast | breast invasive carcinoma | Female | >=65 | I/II | Unknown | Unknown | SD | |||
| CNBD2 | SNV | Missense_Mutation | novel | c.307N>A | p.Glu103Lys | p.E103K | Q96M20 | protein_coding | deleterious(0) | possibly_damaging(0.725) | TCGA-2W-A8YY-01 | Cervix | cervical & endocervical cancer | Female | <65 | I/II | Chemotherapy | cisplatin | CR |
| CNBD2 | SNV | Missense_Mutation | c.670N>A | p.Asp224Asn | p.D224N | Q96M20 | protein_coding | tolerated(0.15) | possibly_damaging(0.881) | TCGA-DR-A0ZM-01 | Cervix | cervical & endocervical cancer | Female | <65 | III/IV | Unspecific | Cisplatin | SD | |
| CNBD2 | SNV | Missense_Mutation | c.989N>A | p.Arg330Lys | p.R330K | Q96M20 | protein_coding | tolerated(0.11) | possibly_damaging(0.819) | TCGA-EK-A2RK-01 | Cervix | cervical & endocervical cancer | Female | >=65 | I/II | Unknown | Unknown | SD | |
| CNBD2 | SNV | Missense_Mutation | c.1252N>C | p.Glu418Gln | p.E418Q | Q96M20 | protein_coding | tolerated(0.28) | benign(0.172) | TCGA-Q1-A73O-01 | Cervix | cervical & endocervical cancer | Female | <65 | I/II | Chemotherapy | cisplatin | CR | |
| CNBD2 | SNV | Missense_Mutation | novel | c.181N>C | p.Phe61Leu | p.F61L | Q96M20 | protein_coding | tolerated(0.12) | possibly_damaging(0.647) | TCGA-VS-A958-01 | Cervix | cervical & endocervical cancer | Female | <65 | I/II | Chemotherapy | cisplatin | CR |
| CNBD2 | SNV | Missense_Mutation | rs373220798 | c.1690C>T | p.Arg564Trp | p.R564W | Q96M20 | protein_coding | deleterious(0) | probably_damaging(0.997) | TCGA-ZJ-AAXT-01 | Cervix | cervical & endocervical cancer | Female | <65 | III/IV | Unknown | Unknown | SD |
| CNBD2 | SNV | Missense_Mutation | c.542T>G | p.Leu181Arg | p.L181R | Q96M20 | protein_coding | deleterious(0) | probably_damaging(1) | TCGA-CM-5861-01 | Colorectum | colon adenocarcinoma | Female | <65 | I/II | Unknown | Unknown | PD | |
| CNBD2 | SNV | Missense_Mutation | rs200885142 | c.415N>T | p.Arg139Cys | p.R139C | Q96M20 | protein_coding | deleterious(0.01) | benign(0.065) | TCGA-D5-6540-01 | Colorectum | colon adenocarcinoma | Male | >=65 | I/II | Unknown | Unknown | SD |
| Page: 1 2 3 4 5 6 7 |
Top |
Related drugs of malignant transformation related genes |
| Identification of chemicals and drugs interact with genes involved in malignant transfromation |
| (DGIdb 4.0) |
| Entrez ID | Symbol | Category | Interaction Types | Drug Claim Name | Drug Name | PMIDs |
| Page: 1 |

Copyright 2023-Present -The University of Texas Health Science Center at Houston |