
|
|||||
|
 | |
| |
| |
| |
| |
| |
|
Gene: CMYA5 |
Gene summary for CMYA5 |
| Gene information | Species | Human | Gene symbol | CMYA5 | Gene ID | 202333 |
| Gene name | cardiomyopathy associated 5 | |
| Gene Alias | C5orf10 | |
| Cytomap | 5q14.1 | |
| Gene Type | protein-coding | GO ID | GO:0005575 | UniProtAcc | Q8N3K9 |
Top |
Malignant transformation analysis |
| Identification of the aberrant gene expression in precancerous and cancerous lesions by comparing the gene expression of stem-like cells in diseased tissues with normal stem cells |
| Entrez ID | Symbol | Replicates | Species | Organ | Tissue | Adj P-value | Log2FC | Malignancy |
| 202333 | CMYA5 | GSM4909298 | Human | Breast | IDC | 1.96e-13 | 3.41e-01 | 0.1551 |
| 202333 | CMYA5 | GSM4909317 | Human | Breast | IDC | 3.15e-09 | 4.43e-01 | 0.1355 |
| 202333 | CMYA5 | M1 | Human | Breast | IDC | 1.15e-16 | 7.58e-01 | 0.1577 |
| 202333 | CMYA5 | P1 | Human | Breast | IDC | 2.24e-06 | 3.16e-01 | 0.1527 |
| 202333 | CMYA5 | DCIS2 | Human | Breast | DCIS | 8.92e-71 | 6.54e-01 | 0.0085 |
| 202333 | CMYA5 | GSM5252136_BPH556PrGA1_Fcol | Human | Prostate | BPH | 2.86e-02 | 1.90e-01 | -0.23 |
| 202333 | CMYA5 | GSM5252137_BPH556PrGA2_Fcol | Human | Prostate | BPH | 3.16e-02 | 1.80e-01 | -0.23 |
| 202333 | CMYA5 | 052095_1628-all-cells | Human | Prostate | BPH | 8.29e-07 | 2.14e-01 | 0.1032 |
| 202333 | CMYA5 | Dong_P1 | Human | Prostate | Tumor | 7.87e-11 | 1.51e-01 | 0.035 |
| 202333 | CMYA5 | Dong_P3 | Human | Prostate | Tumor | 9.69e-03 | 7.12e-02 | 0.0278 |
| 202333 | CMYA5 | Dong_P4 | Human | Prostate | Tumor | 2.24e-03 | 2.49e-01 | 0.0292 |
| 202333 | CMYA5 | GSM5353221_PA_PB2A_Pool_1_3_S25_L001 | Human | Prostate | Tumor | 3.01e-04 | 4.69e-01 | 0.1633 |
| 202333 | CMYA5 | GSM5353222_PA_PB2B_Pool_1_3_S52_L002 | Human | Prostate | Tumor | 4.59e-13 | 6.84e-01 | 0.1608 |
| 202333 | CMYA5 | GSM5353223_PA_PB2B_Pool_2_S26_L001 | Human | Prostate | Tumor | 2.19e-09 | 7.09e-01 | 0.1604 |
| 202333 | CMYA5 | GSM5353224_PA_PR5186_Pool_1_2_3_S27_L001 | Human | Prostate | Tumor | 1.01e-04 | 5.23e-01 | 0.1621 |
| 202333 | CMYA5 | GSM5353240_PA_PR5254_T1_S15_L001 | Human | Prostate | Tumor | 7.10e-06 | 4.50e-01 | 0.1575 |
| 202333 | CMYA5 | male-WTA | Human | Thyroid | PTC | 7.20e-19 | 2.42e-01 | 0.1037 |
| 202333 | CMYA5 | PTC01 | Human | Thyroid | PTC | 1.26e-13 | 2.29e-01 | 0.1899 |
| 202333 | CMYA5 | PTC03 | Human | Thyroid | PTC | 1.69e-19 | 1.02e+00 | 0.1784 |
| 202333 | CMYA5 | PTC04 | Human | Thyroid | PTC | 9.24e-48 | 1.09e+00 | 0.1927 |
| Page: 1 2 |
| Tissue | Expression Dynamics | Abbreviation |
| Breast | 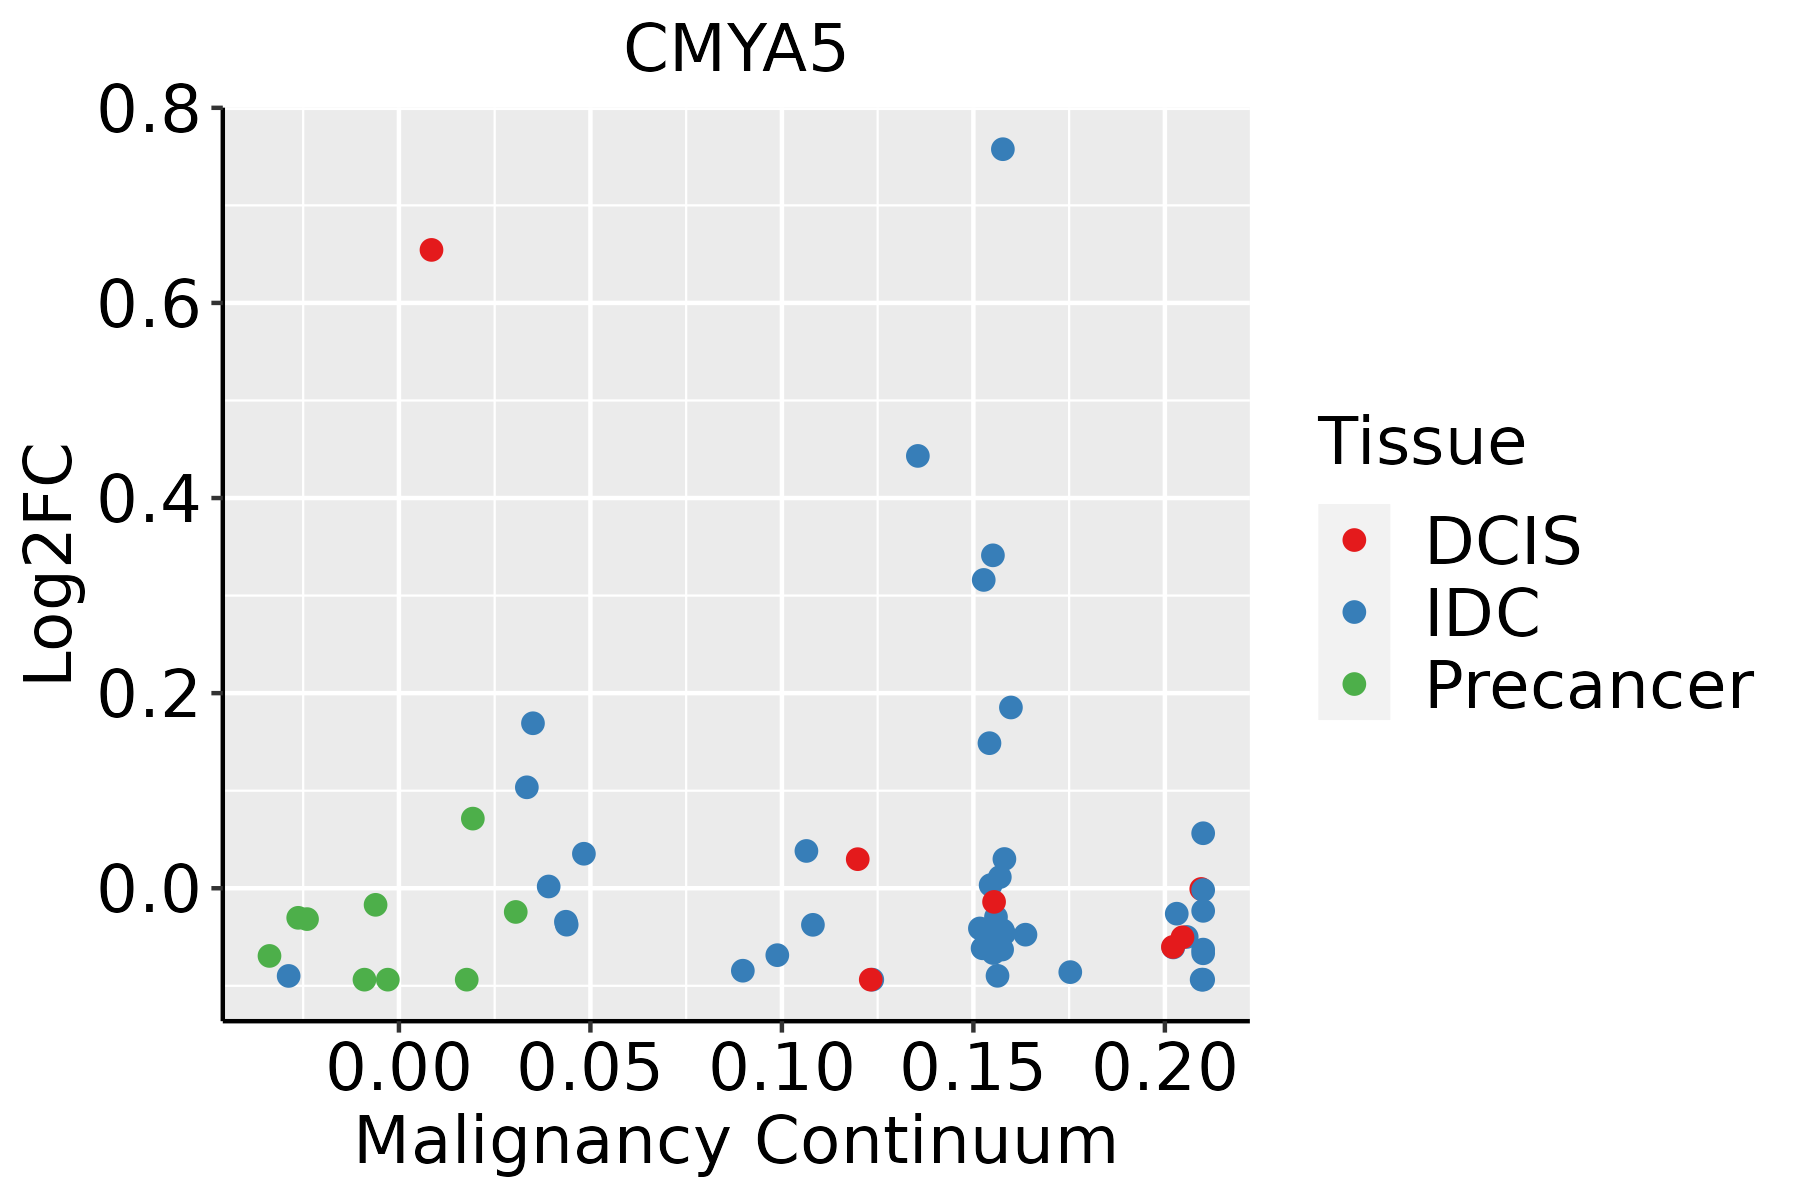 | IDC: Invasive ductal carcinoma |
| DCIS: Ductal carcinoma in situ | ||
| Precancer(BRCA1-mut): Precancerous lesion from BRCA1 mutation carriers | ||
| Prostate | 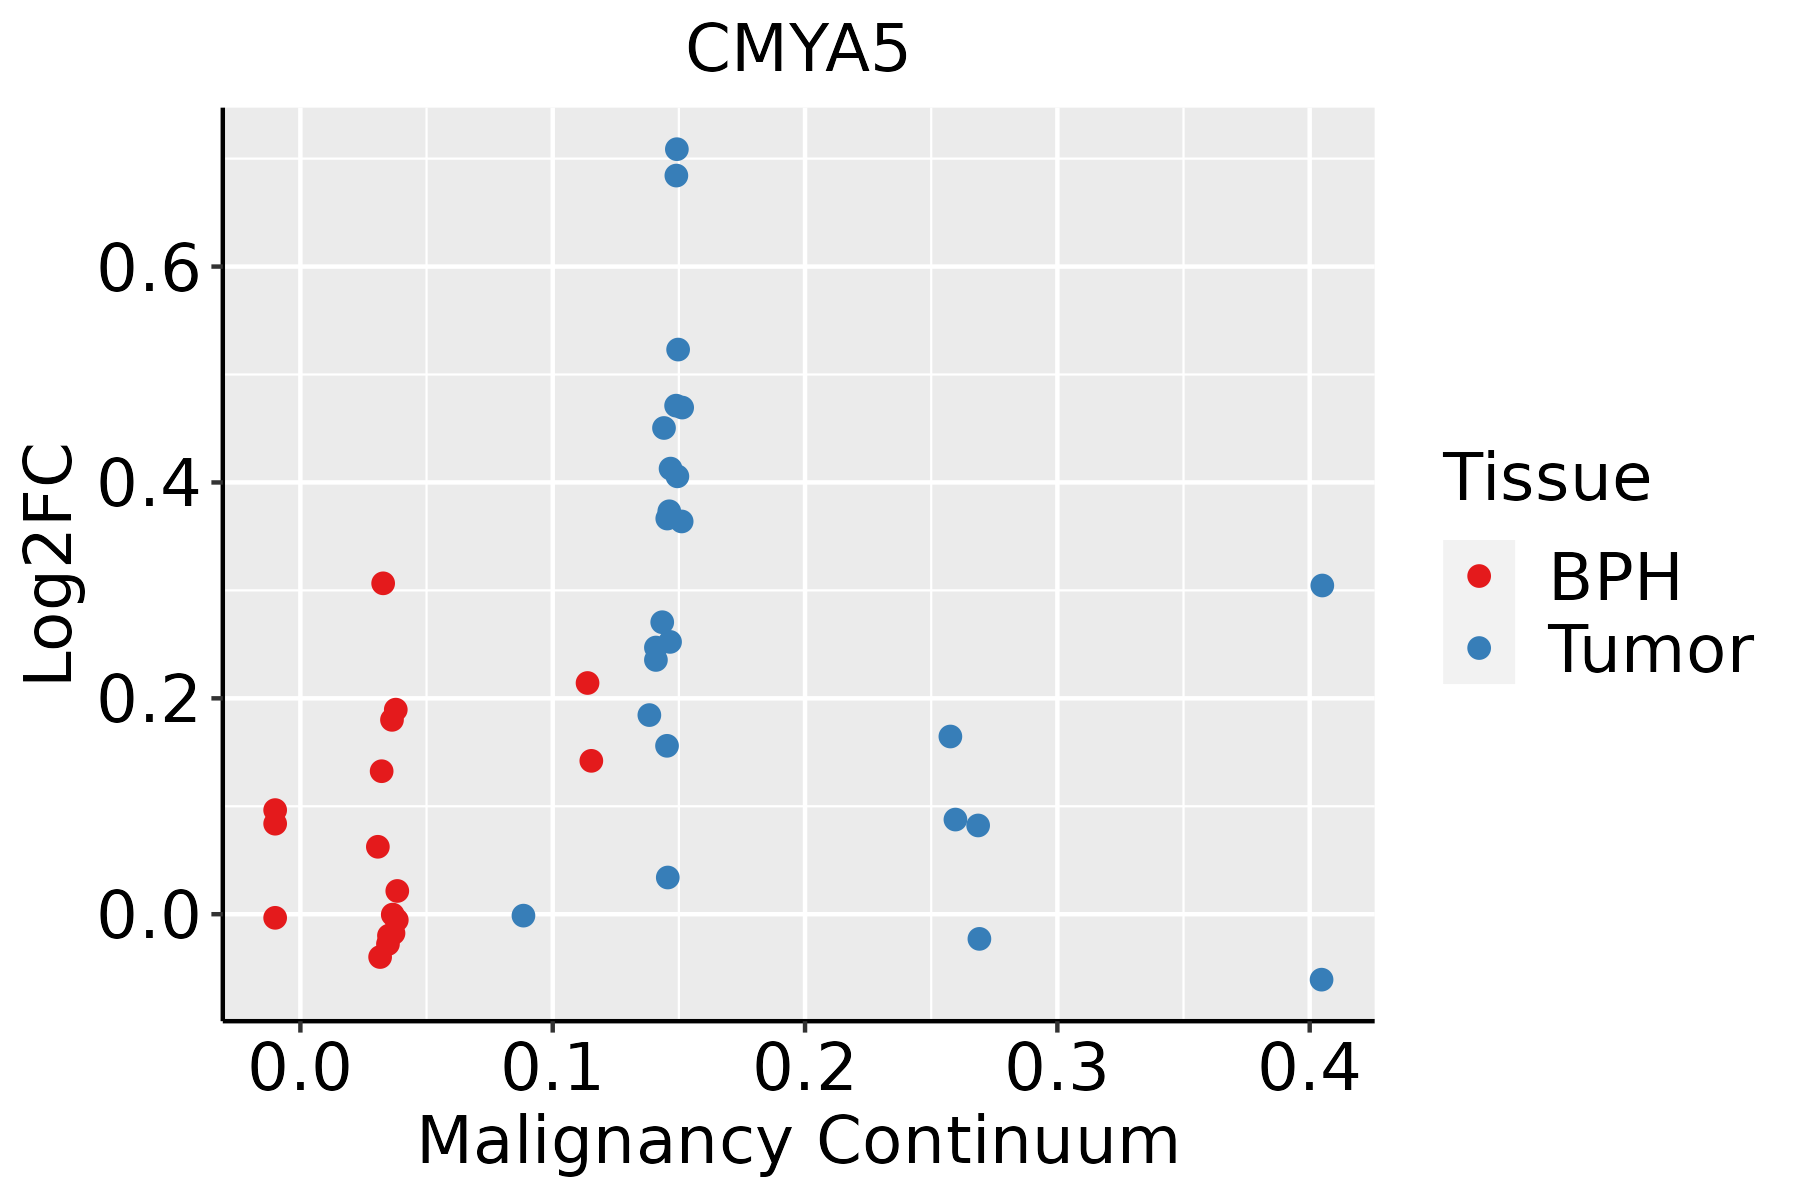 | BPH: Benign Prostatic Hyperplasia |
| Thyroid | 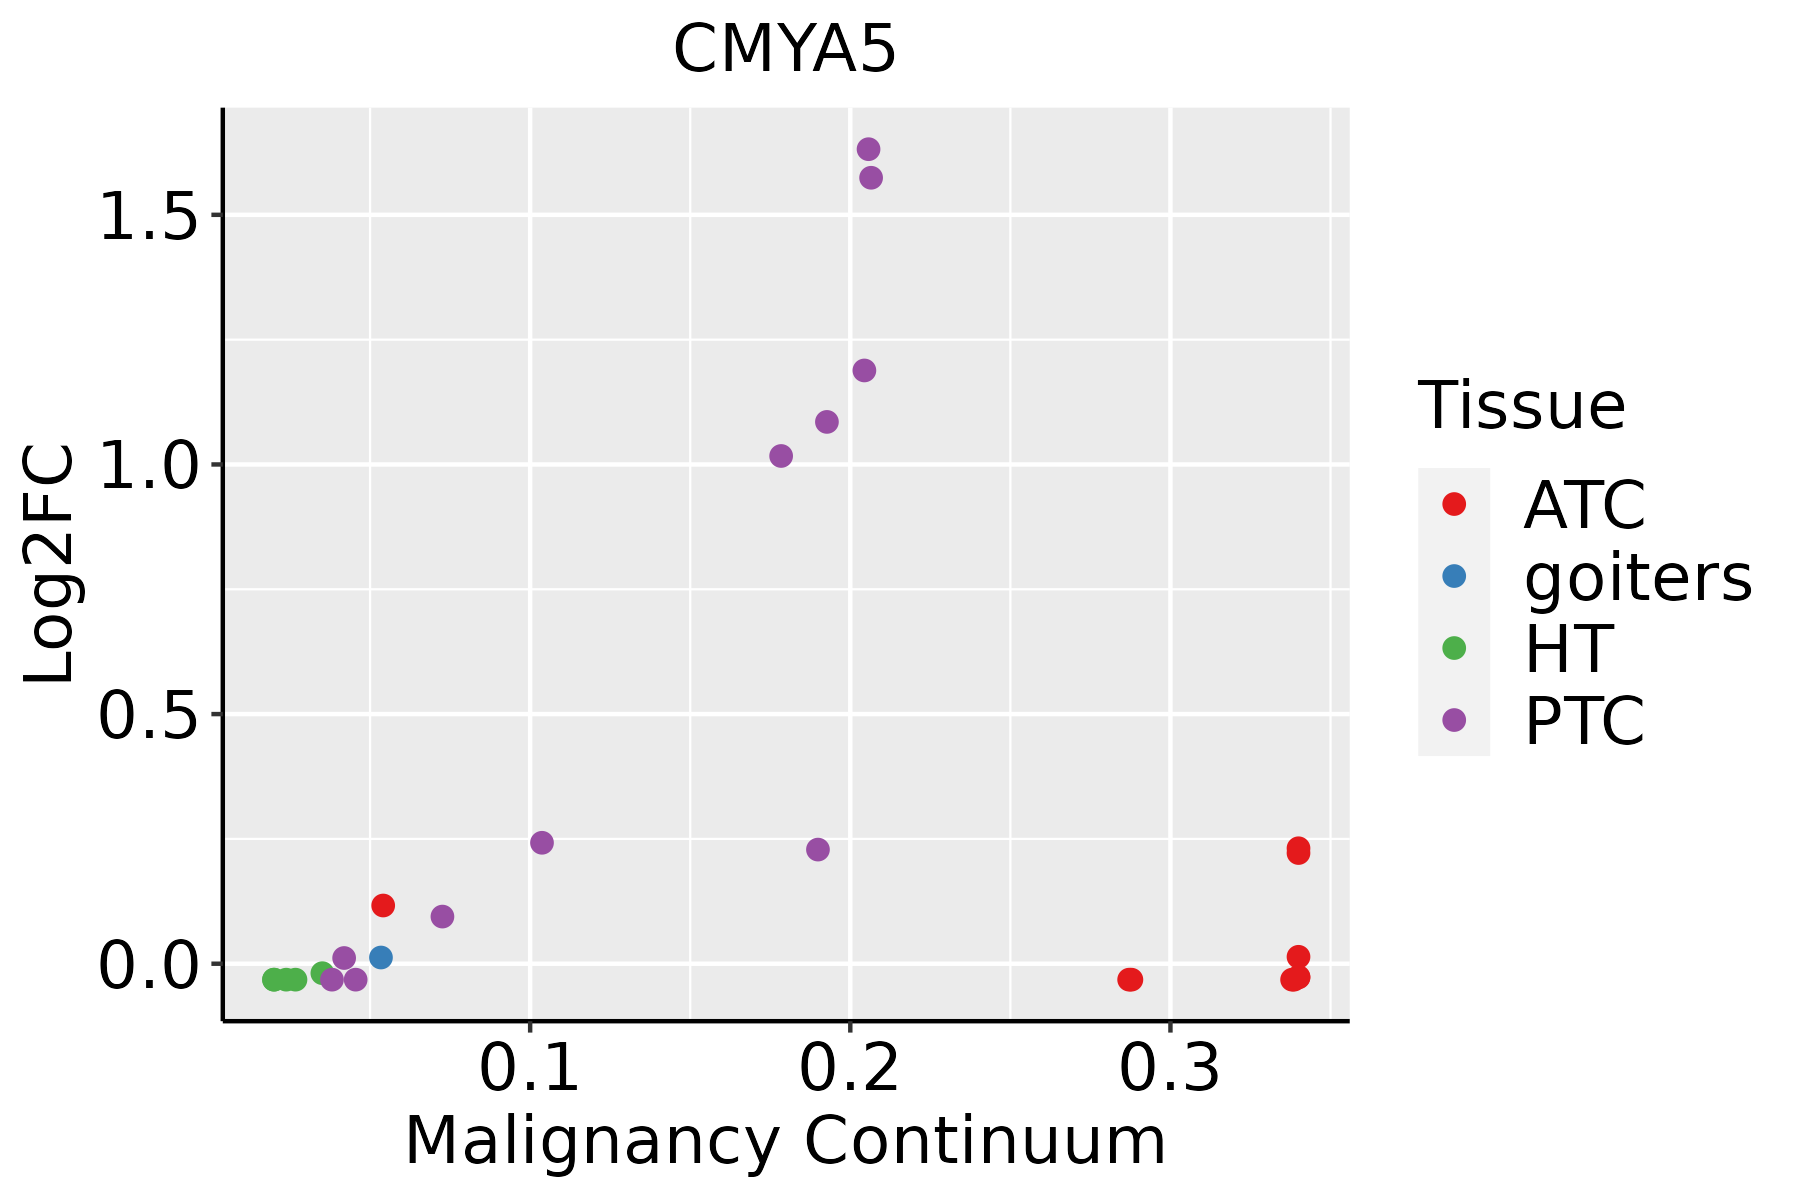 | ATC: Anaplastic thyroid cancer |
| HT: Hashimoto's thyroiditis | ||
| PTC: Papillary thyroid cancer |
| ∗log2FC in expression of this searched gene in stem-like cells from each diseased tissue sample relative to stem-like cells in normal samples in each tissue plotted against the malignancy continuum. Samples are colored based on if they are from different disease stage. |
Top |
Malignant transformation related pathway analysis |
| Find out the enriched GO biological processes and KEGG pathways involved in transition from healthy to precancer to cancer |
| Tissue | Disease Stage | Enriched GO biological Processes |
| Colorectum | AD |  |
| Colorectum | SER |  |
| Colorectum | MSS |  |
| Colorectum | MSI-H |  |
| Colorectum | FAP |  |
| ∗Top 15 enriched GO BP terms are showed in the bar plot of each disease state in each tissue. Each row represents a significant GO biological process which is colored according to the -log10(p.adjust). |
| Page: 1 2 3 4 5 6 7 8 9 |
| GO ID | Tissue | Disease Stage | Description | Gene Ratio | Bg Ratio | pvalue | p.adjust | Count |
| Page: 1 |
| Pathway ID | Tissue | Disease Stage | Description | Gene Ratio | Bg Ratio | pvalue | p.adjust | qvalue | Count |
| Page: 1 |
Top |
Cell-cell communication analysis |
| Identification of potential cell-cell interactions between two cell types and their ligand-receptor pairs for different disease states |
| Ligand | Receptor | LRpair | Pathway | Tissue | Disease Stage |
| Page: 1 |
Top |
Single-cell gene regulatory network inference analysis |
| Find out the significant the regulons (TFs) and the target genes of each regulon across cell types for different disease states |
| TF | Cell Type | Tissue | Disease Stage | Target Gene | RSS | Regulon Activity |
| ∗The dot plots of a searched regulon are shown for all cell subpopulations in each disease state of each tissue based on the regulon specific score inferred using pySCENIC and by calculating the average expression. |
| Page: 1 |
Top |
Somatic mutation of malignant transformation related genes |
| Annotation of somatic variants for genes involved in malignant transformation |
| Hugo Symbol | Variant Class | Variant Classification | dbSNP RS | HGVSc | HGVSp | HGVSp Short | SWISSPROT | BIOTYPE | SIFT | PolyPhen | Tumor Sample Barcode | Tissue | Histology | Sex | Age | Stage | Therapy Types | Drugs | Outcome |
| CMYA5 | SNV | Missense_Mutation | c.2903N>C | p.Arg968Thr | p.R968T | Q8N3K9 | protein_coding | deleterious(0) | probably_damaging(0.911) | TCGA-3C-AALI-01 | Breast | breast invasive carcinoma | Female | <65 | I/II | Unspecific | Poly E | Complete Response | |
| CMYA5 | SNV | Missense_Mutation | novel | c.2288N>G | p.Ser763Cys | p.S763C | Q8N3K9 | protein_coding | deleterious(0.01) | possibly_damaging(0.533) | TCGA-5L-AAT1-01 | Breast | breast invasive carcinoma | Female | <65 | III/IV | Hormone Therapy | letrozol | SD |
| CMYA5 | SNV | Missense_Mutation | novel | c.10102N>A | p.Glu3368Lys | p.E3368K | Q8N3K9 | protein_coding | deleterious(0) | benign(0.356) | TCGA-5L-AAT1-01 | Breast | breast invasive carcinoma | Female | <65 | III/IV | Hormone Therapy | letrozol | SD |
| CMYA5 | SNV | Missense_Mutation | rs770958823 | c.7807G>A | p.Ala2603Thr | p.A2603T | Q8N3K9 | protein_coding | tolerated_low_confidence(0.16) | benign(0) | TCGA-A2-A0CV-01 | Breast | breast invasive carcinoma | Female | <65 | I/II | Chemotherapy | cytoxan | SD |
| CMYA5 | SNV | Missense_Mutation | c.12076N>C | p.Glu4026Gln | p.E4026Q | Q8N3K9 | protein_coding | tolerated(0.1) | benign(0.153) | TCGA-A2-A0SY-01 | Breast | breast invasive carcinoma | Female | <65 | III/IV | Hormone Therapy | arimidex | SD | |
| CMYA5 | SNV | Missense_Mutation | novel | c.11608G>C | p.Asp3870His | p.D3870H | Q8N3K9 | protein_coding | deleterious(0.01) | probably_damaging(0.963) | TCGA-A2-A4S3-01 | Breast | breast invasive carcinoma | Female | <65 | I/II | Unknown | Unknown | SD |
| CMYA5 | SNV | Missense_Mutation | novel | c.12004G>T | p.Val4002Leu | p.V4002L | Q8N3K9 | protein_coding | deleterious(0.03) | benign(0.291) | TCGA-A7-A4SF-01 | Breast | breast invasive carcinoma | Female | <65 | I/II | Chemotherapy | carboplatin | CR |
| CMYA5 | SNV | Missense_Mutation | novel | c.12005T>G | p.Val4002Gly | p.V4002G | Q8N3K9 | protein_coding | deleterious(0) | probably_damaging(0.95) | TCGA-A7-A4SF-01 | Breast | breast invasive carcinoma | Female | <65 | I/II | Chemotherapy | carboplatin | CR |
| CMYA5 | SNV | Missense_Mutation | c.10753N>A | p.Glu3585Lys | p.E3585K | Q8N3K9 | protein_coding | deleterious(0.01) | probably_damaging(0.984) | TCGA-A8-A094-01 | Breast | breast invasive carcinoma | Female | >=65 | I/II | Unknown | Unknown | SD | |
| CMYA5 | SNV | Missense_Mutation | rs763544308 | c.11710N>G | p.Arg3904Gly | p.R3904G | Q8N3K9 | protein_coding | deleterious(0.03) | probably_damaging(0.972) | TCGA-A8-A09Z-01 | Breast | breast invasive carcinoma | Female | >=65 | I/II | Unknown | Unknown | SD |
| Page: 1 2 3 4 5 6 7 8 9 10 11 12 13 14 15 16 17 18 19 20 21 22 23 24 25 26 27 28 29 30 31 32 33 34 35 36 37 38 39 40 41 42 43 44 45 46 47 48 49 50 |
Top |
Related drugs of malignant transformation related genes |
| Identification of chemicals and drugs interact with genes involved in malignant transfromation |
| (DGIdb 4.0) |
| Entrez ID | Symbol | Category | Interaction Types | Drug Claim Name | Drug Name | PMIDs |
| Page: 1 |

Copyright 2023-Present -The University of Texas Health Science Center at Houston |