
|
|||||
|
 | |
| |
| |
| |
| |
| |
|
Gene: CMTR2 |
Gene summary for CMTR2 |
| Gene information | Species | Human | Gene symbol | CMTR2 | Gene ID | 55783 |
| Gene name | cap methyltransferase 2 | |
| Gene Alias | AFT | |
| Cytomap | 16q22.2 | |
| Gene Type | protein-coding | GO ID | GO:0001510 | UniProtAcc | Q8IYT2 |
Top |
Malignant transformation analysis |
| Identification of the aberrant gene expression in precancerous and cancerous lesions by comparing the gene expression of stem-like cells in diseased tissues with normal stem cells |
| Entrez ID | Symbol | Replicates | Species | Organ | Tissue | Adj P-value | Log2FC | Malignancy |
| 55783 | CMTR2 | C04 | Human | Oral cavity | OSCC | 6.53e-10 | 4.25e-01 | 0.2633 |
| 55783 | CMTR2 | C21 | Human | Oral cavity | OSCC | 1.96e-26 | 7.23e-01 | 0.2678 |
| 55783 | CMTR2 | C30 | Human | Oral cavity | OSCC | 1.23e-17 | 6.60e-01 | 0.3055 |
| 55783 | CMTR2 | C43 | Human | Oral cavity | OSCC | 1.39e-06 | 1.51e-01 | 0.1704 |
| 55783 | CMTR2 | C46 | Human | Oral cavity | OSCC | 2.63e-13 | 3.27e-01 | 0.1673 |
| 55783 | CMTR2 | C57 | Human | Oral cavity | OSCC | 2.24e-04 | 2.09e-01 | 0.1679 |
| 55783 | CMTR2 | C07 | Human | Oral cavity | OSCC | 1.36e-02 | 5.09e-01 | 0.2491 |
| 55783 | CMTR2 | C08 | Human | Oral cavity | OSCC | 4.11e-09 | 1.73e-01 | 0.1919 |
| 55783 | CMTR2 | LP15 | Human | Oral cavity | LP | 1.36e-02 | 5.09e-01 | 0.2174 |
| 55783 | CMTR2 | SYSMH1 | Human | Oral cavity | OSCC | 1.90e-02 | 1.33e-01 | 0.1127 |
| 55783 | CMTR2 | SYSMH2 | Human | Oral cavity | OSCC | 7.04e-06 | 2.31e-01 | 0.2326 |
| 55783 | CMTR2 | SYSMH3 | Human | Oral cavity | OSCC | 2.28e-11 | 3.15e-01 | 0.2442 |
| 55783 | CMTR2 | SYSMH5 | Human | Oral cavity | OSCC | 5.72e-10 | 2.79e-01 | 0.0647 |
| 55783 | CMTR2 | male-WTA | Human | Thyroid | PTC | 2.88e-04 | 3.38e-02 | 0.1037 |
| 55783 | CMTR2 | PTC01 | Human | Thyroid | PTC | 2.24e-15 | 1.84e-01 | 0.1899 |
| 55783 | CMTR2 | PTC04 | Human | Thyroid | PTC | 1.12e-14 | 2.79e-01 | 0.1927 |
| 55783 | CMTR2 | PTC05 | Human | Thyroid | PTC | 1.47e-13 | 5.23e-01 | 0.2065 |
| 55783 | CMTR2 | PTC06 | Human | Thyroid | PTC | 5.15e-23 | 5.46e-01 | 0.2057 |
| 55783 | CMTR2 | PTC07 | Human | Thyroid | PTC | 2.99e-23 | 3.44e-01 | 0.2044 |
| 55783 | CMTR2 | ATC09 | Human | Thyroid | ATC | 5.58e-08 | 2.10e-01 | 0.2871 |
| Page: 1 2 |
| Tissue | Expression Dynamics | Abbreviation |
| Oral Cavity |  | EOLP: Erosive Oral lichen planus |
| LP: leukoplakia | ||
| NEOLP: Non-erosive oral lichen planus | ||
| OSCC: Oral squamous cell carcinoma | ||
| Thyroid | 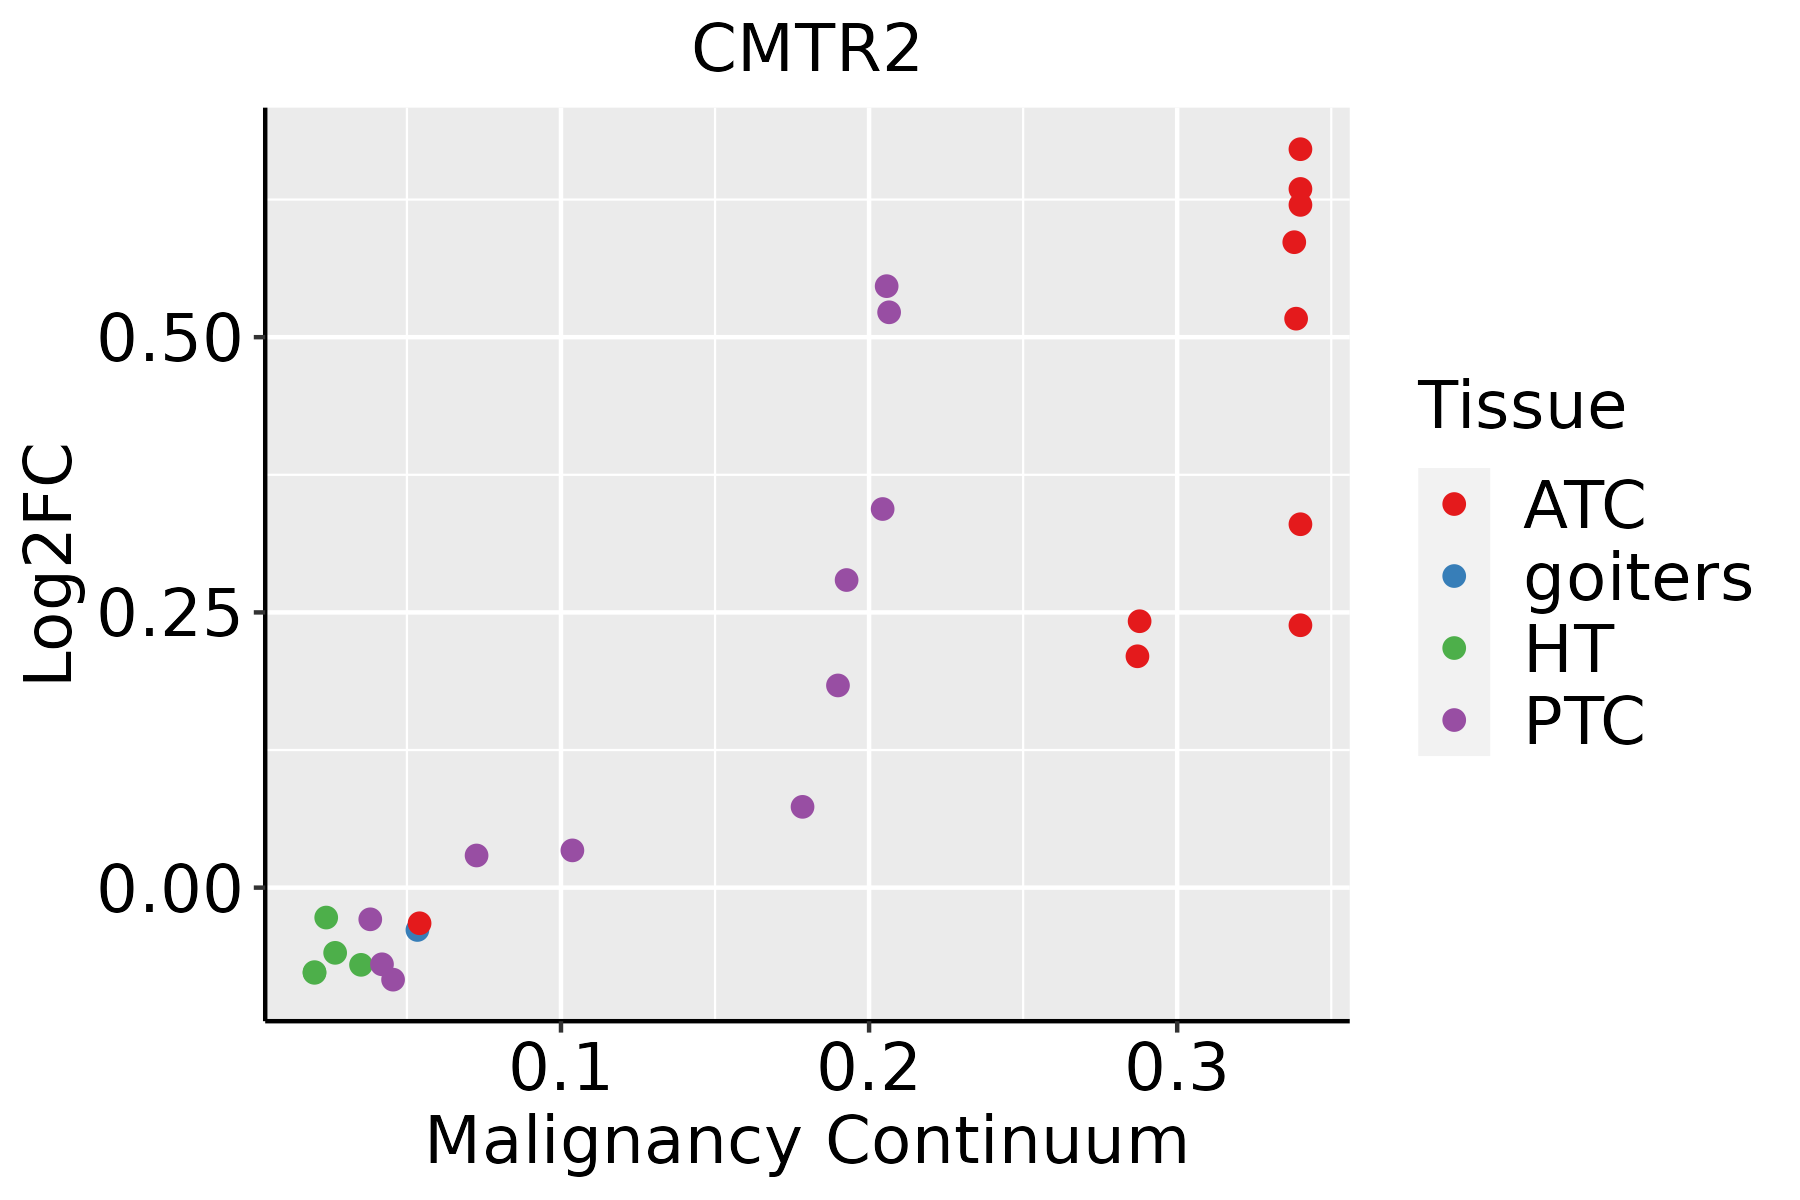 | ATC: Anaplastic thyroid cancer |
| HT: Hashimoto's thyroiditis | ||
| PTC: Papillary thyroid cancer |
| ∗log2FC in expression of this searched gene in stem-like cells from each diseased tissue sample relative to stem-like cells in normal samples in each tissue plotted against the malignancy continuum. Samples are colored based on if they are from different disease stage. |
Top |
Malignant transformation related pathway analysis |
| Find out the enriched GO biological processes and KEGG pathways involved in transition from healthy to precancer to cancer |
| Tissue | Disease Stage | Enriched GO biological Processes |
| Colorectum | AD |  |
| Colorectum | SER |  |
| Colorectum | MSS |  |
| Colorectum | MSI-H |  |
| Colorectum | FAP |  |
| ∗Top 15 enriched GO BP terms are showed in the bar plot of each disease state in each tissue. Each row represents a significant GO biological process which is colored according to the -log10(p.adjust). |
| Page: 1 2 3 4 5 6 7 8 9 |
| GO ID | Tissue | Disease Stage | Description | Gene Ratio | Bg Ratio | pvalue | p.adjust | Count |
| GO:00094511 | Oral cavity | OSCC | RNA modification | 95/7305 | 167/18723 | 2.05e-06 | 2.62e-05 | 95 |
| GO:00434142 | Oral cavity | OSCC | macromolecule methylation | 149/7305 | 316/18723 | 1.82e-03 | 8.60e-03 | 149 |
| GO:00322591 | Oral cavity | OSCC | methylation | 168/7305 | 364/18723 | 3.03e-03 | 1.31e-02 | 168 |
| GO:00800091 | Oral cavity | OSCC | mRNA methylation | 11/7305 | 16/18723 | 1.56e-02 | 4.99e-02 | 11 |
| GO:00322594 | Thyroid | PTC | methylation | 146/5968 | 364/18723 | 4.99e-04 | 3.26e-03 | 146 |
| GO:00434145 | Thyroid | PTC | macromolecule methylation | 127/5968 | 316/18723 | 1.02e-03 | 6.07e-03 | 127 |
| GO:004341412 | Thyroid | ATC | macromolecule methylation | 131/6293 | 316/18723 | 2.01e-03 | 9.60e-03 | 131 |
| GO:003225911 | Thyroid | ATC | methylation | 148/6293 | 364/18723 | 2.69e-03 | 1.23e-02 | 148 |
| Page: 1 |
| Pathway ID | Tissue | Disease Stage | Description | Gene Ratio | Bg Ratio | pvalue | p.adjust | qvalue | Count |
| Page: 1 |
Top |
Cell-cell communication analysis |
| Identification of potential cell-cell interactions between two cell types and their ligand-receptor pairs for different disease states |
| Ligand | Receptor | LRpair | Pathway | Tissue | Disease Stage |
| Page: 1 |
Top |
Single-cell gene regulatory network inference analysis |
| Find out the significant the regulons (TFs) and the target genes of each regulon across cell types for different disease states |
| TF | Cell Type | Tissue | Disease Stage | Target Gene | RSS | Regulon Activity |
| ∗The dot plots of a searched regulon are shown for all cell subpopulations in each disease state of each tissue based on the regulon specific score inferred using pySCENIC and by calculating the average expression. |
| Page: 1 |
Top |
Somatic mutation of malignant transformation related genes |
| Annotation of somatic variants for genes involved in malignant transformation |
| Hugo Symbol | Variant Class | Variant Classification | dbSNP RS | HGVSc | HGVSp | HGVSp Short | SWISSPROT | BIOTYPE | SIFT | PolyPhen | Tumor Sample Barcode | Tissue | Histology | Sex | Age | Stage | Therapy Types | Drugs | Outcome |
| CMTR2 | SNV | Missense_Mutation | rs755193044 | c.496N>T | p.His166Tyr | p.H166Y | Q8IYT2 | protein_coding | deleterious(0.05) | benign(0.137) | TCGA-AC-A23H-01 | Breast | breast invasive carcinoma | Female | >=65 | I/II | Unknown | Unknown | PD |
| CMTR2 | SNV | Missense_Mutation | novel | c.1610T>A | p.Phe537Tyr | p.F537Y | Q8IYT2 | protein_coding | tolerated(1) | benign(0.069) | TCGA-AC-A3QQ-01 | Breast | breast invasive carcinoma | Female | <65 | I/II | Unknown | Unknown | SD |
| CMTR2 | SNV | Missense_Mutation | rs780284216 | c.592N>A | p.His198Asn | p.H198N | Q8IYT2 | protein_coding | tolerated(0.24) | benign(0.024) | TCGA-AR-A0TY-01 | Breast | breast invasive carcinoma | Female | <65 | I/II | Unspecific | Paclitaxel | PD |
| CMTR2 | SNV | Missense_Mutation | c.742G>C | p.Glu248Gln | p.E248Q | Q8IYT2 | protein_coding | deleterious(0) | probably_damaging(1) | TCGA-BH-A0DZ-01 | Breast | breast invasive carcinoma | Female | <65 | I/II | Chemotherapy | docetaxel | SD | |
| CMTR2 | SNV | Missense_Mutation | c.830T>G | p.Phe277Cys | p.F277C | Q8IYT2 | protein_coding | deleterious(0) | probably_damaging(1) | TCGA-D8-A27M-01 | Breast | breast invasive carcinoma | Female | <65 | I/II | Chemotherapy | methotrexate+5 | SD | |
| CMTR2 | SNV | Missense_Mutation | c.43N>G | p.Pro15Ala | p.P15A | Q8IYT2 | protein_coding | tolerated_low_confidence(1) | benign(0.014) | TCGA-E2-A14R-01 | Breast | breast invasive carcinoma | Female | <65 | I/II | Chemotherapy | doxorubicin | PD | |
| CMTR2 | insertion | Nonsense_Mutation | novel | c.310_311insGCTTTAGTTTCTTCTTTGCATTACTGTGAAGTTGTCACTGCTCTGACC | p.Lys104delinsSerPheSerPhePhePheAlaLeuLeuTerSerCysHisCysSerAspGln | p.K104delinsSFSFFFALL*SCHCSDQ | Q8IYT2 | protein_coding | TCGA-A2-A0EO-01 | Breast | breast invasive carcinoma | Female | <65 | I/II | Hormone Therapy | tamoxiphen | SD | ||
| CMTR2 | insertion | Nonsense_Mutation | novel | c.1515_1516insTTTGCAGAGTGTGAATGAATTGTTGAGCACTT | p.Lys506PhefsTer6 | p.K506Ffs*6 | Q8IYT2 | protein_coding | TCGA-A8-A07J-01 | Breast | breast invasive carcinoma | Female | <65 | I/II | Chemotherapy | 5-fluorouracil | CR | ||
| CMTR2 | insertion | Frame_Shift_Ins | novel | c.951_952insAT | p.Leu318IlefsTer17 | p.L318Ifs*17 | Q8IYT2 | protein_coding | TCGA-AN-A046-01 | Breast | breast invasive carcinoma | Female | >=65 | I/II | Unknown | Unknown | SD | ||
| CMTR2 | insertion | Nonsense_Mutation | novel | c.950_951insAGATTTTTAATTTGTAATATCTATTAAAAAACAAA | p.Cys317Ter | p.C317* | Q8IYT2 | protein_coding | TCGA-AN-A046-01 | Breast | breast invasive carcinoma | Female | >=65 | I/II | Unknown | Unknown | SD |
| Page: 1 2 3 4 5 6 7 8 9 10 |
Top |
Related drugs of malignant transformation related genes |
| Identification of chemicals and drugs interact with genes involved in malignant transfromation |
| (DGIdb 4.0) |
| Entrez ID | Symbol | Category | Interaction Types | Drug Claim Name | Drug Name | PMIDs |
| Page: 1 |

Copyright 2023-Present -The University of Texas Health Science Center at Houston |