
|
|||||
|
 | |
| |
| |
| |
| |
| |
|
Gene: CMTR1 |
Gene summary for CMTR1 |
| Gene information | Species | Human | Gene symbol | CMTR1 | Gene ID | 23070 |
| Gene name | cap methyltransferase 1 | |
| Gene Alias | FTSJD2 | |
| Cytomap | 6p21.2 | |
| Gene Type | protein-coding | GO ID | GO:0001510 | UniProtAcc | Q8N1G2 |
Top |
Malignant transformation analysis |
| Identification of the aberrant gene expression in precancerous and cancerous lesions by comparing the gene expression of stem-like cells in diseased tissues with normal stem cells |
| Entrez ID | Symbol | Replicates | Species | Organ | Tissue | Adj P-value | Log2FC | Malignancy |
| 23070 | CMTR1 | LZE7T | Human | Esophagus | ESCC | 3.46e-03 | 1.98e-01 | 0.0667 |
| 23070 | CMTR1 | LZE24T | Human | Esophagus | ESCC | 8.89e-08 | 2.26e-01 | 0.0596 |
| 23070 | CMTR1 | P1T-E | Human | Esophagus | ESCC | 5.49e-10 | 3.32e-01 | 0.0875 |
| 23070 | CMTR1 | P2T-E | Human | Esophagus | ESCC | 1.43e-20 | 3.65e-01 | 0.1177 |
| 23070 | CMTR1 | P4T-E | Human | Esophagus | ESCC | 2.95e-10 | 1.63e-01 | 0.1323 |
| 23070 | CMTR1 | P5T-E | Human | Esophagus | ESCC | 1.72e-10 | 1.06e-01 | 0.1327 |
| 23070 | CMTR1 | P8T-E | Human | Esophagus | ESCC | 1.36e-10 | 1.63e-01 | 0.0889 |
| 23070 | CMTR1 | P9T-E | Human | Esophagus | ESCC | 2.12e-03 | 1.09e-01 | 0.1131 |
| 23070 | CMTR1 | P10T-E | Human | Esophagus | ESCC | 2.56e-08 | 1.47e-01 | 0.116 |
| 23070 | CMTR1 | P11T-E | Human | Esophagus | ESCC | 3.95e-06 | 3.42e-01 | 0.1426 |
| 23070 | CMTR1 | P12T-E | Human | Esophagus | ESCC | 1.63e-07 | 1.86e-01 | 0.1122 |
| 23070 | CMTR1 | P15T-E | Human | Esophagus | ESCC | 1.29e-08 | 2.30e-01 | 0.1149 |
| 23070 | CMTR1 | P16T-E | Human | Esophagus | ESCC | 3.63e-13 | 1.59e-01 | 0.1153 |
| 23070 | CMTR1 | P17T-E | Human | Esophagus | ESCC | 2.48e-04 | 3.11e-01 | 0.1278 |
| 23070 | CMTR1 | P19T-E | Human | Esophagus | ESCC | 1.08e-02 | 2.81e-01 | 0.1662 |
| 23070 | CMTR1 | P20T-E | Human | Esophagus | ESCC | 9.44e-04 | 8.74e-02 | 0.1124 |
| 23070 | CMTR1 | P21T-E | Human | Esophagus | ESCC | 6.14e-09 | 1.66e-01 | 0.1617 |
| 23070 | CMTR1 | P22T-E | Human | Esophagus | ESCC | 3.63e-11 | 1.44e-01 | 0.1236 |
| 23070 | CMTR1 | P23T-E | Human | Esophagus | ESCC | 7.83e-04 | 1.52e-01 | 0.108 |
| 23070 | CMTR1 | P24T-E | Human | Esophagus | ESCC | 1.67e-08 | 1.77e-01 | 0.1287 |
| Page: 1 2 3 |
| Tissue | Expression Dynamics | Abbreviation |
| Esophagus | 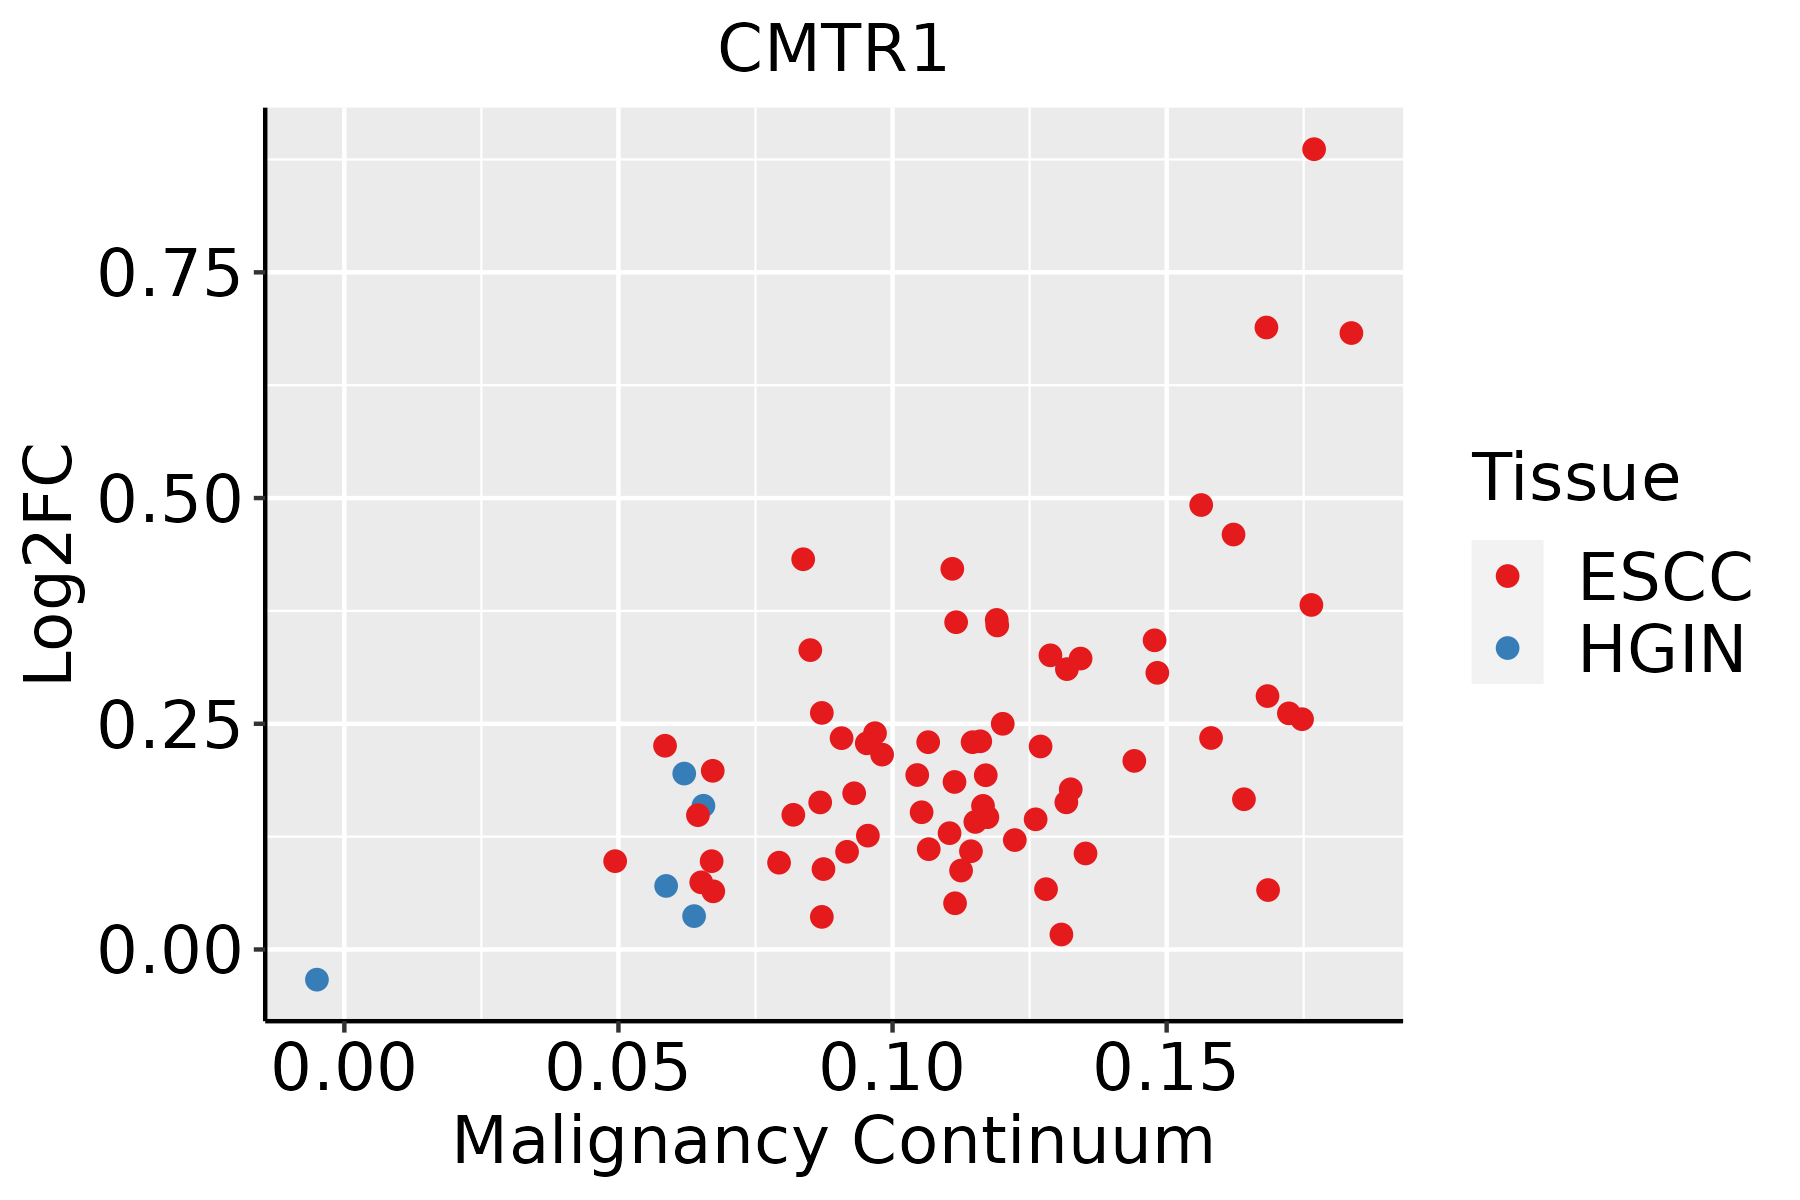 | ESCC: Esophageal squamous cell carcinoma |
| HGIN: High-grade intraepithelial neoplasias | ||
| LGIN: Low-grade intraepithelial neoplasias |
| ∗log2FC in expression of this searched gene in stem-like cells from each diseased tissue sample relative to stem-like cells in normal samples in each tissue plotted against the malignancy continuum. Samples are colored based on if they are from different disease stage. |
Top |
Malignant transformation related pathway analysis |
| Find out the enriched GO biological processes and KEGG pathways involved in transition from healthy to precancer to cancer |
| Tissue | Disease Stage | Enriched GO biological Processes |
| Colorectum | AD |  |
| Colorectum | SER |  |
| Colorectum | MSS |  |
| Colorectum | MSI-H |  |
| Colorectum | FAP |  |
| ∗Top 15 enriched GO BP terms are showed in the bar plot of each disease state in each tissue. Each row represents a significant GO biological process which is colored according to the -log10(p.adjust). |
| Page: 1 2 3 4 5 6 7 8 9 |
| GO ID | Tissue | Disease Stage | Description | Gene Ratio | Bg Ratio | pvalue | p.adjust | Count |
| GO:00434143 | Esophagus | ESCC | macromolecule methylation | 199/8552 | 316/18723 | 3.44e-10 | 9.57e-09 | 199 |
| GO:00322592 | Esophagus | ESCC | methylation | 222/8552 | 364/18723 | 2.26e-09 | 5.09e-08 | 222 |
| GO:00094512 | Esophagus | ESCC | RNA modification | 114/8552 | 167/18723 | 2.76e-09 | 6.04e-08 | 114 |
| GO:00015101 | Esophagus | ESCC | RNA methylation | 58/8552 | 83/18723 | 6.87e-06 | 6.94e-05 | 58 |
| GO:00800092 | Esophagus | ESCC | mRNA methylation | 14/8552 | 16/18723 | 6.78e-04 | 3.56e-03 | 14 |
| GO:00165561 | Esophagus | ESCC | mRNA modification | 21/8552 | 27/18723 | 6.88e-04 | 3.61e-03 | 21 |
| Page: 1 |
| Pathway ID | Tissue | Disease Stage | Description | Gene Ratio | Bg Ratio | pvalue | p.adjust | qvalue | Count |
| Page: 1 |
Top |
Cell-cell communication analysis |
| Identification of potential cell-cell interactions between two cell types and their ligand-receptor pairs for different disease states |
| Ligand | Receptor | LRpair | Pathway | Tissue | Disease Stage |
| Page: 1 |
Top |
Single-cell gene regulatory network inference analysis |
| Find out the significant the regulons (TFs) and the target genes of each regulon across cell types for different disease states |
| TF | Cell Type | Tissue | Disease Stage | Target Gene | RSS | Regulon Activity |
| ∗The dot plots of a searched regulon are shown for all cell subpopulations in each disease state of each tissue based on the regulon specific score inferred using pySCENIC and by calculating the average expression. |
| Page: 1 |
Top |
Somatic mutation of malignant transformation related genes |
| Annotation of somatic variants for genes involved in malignant transformation |
| Hugo Symbol | Variant Class | Variant Classification | dbSNP RS | HGVSc | HGVSp | HGVSp Short | SWISSPROT | BIOTYPE | SIFT | PolyPhen | Tumor Sample Barcode | Tissue | Histology | Sex | Age | Stage | Therapy Types | Drugs | Outcome |
| CMTR1 | SNV | Missense_Mutation | c.517N>A | p.Asp173Asn | p.D173N | Q8N1G2 | protein_coding | tolerated(0.38) | benign(0.009) | TCGA-A2-A0T6-01 | Breast | breast invasive carcinoma | Female | <65 | I/II | Chemotherapy | adriamycin | SD | |
| CMTR1 | SNV | Missense_Mutation | c.1070N>A | p.Gly357Asp | p.G357D | Q8N1G2 | protein_coding | deleterious(0) | probably_damaging(1) | TCGA-AN-A0AK-01 | Breast | breast invasive carcinoma | Female | >=65 | I/II | Unknown | Unknown | SD | |
| CMTR1 | SNV | Missense_Mutation | c.2374N>T | p.His792Tyr | p.H792Y | Q8N1G2 | protein_coding | tolerated(0.72) | benign(0) | TCGA-AN-A0XW-01 | Breast | breast invasive carcinoma | Female | <65 | III/IV | Unknown | Unknown | SD | |
| CMTR1 | SNV | Missense_Mutation | c.1096N>T | p.Gly366Cys | p.G366C | Q8N1G2 | protein_coding | deleterious(0) | probably_damaging(0.997) | TCGA-D8-A146-01 | Breast | breast invasive carcinoma | Female | <65 | I/II | Unknown | Unknown | SD | |
| CMTR1 | insertion | In_Frame_Ins | novel | c.1783_1784insAGT | p.Val595delinsGluLeu | p.V595delinsEL | Q8N1G2 | protein_coding | TCGA-A2-A0CP-01 | Breast | breast invasive carcinoma | Female | <65 | I/II | Chemotherapy | cytoxan | SD | ||
| CMTR1 | insertion | Frame_Shift_Ins | novel | c.1785_1786insACATTTGTTAAATATATATATTTTTTTCTTTTTCTTTT | p.Ser596ThrfsTer43 | p.S596Tfs*43 | Q8N1G2 | protein_coding | TCGA-A2-A0CP-01 | Breast | breast invasive carcinoma | Female | <65 | I/II | Chemotherapy | cytoxan | SD | ||
| CMTR1 | insertion | Nonsense_Mutation | novel | c.719_720insAGTTGAGAGAGTTATTGAGCAGCCTGTGTAGGGTCACACAGTGA | p.Met240IlefsTer11 | p.M240Ifs*11 | Q8N1G2 | protein_coding | TCGA-AR-A0TY-01 | Breast | breast invasive carcinoma | Female | <65 | I/II | Unspecific | Paclitaxel | PD | ||
| CMTR1 | insertion | Frame_Shift_Ins | novel | c.910_911insATATTCTGTTCAGTAGGACTCTTGAAAGGCAGGATAT | p.Gly304AspfsTer15 | p.G304Dfs*15 | Q8N1G2 | protein_coding | TCGA-BH-A0EE-01 | Breast | breast invasive carcinoma | Female | >=65 | I/II | Chemotherapy | docetaxel | SD | ||
| CMTR1 | SNV | Missense_Mutation | c.2381N>C | p.Cys794Ser | p.C794S | Q8N1G2 | protein_coding | deleterious(0.04) | probably_damaging(0.994) | TCGA-DS-A1OC-01 | Cervix | cervical & endocervical cancer | Female | <65 | I/II | Chemotherapy | gemcitabine | SD | |
| CMTR1 | SNV | Missense_Mutation | c.2052N>T | p.Glu684Asp | p.E684D | Q8N1G2 | protein_coding | tolerated(0.08) | benign(0.005) | TCGA-FU-A3HZ-01 | Cervix | cervical & endocervical cancer | Female | <65 | I/II | Chemotherapy | cisplatin | CR |
| Page: 1 2 3 4 5 6 7 8 |
Top |
Related drugs of malignant transformation related genes |
| Identification of chemicals and drugs interact with genes involved in malignant transfromation |
| (DGIdb 4.0) |
| Entrez ID | Symbol | Category | Interaction Types | Drug Claim Name | Drug Name | PMIDs |
| Page: 1 |

Copyright 2023-Present -The University of Texas Health Science Center at Houston |